
|
|||||
|
 | |
| |
| |
| |
| |
| |
|
Gene: TK1 |
Gene summary for TK1 |
| Gene information | Species | Human | Gene symbol | TK1 | Gene ID | 7083 |
| Gene name | thymidine kinase 1 | |
| Gene Alias | TK2 | |
| Cytomap | 17q25.3 | |
| Gene Type | protein-coding | GO ID | GO:0006139 | UniProtAcc | K7ES52 |
Top |
Malignant transformation analysis |
| Identification of the aberrant gene expression in precancerous and cancerous lesions by comparing the gene expression of stem-like cells in diseased tissues with normal stem cells |
| Entrez ID | Symbol | Replicates | Species | Organ | Tissue | Adj P-value | Log2FC | Malignancy |
| 7083 | TK1 | GSM4909281 | Human | Breast | IDC | 2.46e-07 | 3.49e-01 | 0.21 |
| 7083 | TK1 | GSM4909282 | Human | Breast | IDC | 2.01e-40 | 8.20e-01 | -0.0288 |
| 7083 | TK1 | GSM4909287 | Human | Breast | IDC | 4.87e-09 | 4.14e-01 | 0.2057 |
| 7083 | TK1 | GSM4909290 | Human | Breast | IDC | 3.55e-07 | 3.64e-01 | 0.2096 |
| 7083 | TK1 | GSM4909291 | Human | Breast | IDC | 1.60e-05 | 3.99e-01 | 0.1753 |
| 7083 | TK1 | GSM4909296 | Human | Breast | IDC | 1.91e-02 | 1.76e-01 | 0.1524 |
| 7083 | TK1 | GSM4909319 | Human | Breast | IDC | 1.99e-17 | 4.86e-01 | 0.1563 |
| 7083 | TK1 | M2 | Human | Breast | IDC | 1.18e-07 | 7.21e-01 | 0.21 |
| 7083 | TK1 | P2 | Human | Breast | IDC | 3.72e-11 | 5.95e-01 | 0.21 |
| 7083 | TK1 | HTA11_1938_2000001011 | Human | Colorectum | AD | 7.07e-07 | 4.75e-01 | -0.0811 |
| 7083 | TK1 | HTA11_347_2000001011 | Human | Colorectum | AD | 1.29e-02 | 1.86e-01 | -0.1954 |
| 7083 | TK1 | HTA11_3361_2000001011 | Human | Colorectum | AD | 8.40e-05 | 4.51e-01 | -0.1207 |
| 7083 | TK1 | HTA11_696_2000001011 | Human | Colorectum | AD | 5.89e-17 | 5.81e-01 | -0.1464 |
| 7083 | TK1 | HTA11_1391_2000001011 | Human | Colorectum | AD | 1.73e-11 | 6.20e-01 | -0.059 |
| 7083 | TK1 | HTA11_546_2000001011 | Human | Colorectum | AD | 2.87e-02 | 3.46e-01 | -0.0842 |
| 7083 | TK1 | HTA11_7696_3000711011 | Human | Colorectum | AD | 4.49e-04 | 1.99e-01 | 0.0674 |
| 7083 | TK1 | HTA11_99999970781_79442 | Human | Colorectum | MSS | 4.03e-13 | 3.84e-01 | 0.294 |
| 7083 | TK1 | LZE2T | Human | Esophagus | ESCC | 8.25e-06 | 7.51e-01 | 0.082 |
| 7083 | TK1 | LZE22T | Human | Esophagus | ESCC | 9.86e-06 | 1.02e+00 | 0.068 |
| 7083 | TK1 | LZE24T | Human | Esophagus | ESCC | 2.25e-05 | 2.39e-01 | 0.0596 |
| Page: 1 2 3 4 5 6 |
| Tissue | Expression Dynamics | Abbreviation |
| Breast | 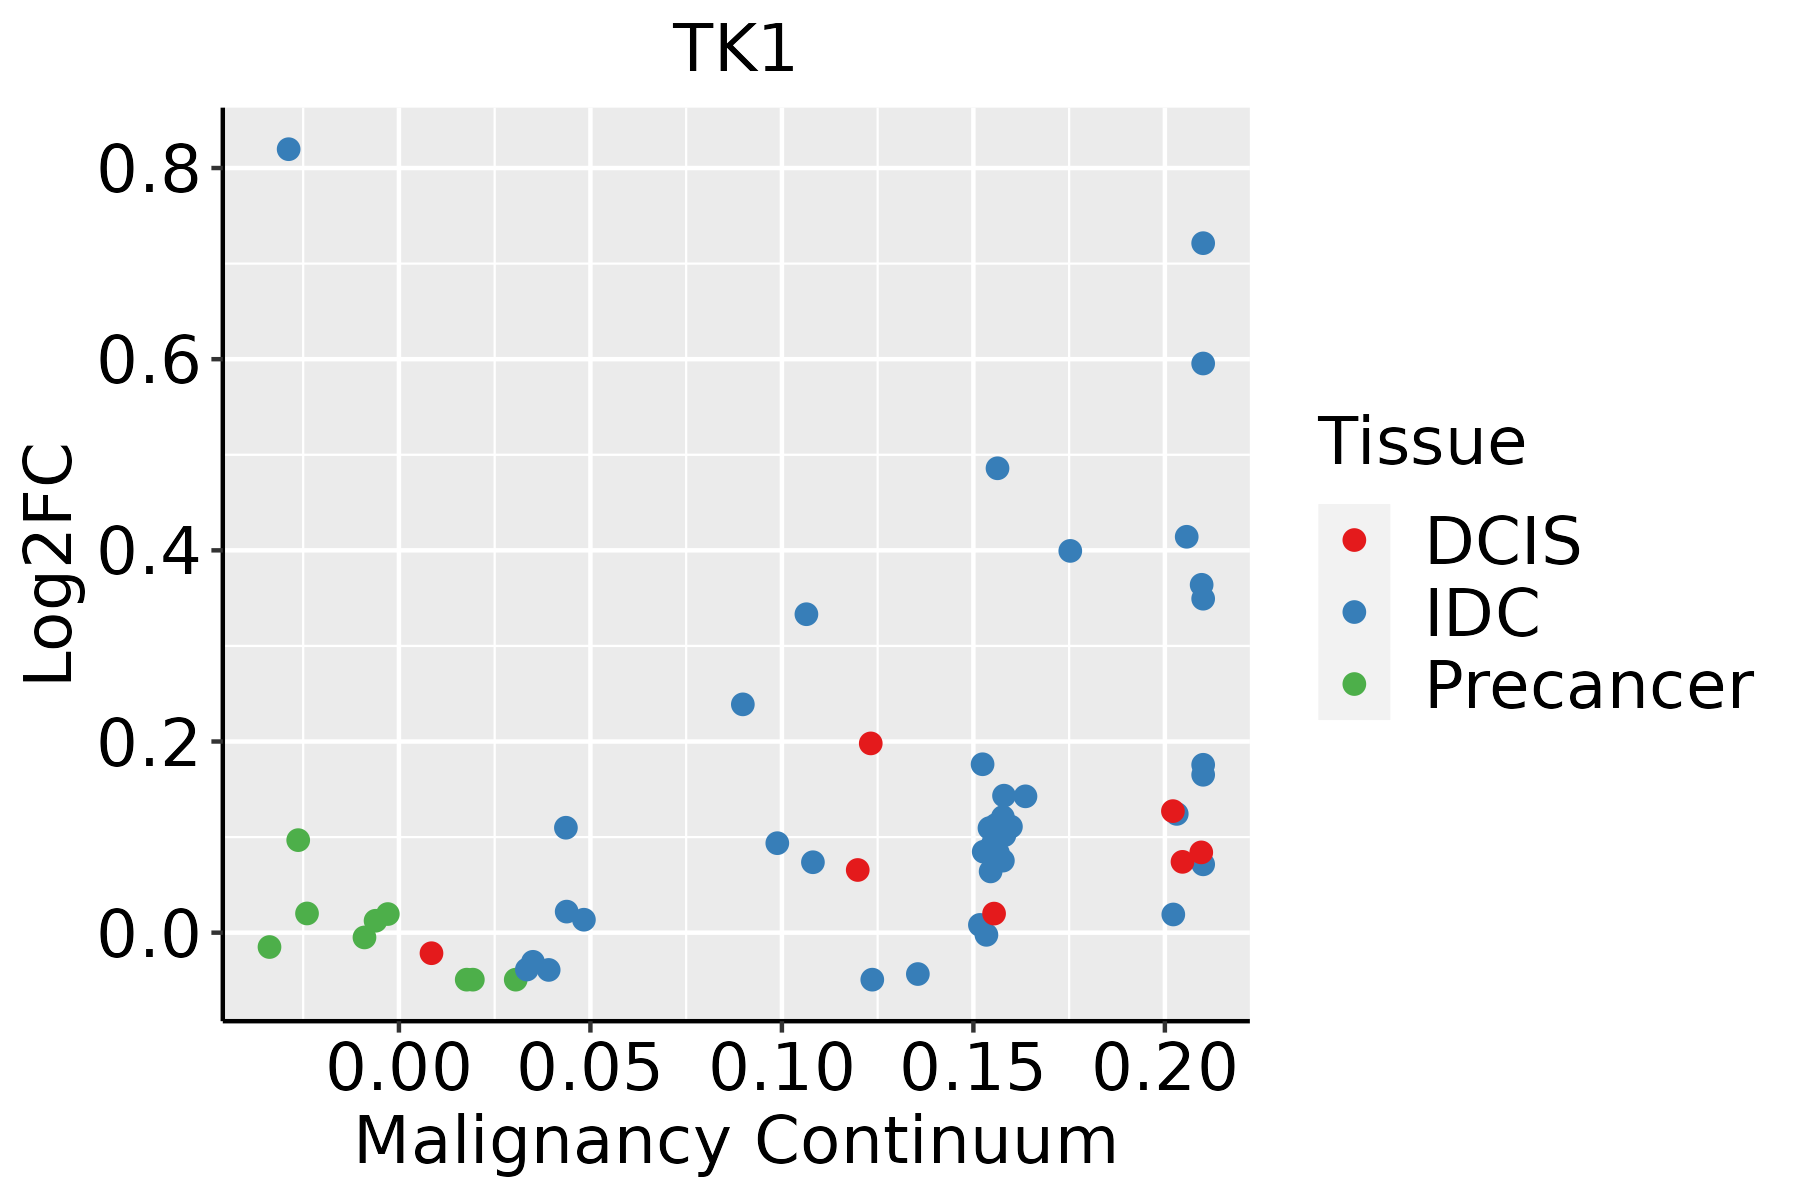 | IDC: Invasive ductal carcinoma |
| DCIS: Ductal carcinoma in situ | ||
| Precancer(BRCA1-mut): Precancerous lesion from BRCA1 mutation carriers | ||
| Colorectum (GSE201348) |  | FAP: Familial adenomatous polyposis |
| CRC: Colorectal cancer | ||
| Colorectum (HTA11) |  | AD: Adenomas |
| SER: Sessile serrated lesions | ||
| MSI-H: Microsatellite-high colorectal cancer | ||
| MSS: Microsatellite stable colorectal cancer | ||
| Esophagus | 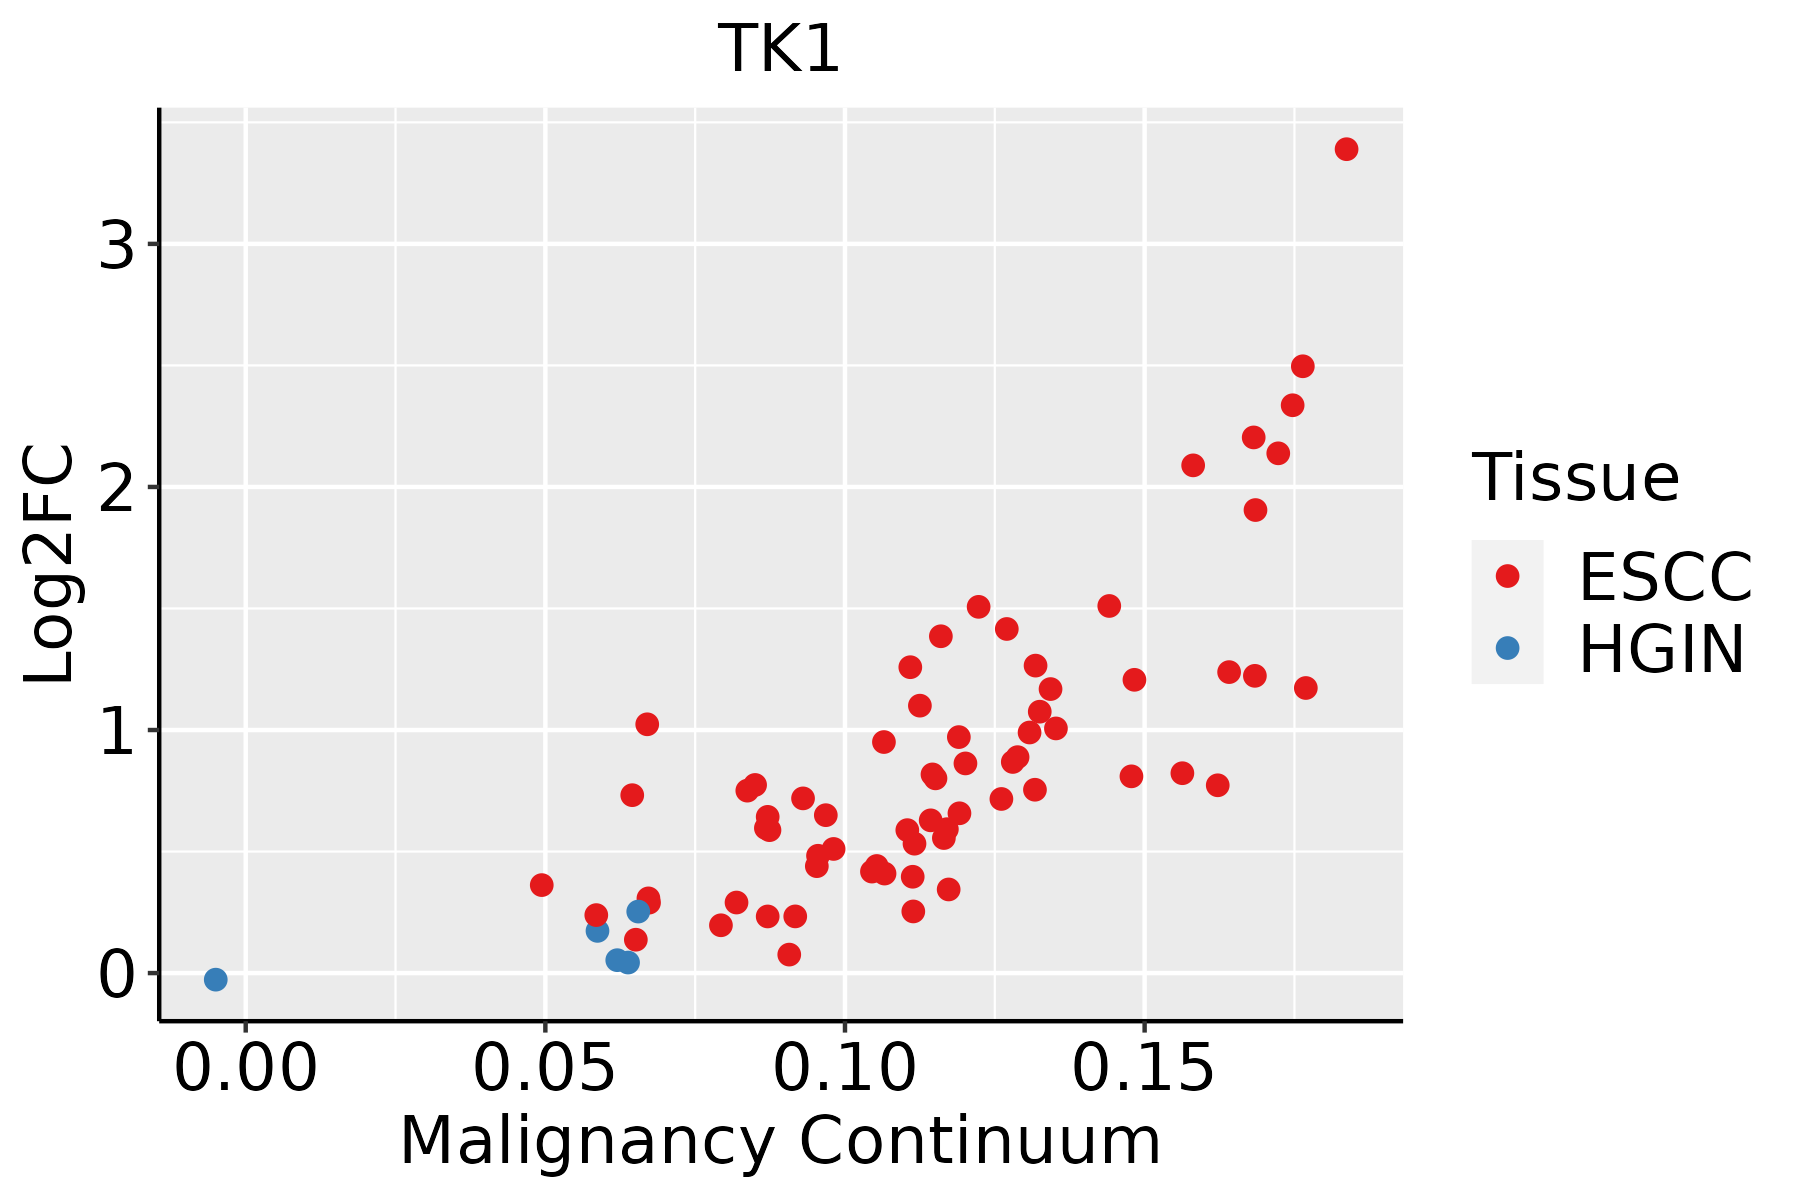 | ESCC: Esophageal squamous cell carcinoma |
| HGIN: High-grade intraepithelial neoplasias | ||
| LGIN: Low-grade intraepithelial neoplasias | ||
| Liver | 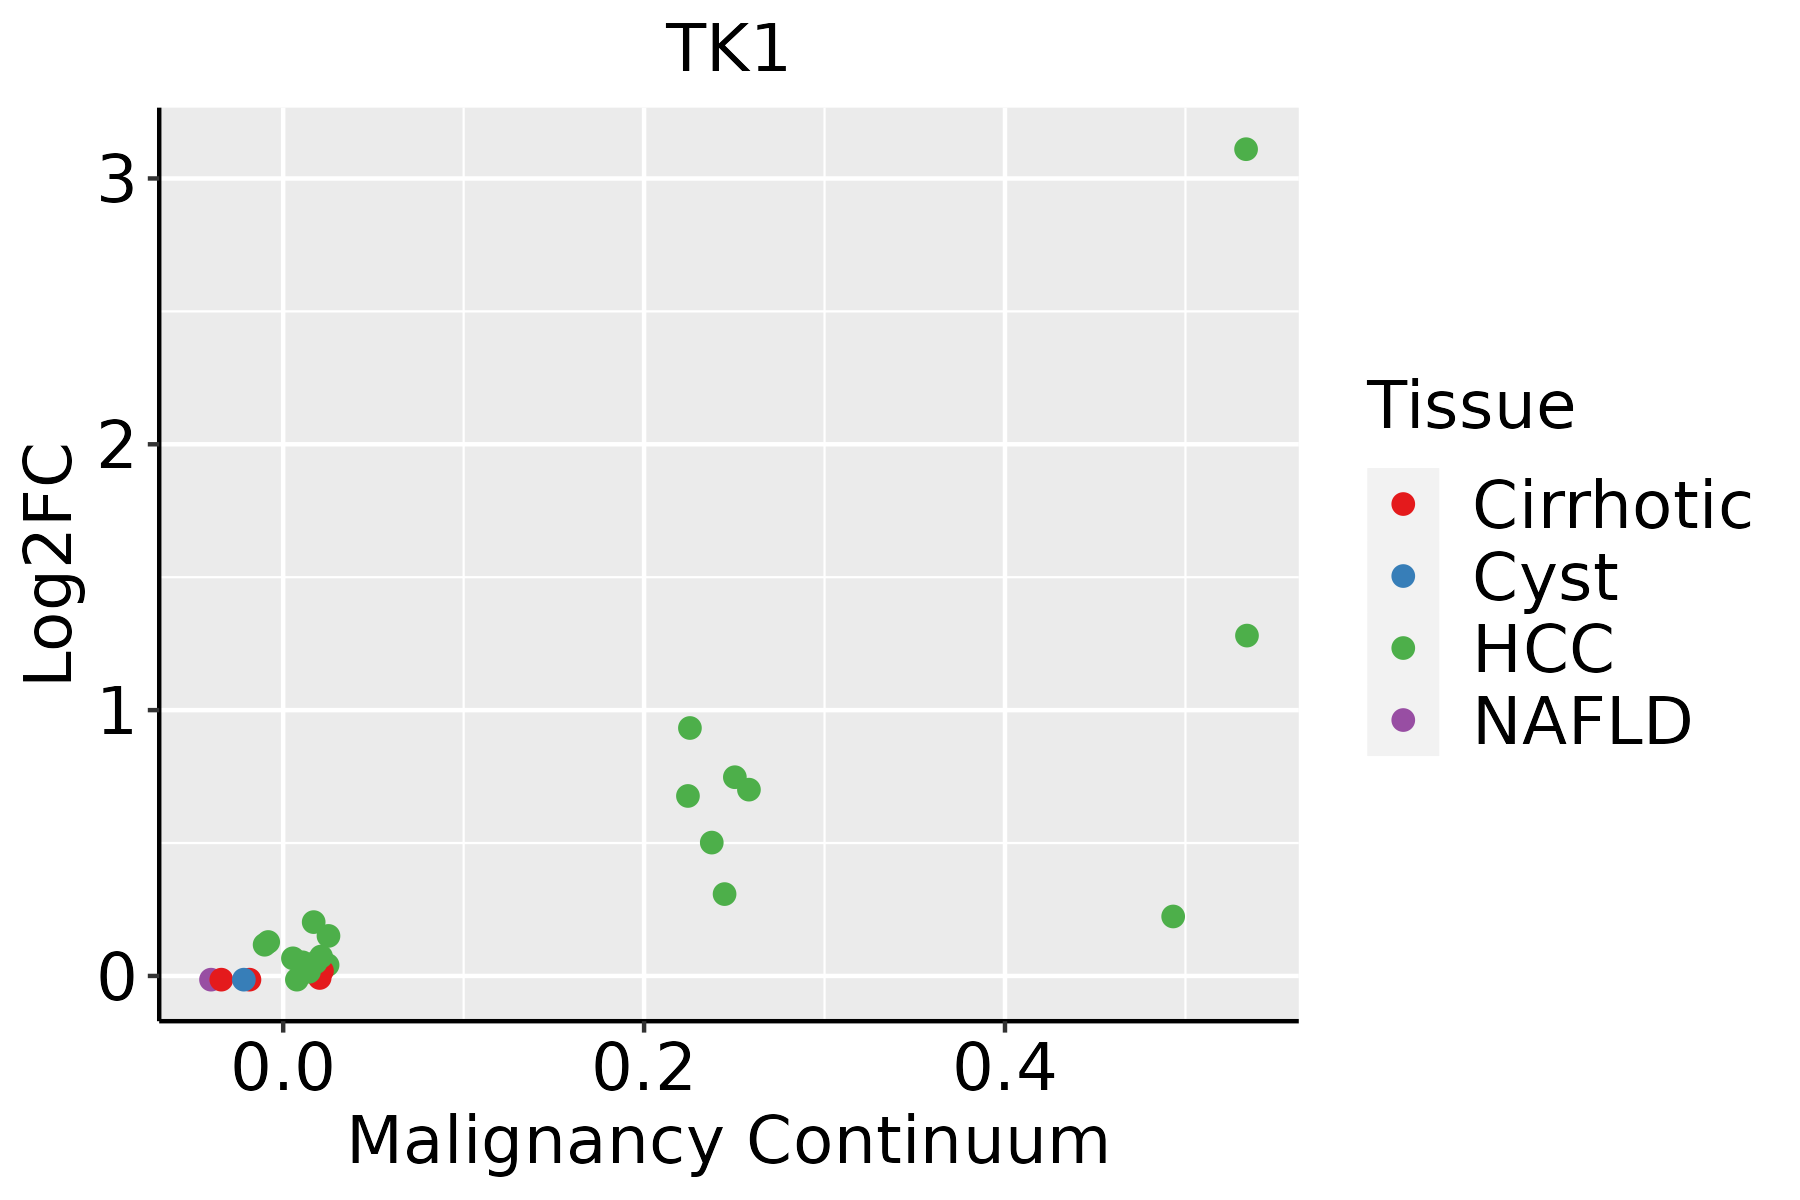 | HCC: Hepatocellular carcinoma |
| NAFLD: Non-alcoholic fatty liver disease | ||
| Oral Cavity |  | EOLP: Erosive Oral lichen planus |
| LP: leukoplakia | ||
| NEOLP: Non-erosive oral lichen planus | ||
| OSCC: Oral squamous cell carcinoma | ||
| Skin | 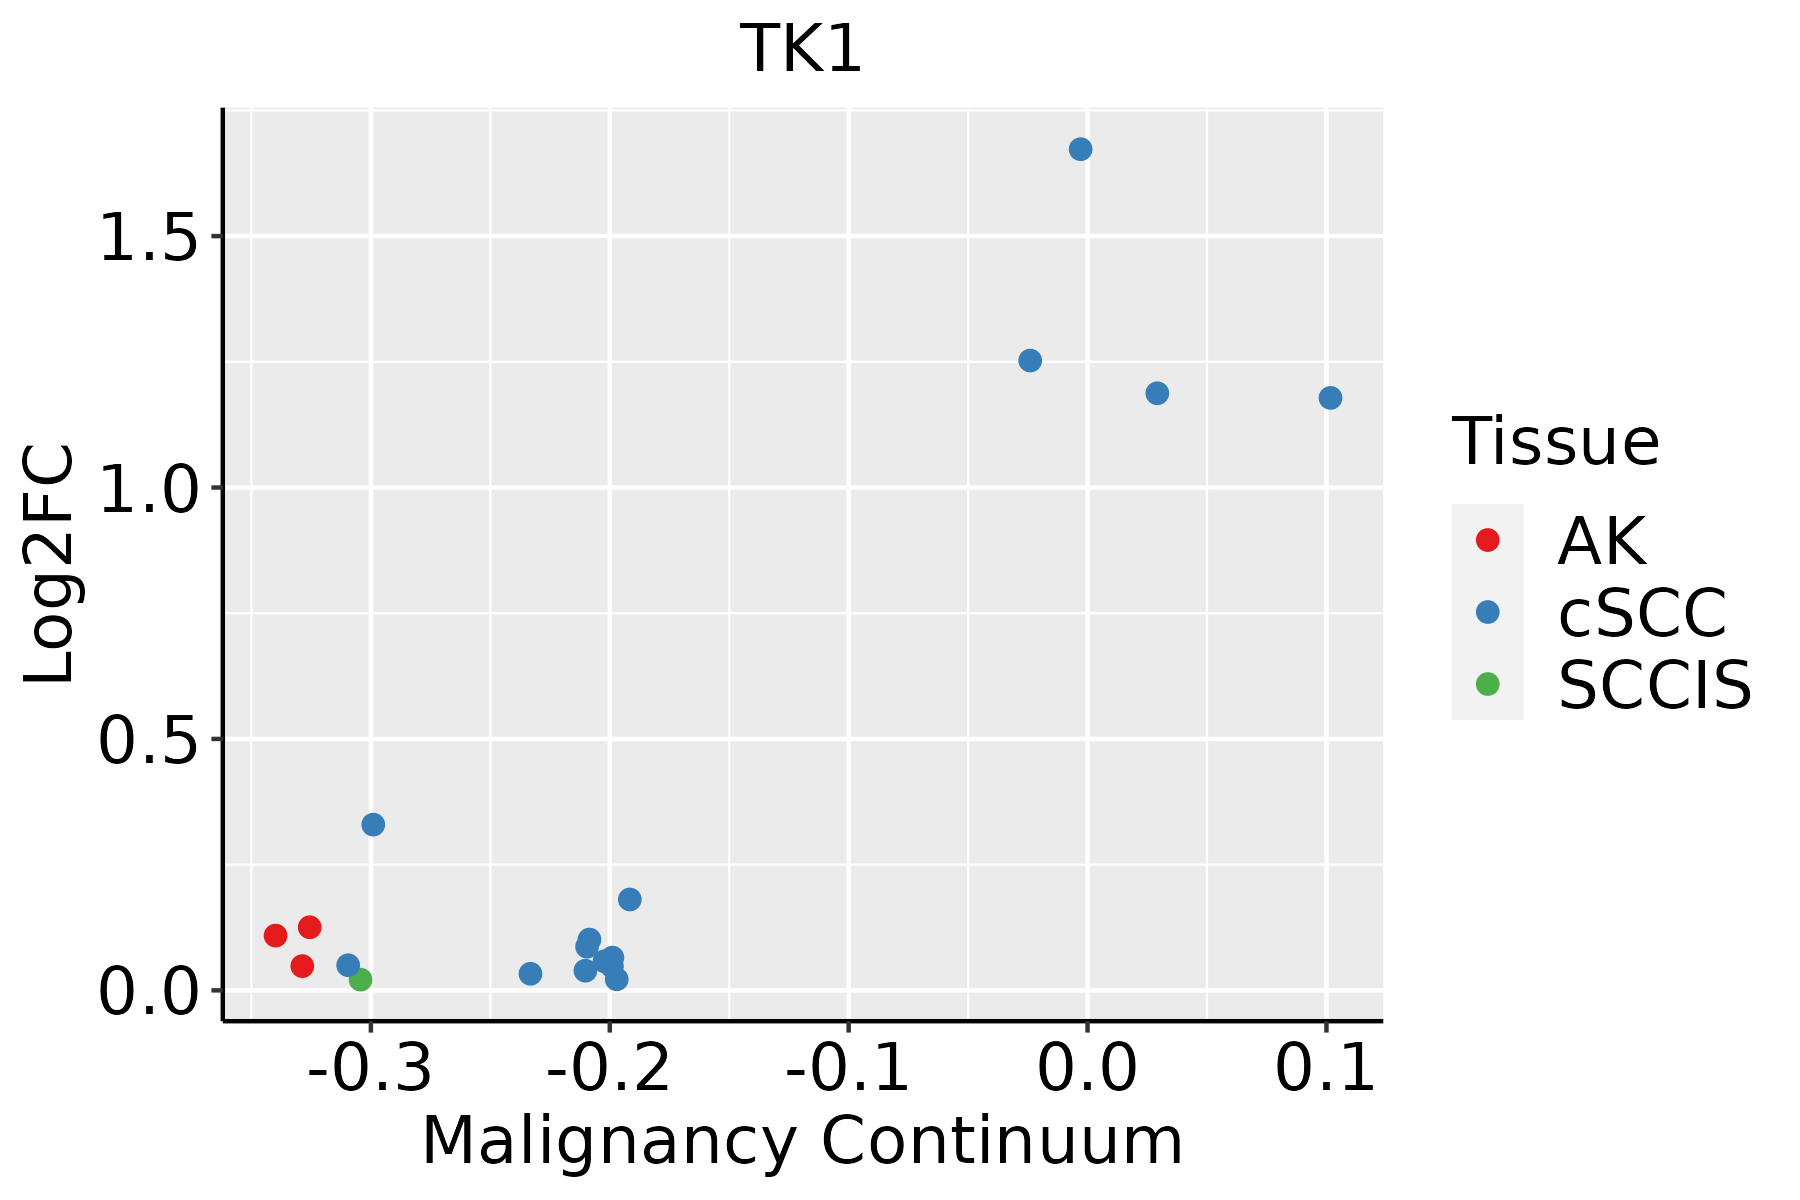 | AK: Actinic keratosis |
| cSCC: Cutaneous squamous cell carcinoma | ||
| SCCIS:squamous cell carcinoma in situ | ||
| Thyroid | 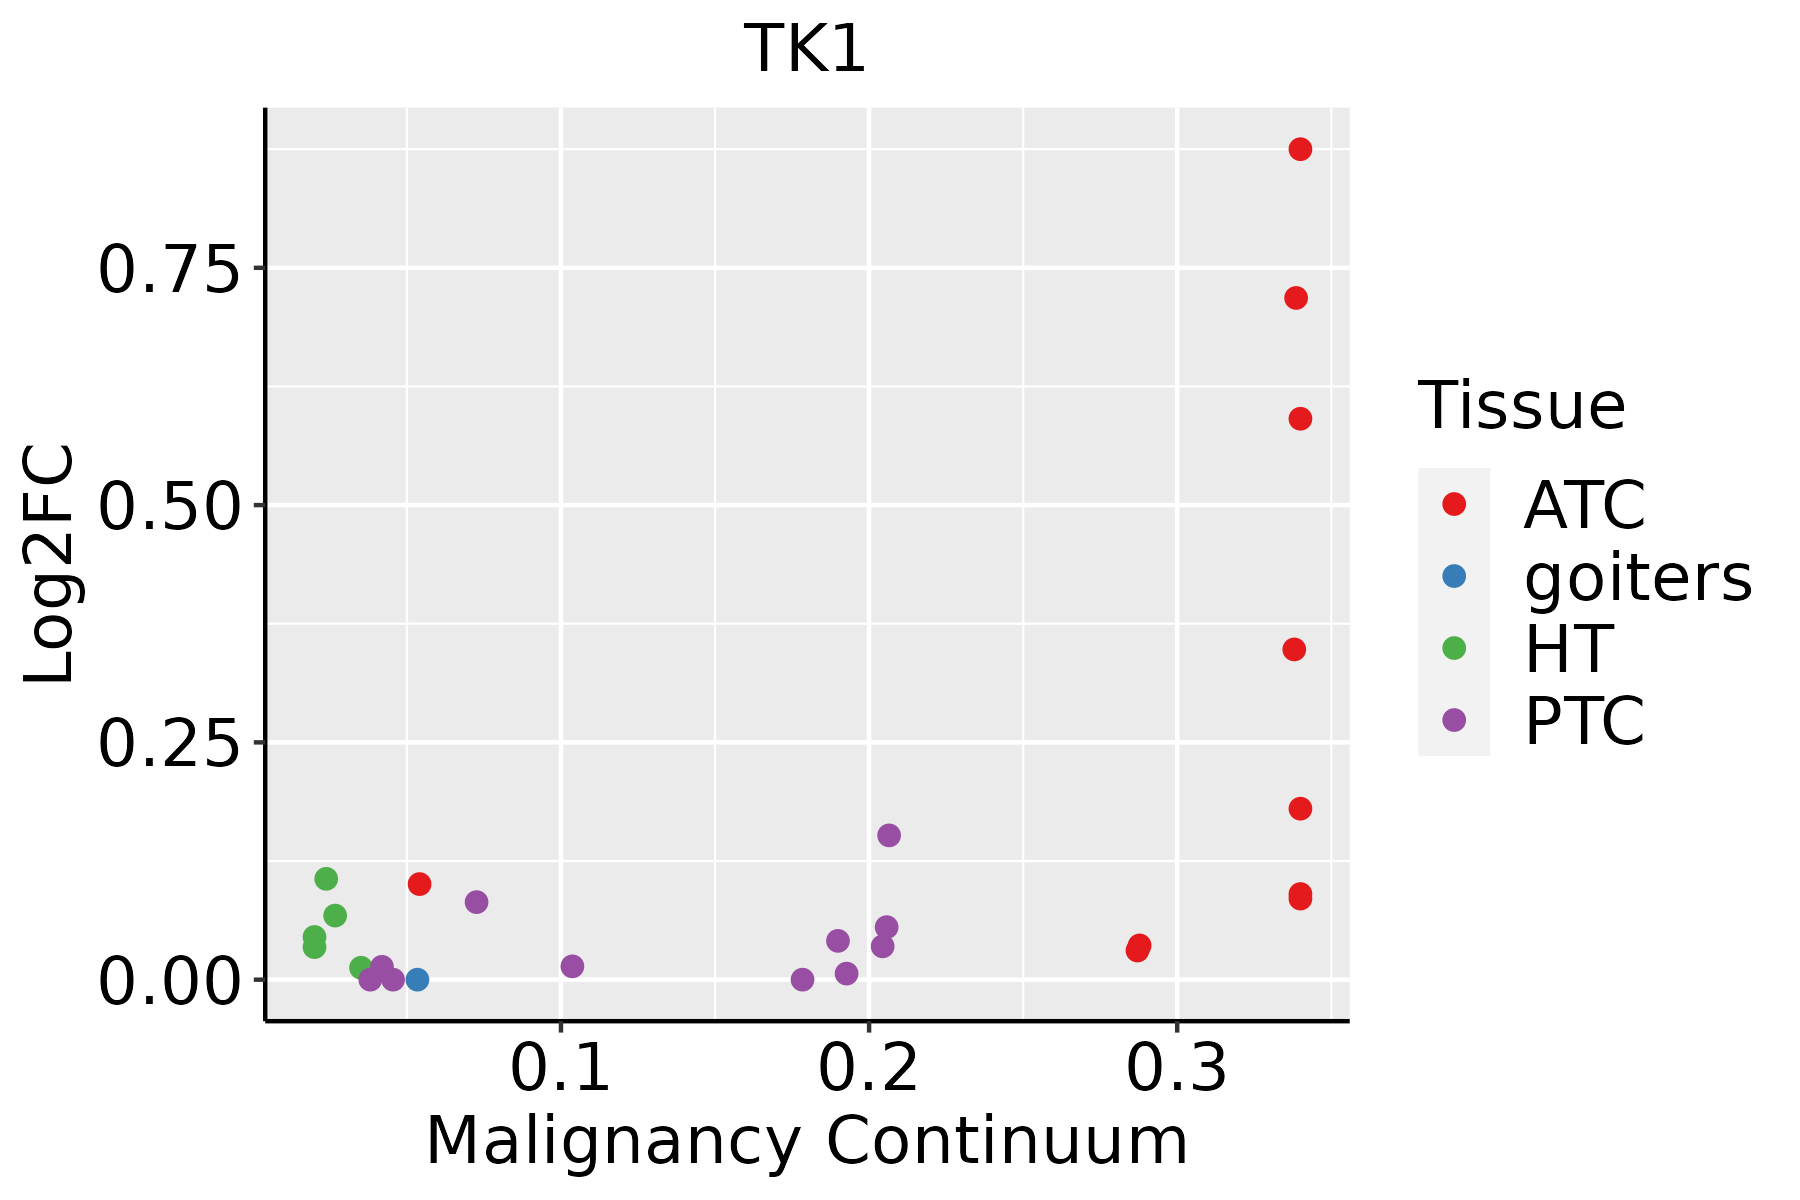 | ATC: Anaplastic thyroid cancer |
| HT: Hashimoto's thyroiditis | ||
| PTC: Papillary thyroid cancer |
| ∗log2FC in expression of this searched gene in stem-like cells from each diseased tissue sample relative to stem-like cells in normal samples in each tissue plotted against the malignancy continuum. Samples are colored based on if they are from different disease stage. |
Top |
Malignant transformation related pathway analysis |
| Find out the enriched GO biological processes and KEGG pathways involved in transition from healthy to precancer to cancer |
| Tissue | Disease Stage | Enriched GO biological Processes |
| Colorectum | AD |  |
| Colorectum | SER |  |
| Colorectum | MSS |  |
| Colorectum | MSI-H |  |
| Colorectum | FAP |  |
| ∗Top 15 enriched GO BP terms are showed in the bar plot of each disease state in each tissue. Each row represents a significant GO biological process which is colored according to the -log10(p.adjust). |
| Page: 1 2 3 4 5 6 7 8 9 |
| GO ID | Tissue | Disease Stage | Description | Gene Ratio | Bg Ratio | pvalue | p.adjust | Count |
| GO:190018023 | Thyroid | ATC | regulation of protein localization to nucleus | 87/6293 | 136/18723 | 3.94e-13 | 1.79e-11 | 87 |
| GO:007155925 | Thyroid | ATC | response to transforming growth factor beta | 142/6293 | 256/18723 | 4.30e-13 | 1.94e-11 | 142 |
| GO:007156026 | Thyroid | ATC | cellular response to transforming growth factor beta stimulus | 137/6293 | 250/18723 | 3.69e-12 | 1.49e-10 | 137 |
| GO:000716329 | Thyroid | ATC | establishment or maintenance of cell polarity | 122/6293 | 218/18723 | 8.46e-12 | 3.16e-10 | 122 |
| GO:190018222 | Thyroid | ATC | positive regulation of protein localization to nucleus | 60/6293 | 87/18723 | 1.63e-11 | 5.88e-10 | 60 |
| GO:000726524 | Thyroid | ATC | Ras protein signal transduction | 172/6293 | 337/18723 | 2.25e-11 | 7.96e-10 | 172 |
| GO:000717924 | Thyroid | ATC | transforming growth factor beta receptor signaling pathway | 112/6293 | 198/18723 | 2.42e-11 | 8.44e-10 | 112 |
| GO:007121427 | Thyroid | ATC | cellular response to abiotic stimulus | 169/6293 | 331/18723 | 3.24e-11 | 1.08e-09 | 169 |
| GO:010400427 | Thyroid | ATC | cellular response to environmental stimulus | 169/6293 | 331/18723 | 3.24e-11 | 1.08e-09 | 169 |
| GO:006082825 | Thyroid | ATC | regulation of canonical Wnt signaling pathway | 134/6293 | 253/18723 | 1.49e-10 | 4.56e-09 | 134 |
| GO:004873233 | Thyroid | ATC | gland development | 210/6293 | 436/18723 | 1.50e-10 | 4.59e-09 | 210 |
| GO:000155826 | Thyroid | ATC | regulation of cell growth | 201/6293 | 414/18723 | 1.57e-10 | 4.76e-09 | 201 |
| GO:006007025 | Thyroid | ATC | canonical Wnt signaling pathway | 154/6293 | 303/18723 | 3.68e-10 | 1.02e-08 | 154 |
| GO:001097523 | Thyroid | ATC | regulation of neuron projection development | 212/6293 | 445/18723 | 4.16e-10 | 1.14e-08 | 212 |
| GO:006156423 | Thyroid | ATC | axon development | 220/6293 | 467/18723 | 6.85e-10 | 1.80e-08 | 220 |
| GO:004586026 | Thyroid | ATC | positive regulation of protein kinase activity | 185/6293 | 386/18723 | 3.00e-09 | 7.02e-08 | 185 |
| GO:003070532 | Thyroid | ATC | cytoskeleton-dependent intracellular transport | 105/6293 | 195/18723 | 4.31e-09 | 9.70e-08 | 105 |
| GO:007147825 | Thyroid | ATC | cellular response to radiation | 101/6293 | 186/18723 | 4.67e-09 | 1.04e-07 | 101 |
| GO:000740919 | Thyroid | ATC | axonogenesis | 197/6293 | 418/18723 | 5.09e-09 | 1.13e-07 | 197 |
| GO:001050817 | Thyroid | ATC | positive regulation of autophagy | 73/6293 | 124/18723 | 6.74e-09 | 1.46e-07 | 73 |
| Page: 1 2 3 4 5 6 7 8 9 10 11 12 13 14 15 16 17 18 19 20 21 22 23 24 25 26 27 28 29 30 31 32 33 |
| Pathway ID | Tissue | Disease Stage | Description | Gene Ratio | Bg Ratio | pvalue | p.adjust | qvalue | Count |
| hsa012325 | Esophagus | ESCC | Nucleotide metabolism | 59/4205 | 85/8465 | 1.67e-04 | 6.58e-04 | 3.37e-04 | 59 |
| hsa002405 | Esophagus | ESCC | Pyrimidine metabolism | 41/4205 | 58/8465 | 9.14e-04 | 2.92e-03 | 1.49e-03 | 41 |
| hsa0123212 | Esophagus | ESCC | Nucleotide metabolism | 59/4205 | 85/8465 | 1.67e-04 | 6.58e-04 | 3.37e-04 | 59 |
| hsa0024012 | Esophagus | ESCC | Pyrimidine metabolism | 41/4205 | 58/8465 | 9.14e-04 | 2.92e-03 | 1.49e-03 | 41 |
| hsa002402 | Liver | HCC | Pyrimidine metabolism | 44/4020 | 58/8465 | 9.34e-06 | 7.11e-05 | 3.95e-05 | 44 |
| hsa012322 | Liver | HCC | Nucleotide metabolism | 59/4020 | 85/8465 | 3.30e-05 | 1.88e-04 | 1.04e-04 | 59 |
| hsa009832 | Liver | HCC | Drug metabolism - other enzymes | 54/4020 | 80/8465 | 2.25e-04 | 1.09e-03 | 6.08e-04 | 54 |
| hsa002403 | Liver | HCC | Pyrimidine metabolism | 44/4020 | 58/8465 | 9.34e-06 | 7.11e-05 | 3.95e-05 | 44 |
| hsa012323 | Liver | HCC | Nucleotide metabolism | 59/4020 | 85/8465 | 3.30e-05 | 1.88e-04 | 1.04e-04 | 59 |
| hsa009833 | Liver | HCC | Drug metabolism - other enzymes | 54/4020 | 80/8465 | 2.25e-04 | 1.09e-03 | 6.08e-04 | 54 |
| hsa012324 | Oral cavity | OSCC | Nucleotide metabolism | 54/3704 | 85/8465 | 1.78e-04 | 5.95e-04 | 3.03e-04 | 54 |
| hsa002404 | Oral cavity | OSCC | Pyrimidine metabolism | 37/3704 | 58/8465 | 1.62e-03 | 4.45e-03 | 2.26e-03 | 37 |
| hsa0123211 | Oral cavity | OSCC | Nucleotide metabolism | 54/3704 | 85/8465 | 1.78e-04 | 5.95e-04 | 3.03e-04 | 54 |
| hsa0024011 | Oral cavity | OSCC | Pyrimidine metabolism | 37/3704 | 58/8465 | 1.62e-03 | 4.45e-03 | 2.26e-03 | 37 |
| hsa0123221 | Oral cavity | LP | Nucleotide metabolism | 42/2418 | 85/8465 | 3.62e-05 | 2.36e-04 | 1.52e-04 | 42 |
| hsa0024021 | Oral cavity | LP | Pyrimidine metabolism | 28/2418 | 58/8465 | 1.12e-03 | 5.02e-03 | 3.24e-03 | 28 |
| hsa0123231 | Oral cavity | LP | Nucleotide metabolism | 42/2418 | 85/8465 | 3.62e-05 | 2.36e-04 | 1.52e-04 | 42 |
| hsa0024031 | Oral cavity | LP | Pyrimidine metabolism | 28/2418 | 58/8465 | 1.12e-03 | 5.02e-03 | 3.24e-03 | 28 |
| Page: 1 |
Top |
Cell-cell communication analysis |
| Identification of potential cell-cell interactions between two cell types and their ligand-receptor pairs for different disease states |
| Ligand | Receptor | LRpair | Pathway | Tissue | Disease Stage |
| Page: 1 |
Top |
Single-cell gene regulatory network inference analysis |
| Find out the significant the regulons (TFs) and the target genes of each regulon across cell types for different disease states |
| TF | Cell Type | Tissue | Disease Stage | Target Gene | RSS | Regulon Activity |
| ∗The dot plots of a searched regulon are shown for all cell subpopulations in each disease state of each tissue based on the regulon specific score inferred using pySCENIC and by calculating the average expression. |
| Page: 1 |
Top |
Somatic mutation of malignant transformation related genes |
| Annotation of somatic variants for genes involved in malignant transformation |
| Hugo Symbol | Variant Class | Variant Classification | dbSNP RS | HGVSc | HGVSp | HGVSp Short | SWISSPROT | BIOTYPE | SIFT | PolyPhen | Tumor Sample Barcode | Tissue | Histology | Sex | Age | Stage | Therapy Types | Drugs | Outcome |
| TK1 | SNV | Missense_Mutation | rs373525383 | c.197G>A | p.Cys66Tyr | p.C66Y | P04183 | protein_coding | tolerated(0.66) | benign(0) | TCGA-BH-A0BP-01 | Breast | breast invasive carcinoma | Female | >=65 | I/II | Unknown | Unknown | SD |
| TK1 | insertion | Nonsense_Mutation | novel | c.124_125insATTTGAACATTGAATGATTCAAATCAGCACACTTTCCAAGG | p.Arg42HisfsTer6 | p.R42Hfs*6 | P04183 | protein_coding | TCGA-AN-A0FX-01 | Breast | breast invasive carcinoma | Female | <65 | I/II | Unknown | Unknown | SD | ||
| TK1 | insertion | Nonsense_Mutation | novel | c.177_178insTGGTTTGGCCTGCACGTTGATTTTTGTTTAATTTTTTAGTTGTC | p.Arg60TrpfsTer13 | p.R60Wfs*13 | P04183 | protein_coding | TCGA-AO-A0J9-01 | Breast | breast invasive carcinoma | Female | <65 | III/IV | Chemotherapy | cyclophosphamide | PD | ||
| TK1 | SNV | Missense_Mutation | c.697N>A | p.Ala233Thr | p.A233T | P04183 | protein_coding | tolerated_low_confidence(0.05) | benign(0.001) | TCGA-AA-A022-01 | Colorectum | colon adenocarcinoma | Female | >=65 | I/II | Unknown | Unknown | SD | |
| TK1 | SNV | Missense_Mutation | novel | c.536N>G | p.Asp179Gly | p.D179G | P04183 | protein_coding | deleterious(0.01) | benign(0.228) | TCGA-AD-6964-01 | Colorectum | colon adenocarcinoma | Male | <65 | III/IV | Chemotherapy | folfox | PD |
| TK1 | SNV | Missense_Mutation | rs375708499 | c.245G>A | p.Arg82Gln | p.R82Q | P04183 | protein_coding | tolerated(0.52) | benign(0.003) | TCGA-CM-5349-01 | Colorectum | colon adenocarcinoma | Female | >=65 | I/II | Unknown | Unknown | SD |
| TK1 | SNV | Missense_Mutation | c.527N>T | p.Gly176Val | p.G176V | P04183 | protein_coding | deleterious(0) | probably_damaging(1) | TCGA-DM-A28F-01 | Colorectum | colon adenocarcinoma | Male | >=65 | III/IV | Unknown | Unknown | SD | |
| TK1 | SNV | Missense_Mutation | rs746414831 | c.224N>T | p.Ala75Val | p.A75V | P04183 | protein_coding | deleterious(0) | probably_damaging(0.953) | TCGA-AX-A2HD-01 | Endometrium | uterine corpus endometrioid carcinoma | Female | >=65 | III/IV | Unknown | Unknown | SD |
| TK1 | SNV | Missense_Mutation | novel | c.236N>A | p.Cys79Tyr | p.C79Y | P04183 | protein_coding | deleterious(0.04) | benign(0.08) | TCGA-BG-A222-01 | Endometrium | uterine corpus endometrioid carcinoma | Female | <65 | I/II | Unknown | Unknown | SD |
| TK1 | SNV | Missense_Mutation | c.612G>T | p.Glu204Asp | p.E204D | P04183 | protein_coding | tolerated(0.08) | benign(0.132) | TCGA-BS-A0UV-01 | Endometrium | uterine corpus endometrioid carcinoma | Female | <65 | III/IV | Unknown | Unknown | SD |
| Page: 1 2 3 |
Top |
Related drugs of malignant transformation related genes |
| Identification of chemicals and drugs interact with genes involved in malignant transfromation |
| (DGIdb 4.0) |
| Entrez ID | Symbol | Category | Interaction Types | Drug Claim Name | Drug Name | PMIDs |
| 7083 | TK1 | ENZYME, KINASE, DRUGGABLE GENOME | zidovudine | ZIDOVUDINE | 22960662 | |
| 7083 | TK1 | ENZYME, KINASE, DRUGGABLE GENOME | Thymidine kinase-expressing adenovirus and ganciclovir suicide gene therapy | |||
| 7083 | TK1 | ENZYME, KINASE, DRUGGABLE GENOME | Ad-OC-hsvTK/valacyclovir | |||
| 7083 | TK1 | ENZYME, KINASE, DRUGGABLE GENOME | HQK-1004 | ARGININE BUTYRATE | ||
| 7083 | TK1 | ENZYME, KINASE, DRUGGABLE GENOME | Radiosensitizer gene therapy | |||
| 7083 | TK1 | ENZYME, KINASE, DRUGGABLE GENOME | TK-DLI | |||
| 7083 | TK1 | ENZYME, KINASE, DRUGGABLE GENOME | FV-100 | VALNIVUDINE HYDROCHLORIDE | ||
| 7083 | TK1 | ENZYME, KINASE, DRUGGABLE GENOME | Penciclovir | PENCICLOVIR | ||
| 7083 | TK1 | ENZYME, KINASE, DRUGGABLE GENOME | DEOXYCYTIDINE | DEOXYCYTIDINE | ||
| 7083 | TK1 | ENZYME, KINASE, DRUGGABLE GENOME | Rilapladib | RILAPLADIB |
| Page: 1 |

Copyright 2023-Present -The University of Texas Health Science Center at Houston |