
|
|||||
|
 | |
| |
| |
| |
| |
| |
|
Gene: SMARCC1 |
Gene summary for SMARCC1 |
| Gene information | Species | Human | Gene symbol | SMARCC1 | Gene ID | 6599 |
| Gene name | SWI/SNF related, matrix associated, actin dependent regulator of chromatin subfamily c member 1 | |
| Gene Alias | BAF155 | |
| Cytomap | 3p21.31 | |
| Gene Type | protein-coding | GO ID | GO:0000003 | UniProtAcc | Q58EY4 |
Top |
Malignant transformation analysis |
| Identification of the aberrant gene expression in precancerous and cancerous lesions by comparing the gene expression of stem-like cells in diseased tissues with normal stem cells |
| Entrez ID | Symbol | Replicates | Species | Organ | Tissue | Adj P-value | Log2FC | Malignancy |
| 6599 | SMARCC1 | CA_HPV_1 | Human | Cervix | CC | 2.19e-03 | -1.07e-01 | 0.0264 |
| 6599 | SMARCC1 | CCI_2 | Human | Cervix | CC | 2.39e-04 | 9.11e-01 | 0.5249 |
| 6599 | SMARCC1 | CCI_3 | Human | Cervix | CC | 2.16e-09 | 9.64e-01 | 0.516 |
| 6599 | SMARCC1 | HTA11_3410_2000001011 | Human | Colorectum | AD | 2.25e-10 | -2.54e-01 | 0.0155 |
| 6599 | SMARCC1 | HTA11_2487_2000001011 | Human | Colorectum | SER | 8.16e-04 | -3.76e-01 | -0.1808 |
| 6599 | SMARCC1 | HTA11_3361_2000001011 | Human | Colorectum | AD | 2.58e-04 | -5.50e-01 | -0.1207 |
| 6599 | SMARCC1 | HTA11_5212_2000001011 | Human | Colorectum | AD | 7.61e-05 | -5.56e-01 | -0.2061 |
| 6599 | SMARCC1 | HTA11_99999965062_69753 | Human | Colorectum | MSI-H | 5.81e-11 | 1.09e+00 | 0.3487 |
| 6599 | SMARCC1 | HTA11_99999965104_69814 | Human | Colorectum | MSS | 5.98e-05 | 6.33e-01 | 0.281 |
| 6599 | SMARCC1 | A015-C-203 | Human | Colorectum | FAP | 8.39e-36 | -1.04e-01 | -0.1294 |
| 6599 | SMARCC1 | A015-C-204 | Human | Colorectum | FAP | 6.37e-08 | -1.93e-01 | -0.0228 |
| 6599 | SMARCC1 | A014-C-040 | Human | Colorectum | FAP | 8.60e-05 | -5.77e-02 | -0.1184 |
| 6599 | SMARCC1 | A002-C-201 | Human | Colorectum | FAP | 3.84e-12 | -7.13e-02 | 0.0324 |
| 6599 | SMARCC1 | A002-C-203 | Human | Colorectum | FAP | 4.99e-06 | 2.66e-02 | 0.2786 |
| 6599 | SMARCC1 | A001-C-119 | Human | Colorectum | FAP | 3.06e-10 | 2.22e-01 | -0.1557 |
| 6599 | SMARCC1 | A001-C-108 | Human | Colorectum | FAP | 2.02e-23 | -3.44e-02 | -0.0272 |
| 6599 | SMARCC1 | A002-C-205 | Human | Colorectum | FAP | 2.05e-25 | 2.74e-02 | -0.1236 |
| 6599 | SMARCC1 | A001-C-104 | Human | Colorectum | FAP | 1.24e-04 | 4.30e-02 | 0.0184 |
| 6599 | SMARCC1 | A015-C-005 | Human | Colorectum | FAP | 1.71e-03 | -1.60e-01 | -0.0336 |
| 6599 | SMARCC1 | A015-C-006 | Human | Colorectum | FAP | 3.67e-19 | 2.29e-02 | -0.0994 |
| Page: 1 2 3 4 5 6 7 8 9 10 11 |
| Tissue | Expression Dynamics | Abbreviation |
| Cervix | 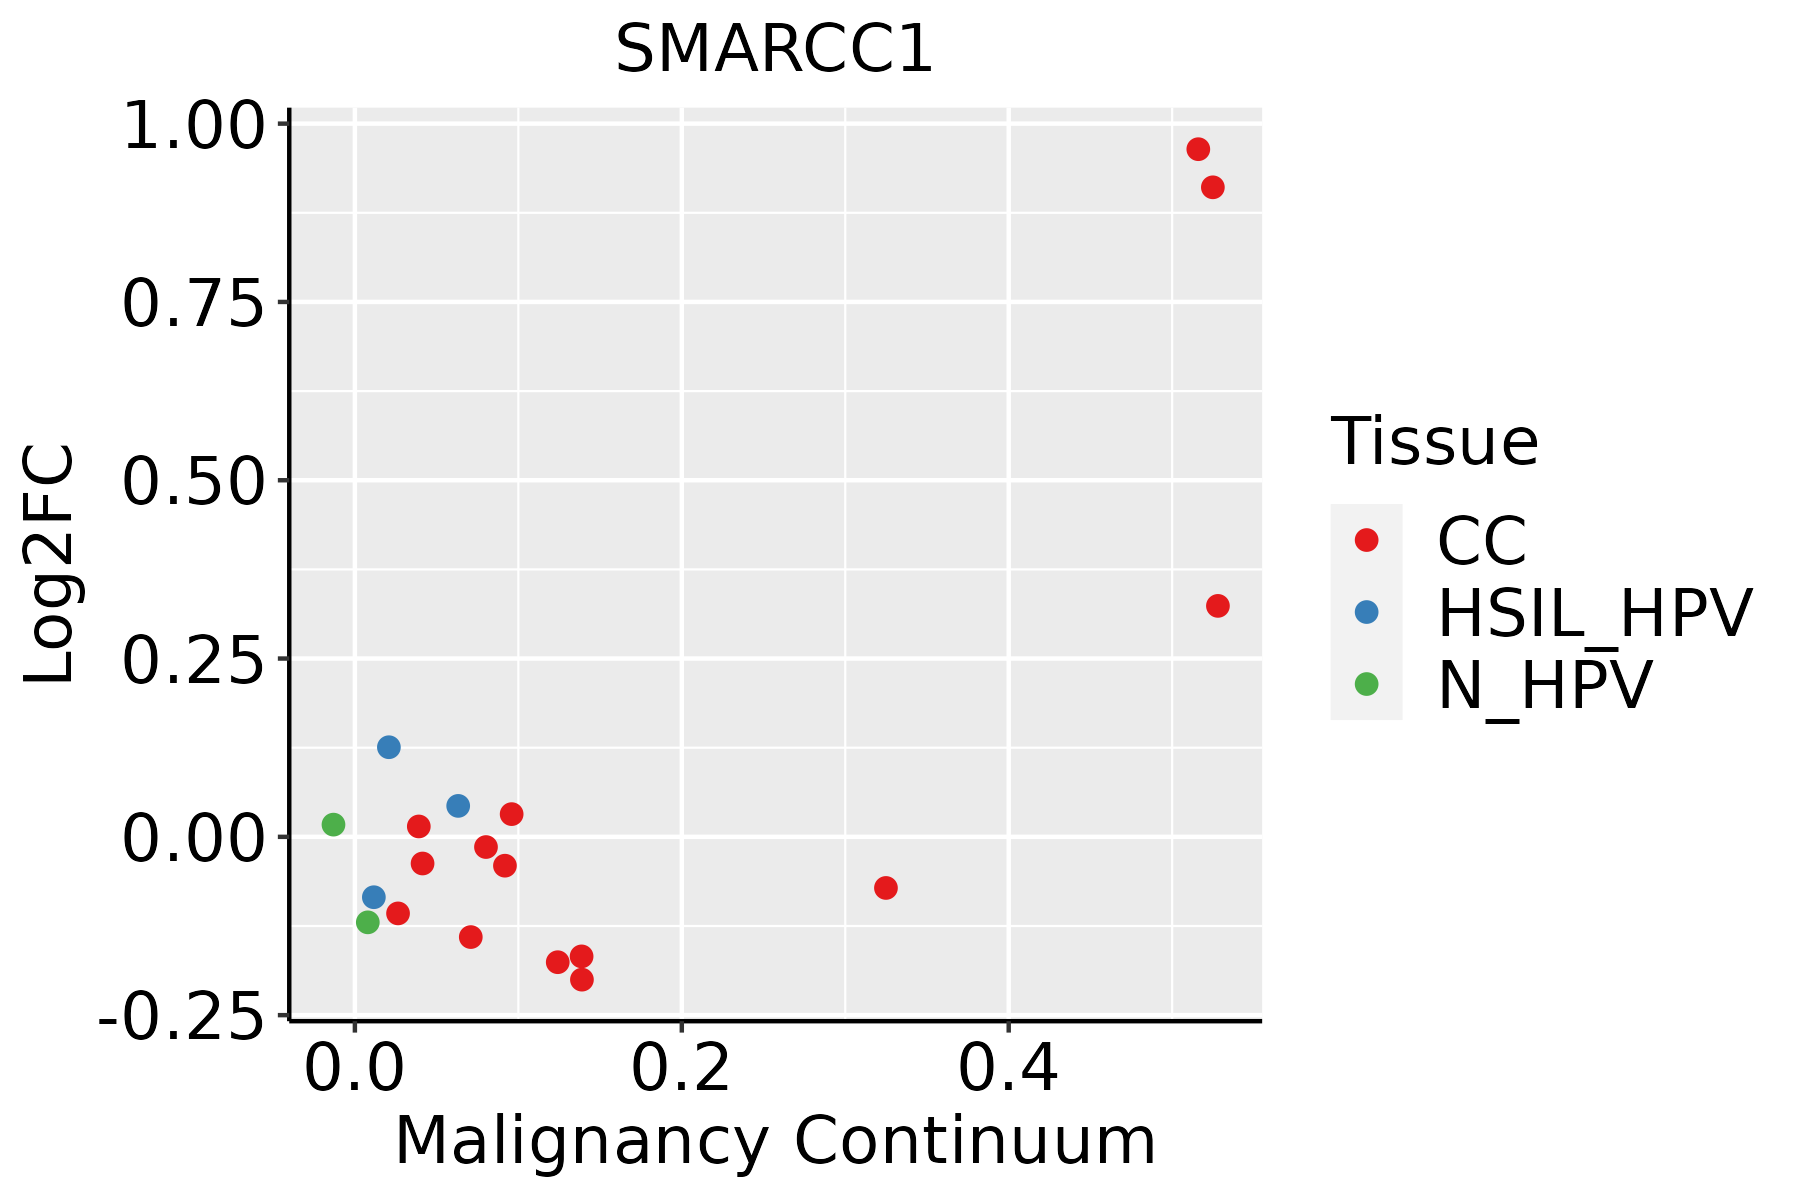 | CC: Cervix cancer |
| HSIL_HPV: HPV-infected high-grade squamous intraepithelial lesions | ||
| N_HPV: HPV-infected normal cervix | ||
| Colorectum (GSE201348) |  | FAP: Familial adenomatous polyposis |
| CRC: Colorectal cancer | ||
| Colorectum (HTA11) |  | AD: Adenomas |
| SER: Sessile serrated lesions | ||
| MSI-H: Microsatellite-high colorectal cancer | ||
| MSS: Microsatellite stable colorectal cancer | ||
| Endometrium |  | AEH: Atypical endometrial hyperplasia |
| EEC: Endometrioid Cancer | ||
| Esophagus | 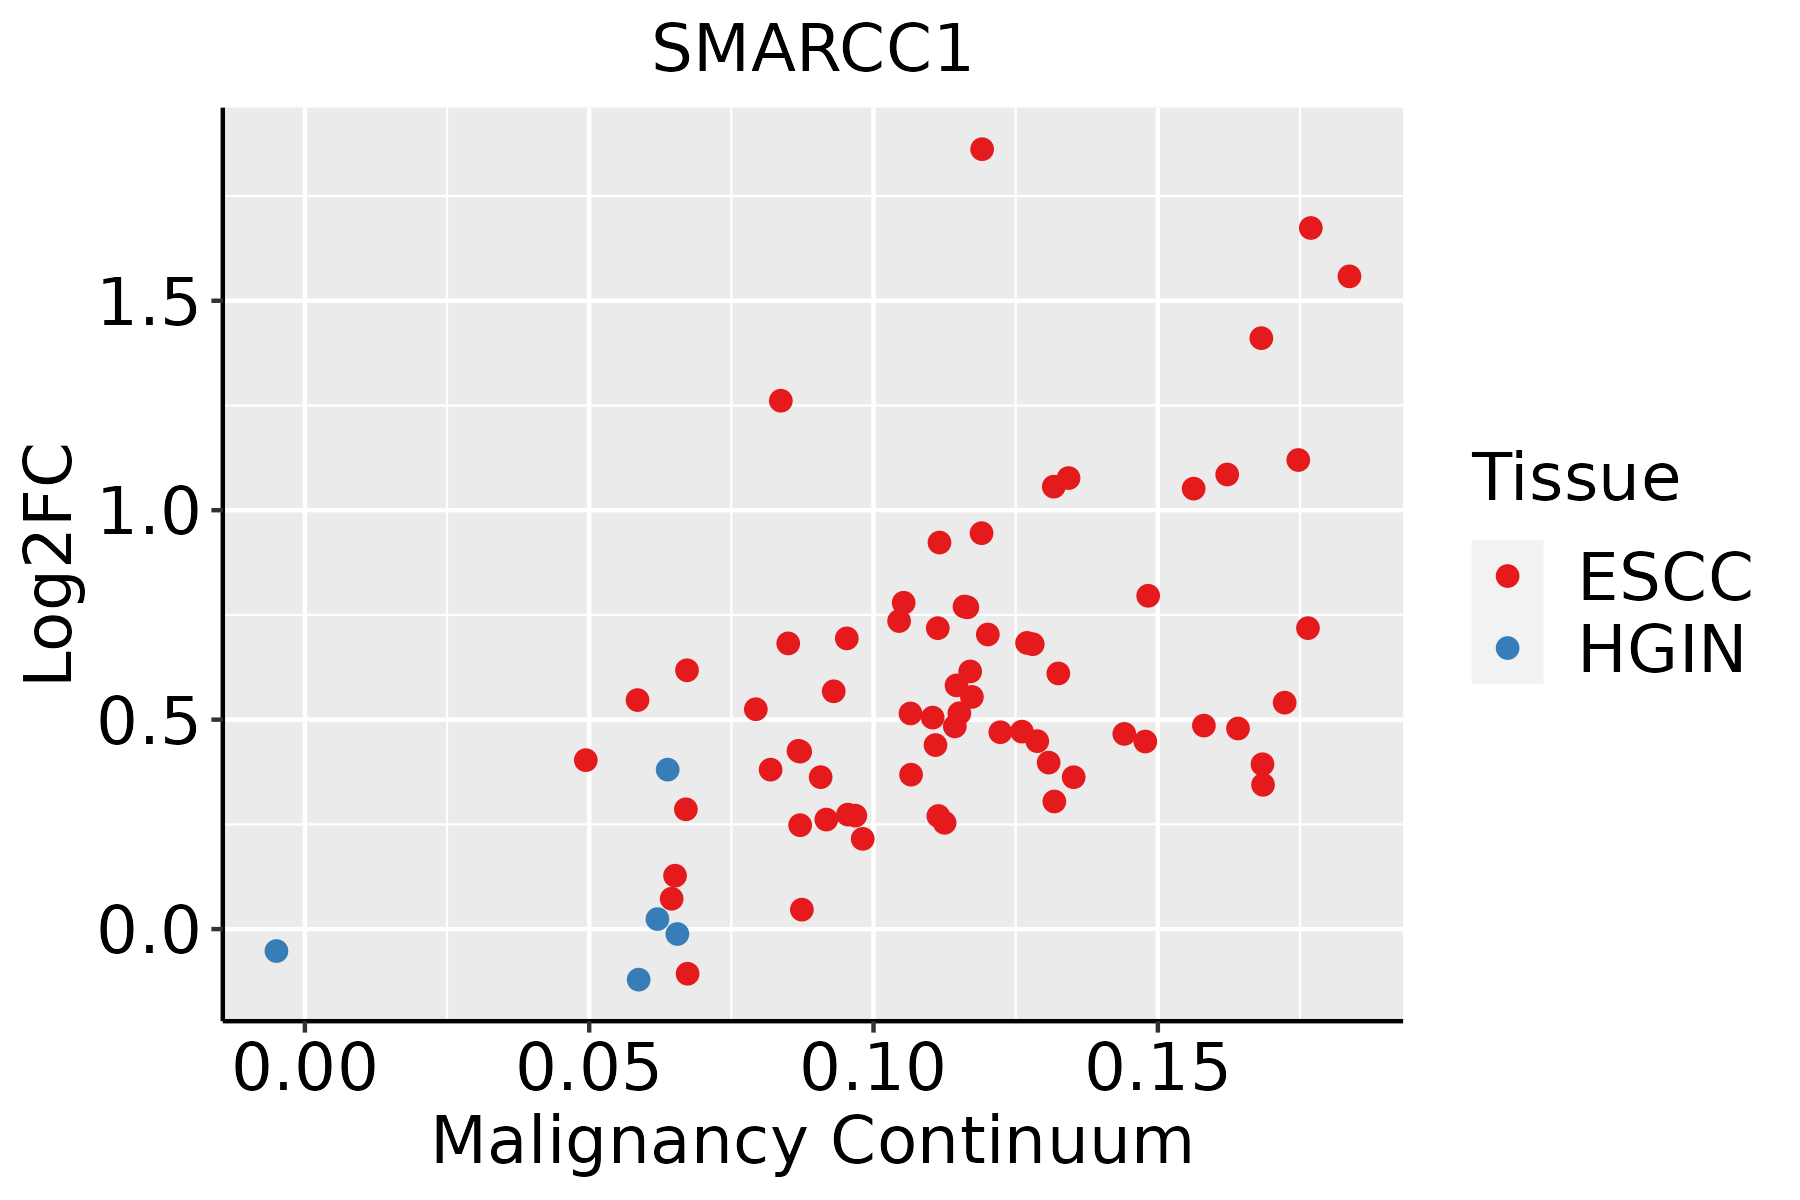 | ESCC: Esophageal squamous cell carcinoma |
| HGIN: High-grade intraepithelial neoplasias | ||
| LGIN: Low-grade intraepithelial neoplasias | ||
| Liver |  | HCC: Hepatocellular carcinoma |
| NAFLD: Non-alcoholic fatty liver disease | ||
| Lung |  | AAH: Atypical adenomatous hyperplasia |
| AIS: Adenocarcinoma in situ | ||
| IAC: Invasive lung adenocarcinoma | ||
| MIA: Minimally invasive adenocarcinoma | ||
| Oral Cavity | 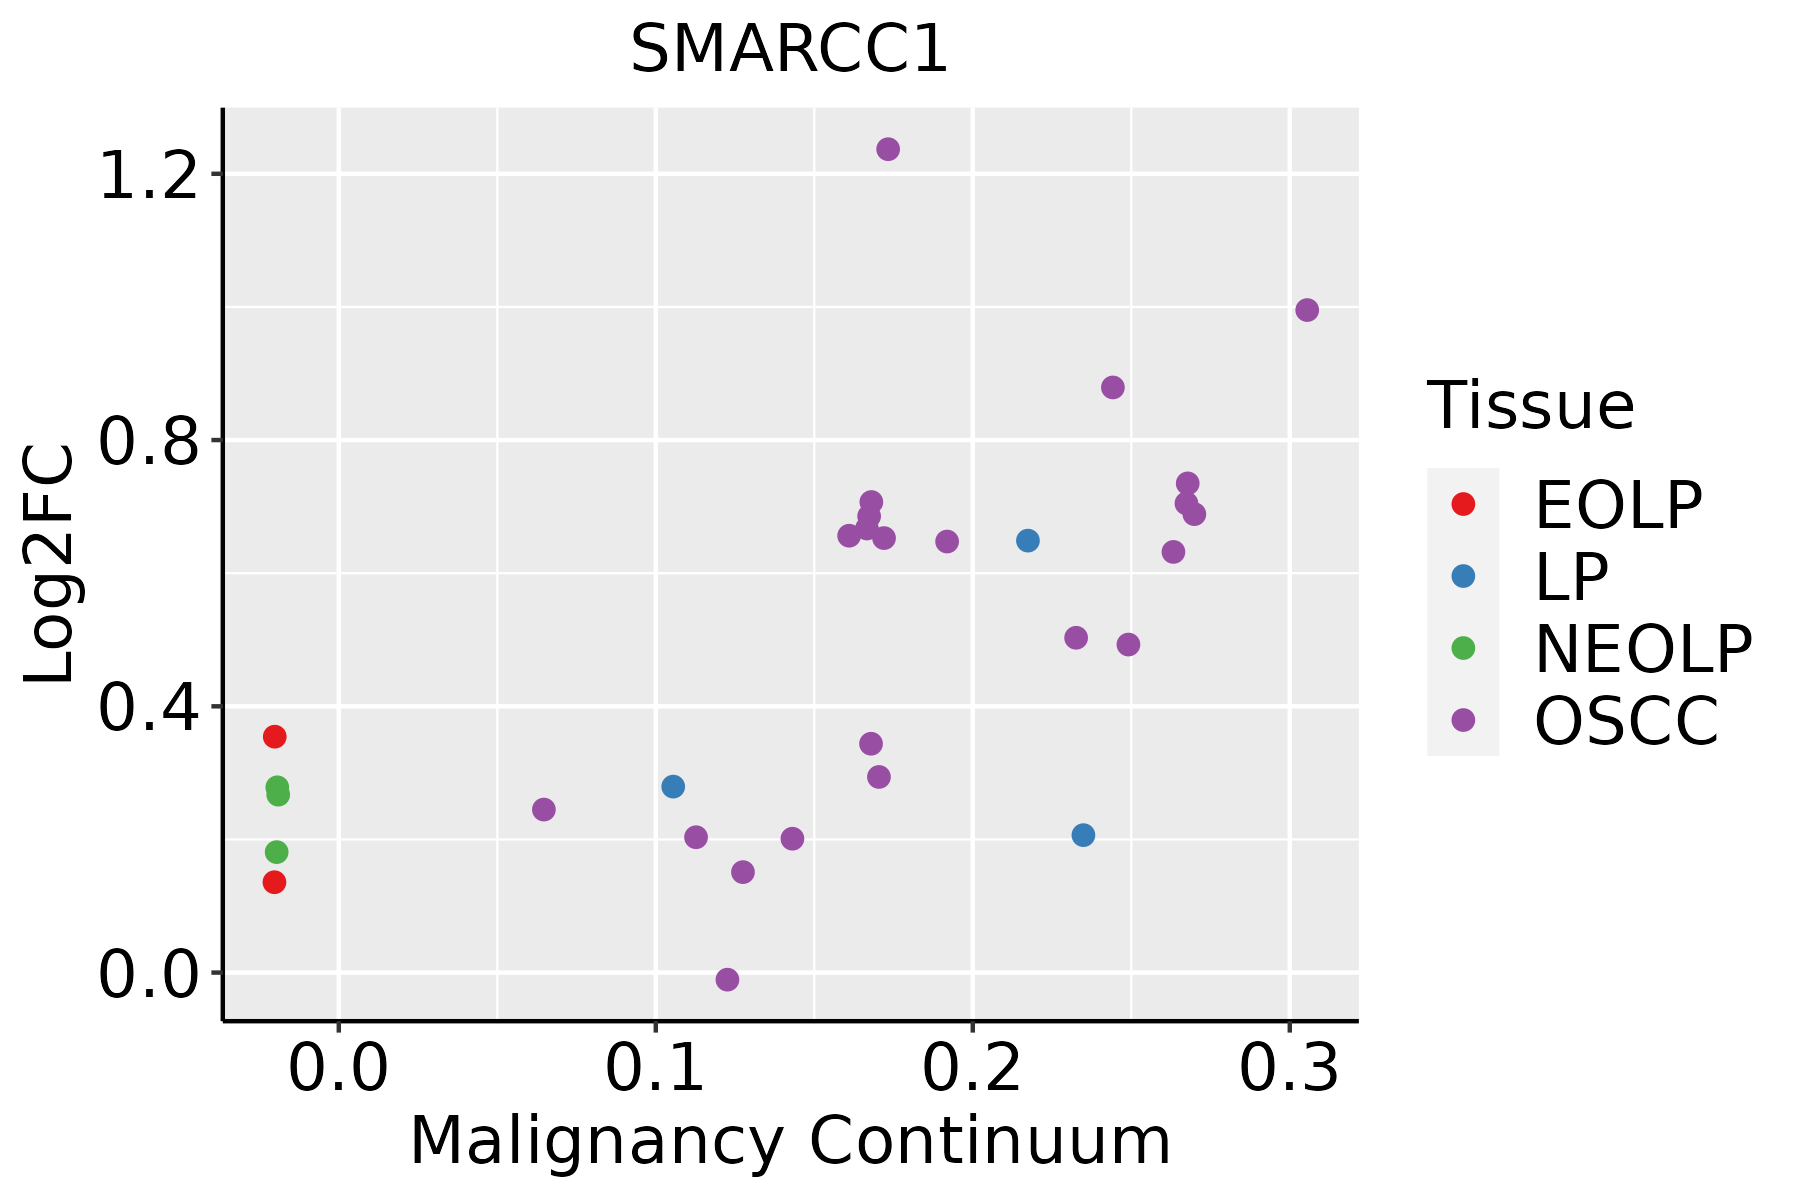 | EOLP: Erosive Oral lichen planus |
| LP: leukoplakia | ||
| NEOLP: Non-erosive oral lichen planus | ||
| OSCC: Oral squamous cell carcinoma | ||
| Prostate | 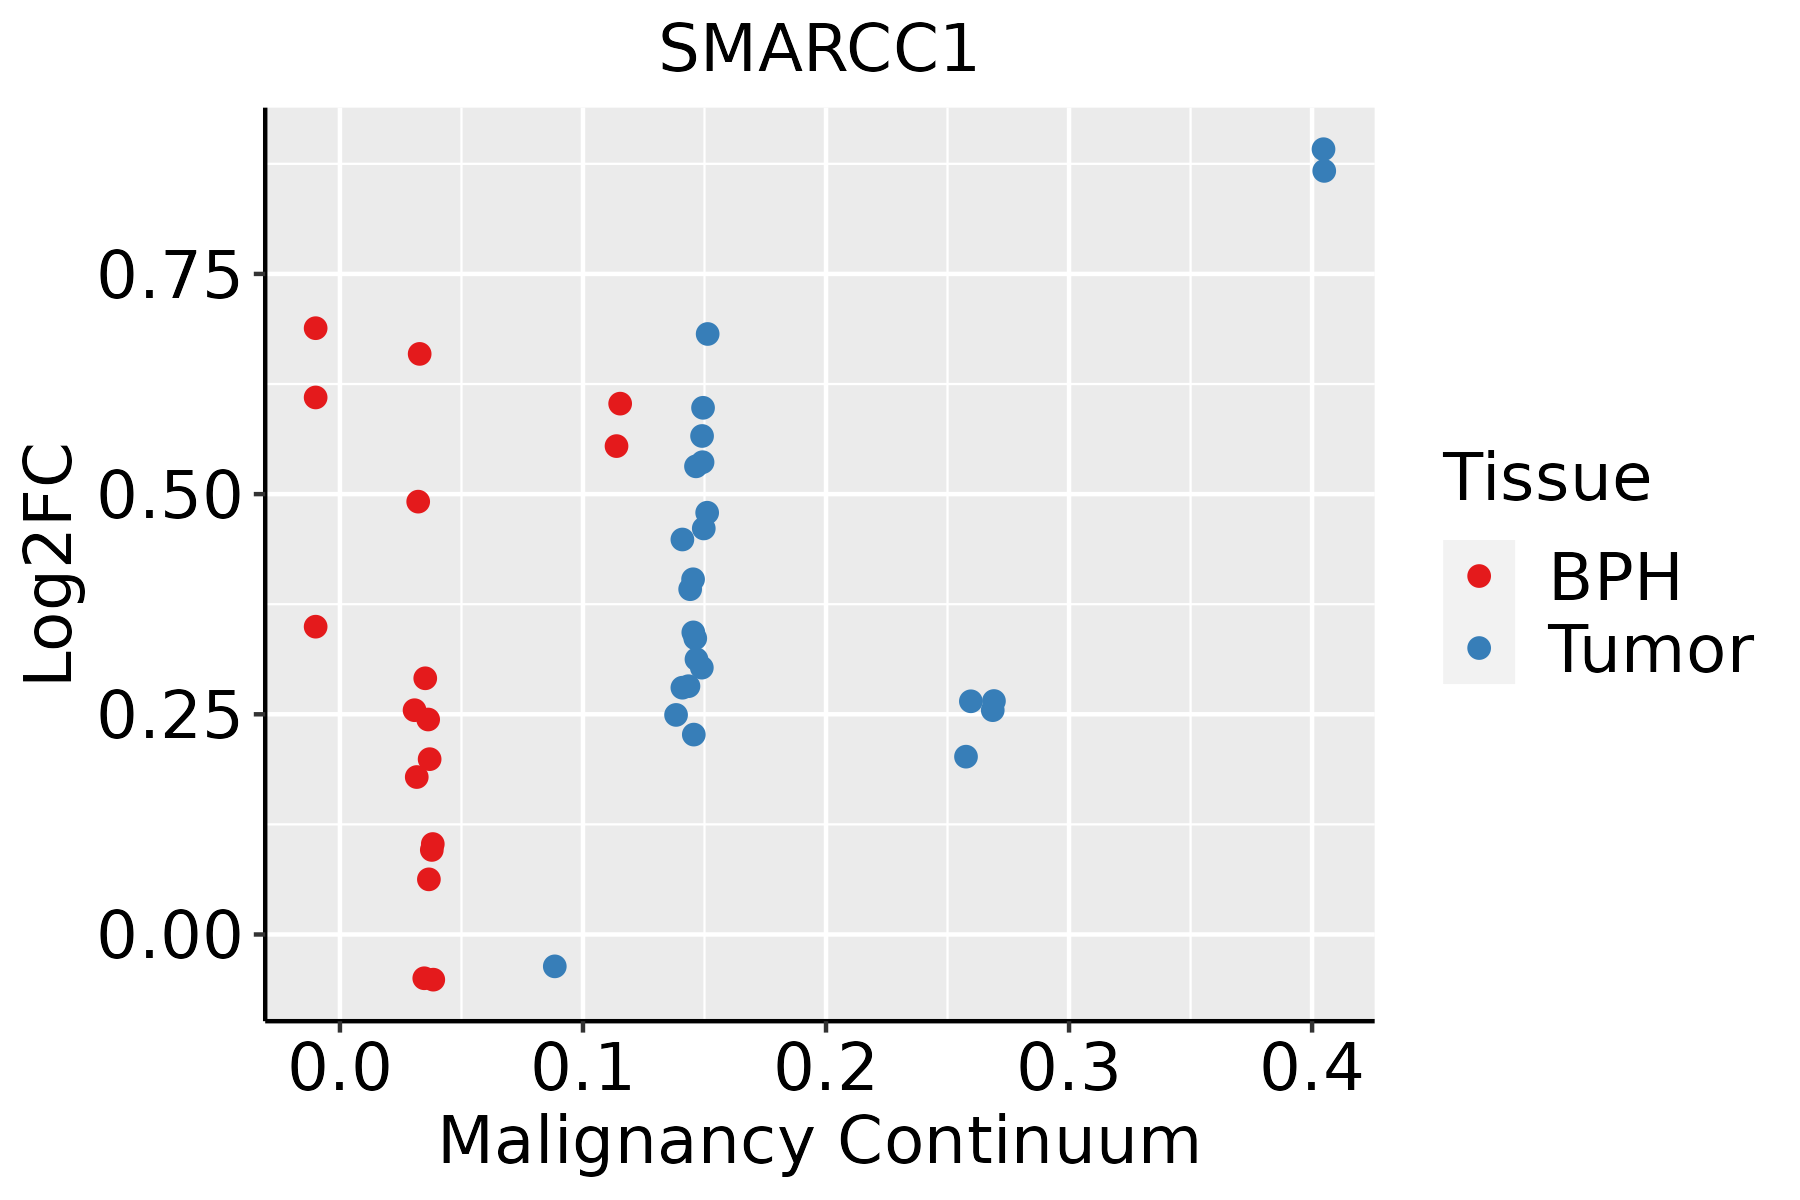 | BPH: Benign Prostatic Hyperplasia |
| Skin | 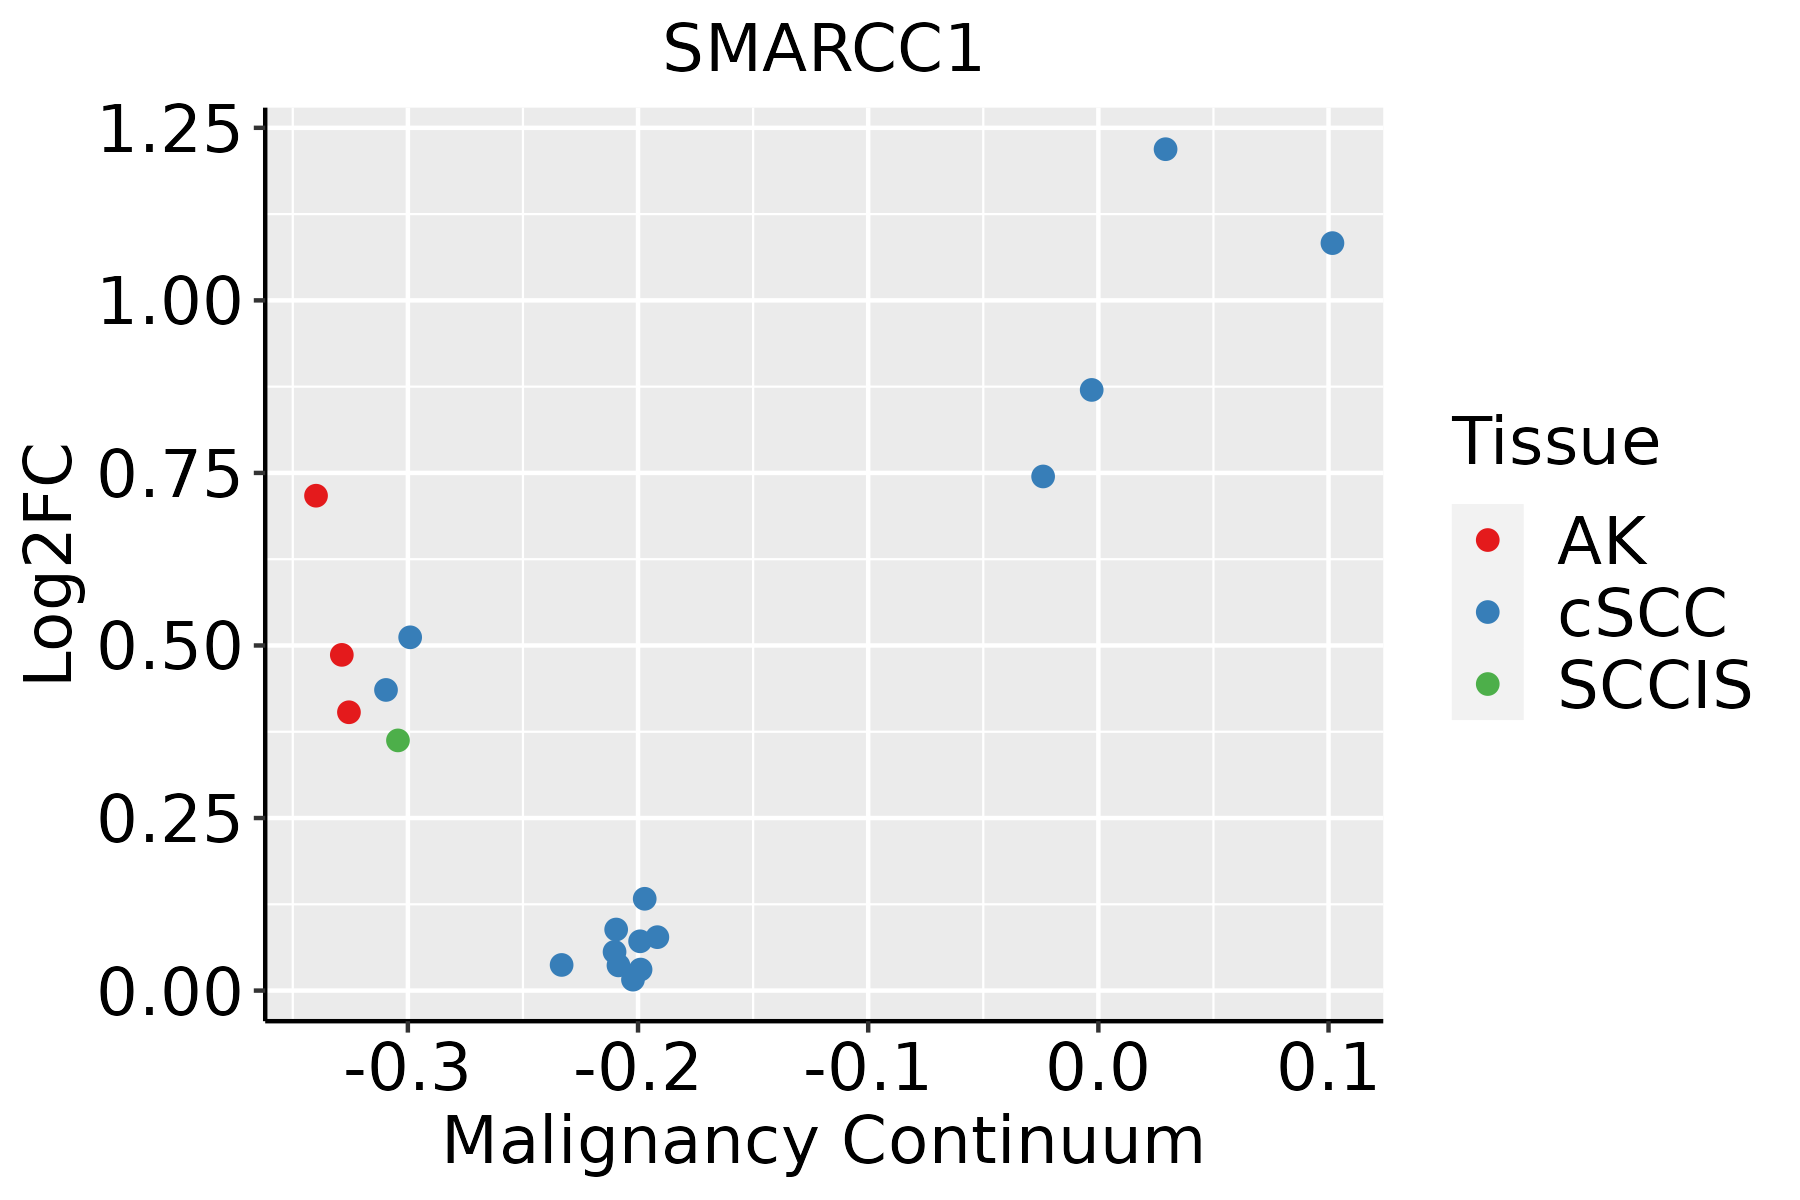 | AK: Actinic keratosis |
| cSCC: Cutaneous squamous cell carcinoma | ||
| SCCIS:squamous cell carcinoma in situ | ||
| Thyroid |  | ATC: Anaplastic thyroid cancer |
| HT: Hashimoto's thyroiditis | ||
| PTC: Papillary thyroid cancer |
| ∗log2FC in expression of this searched gene in stem-like cells from each diseased tissue sample relative to stem-like cells in normal samples in each tissue plotted against the malignancy continuum. Samples are colored based on if they are from different disease stage. |
Top |
Malignant transformation related pathway analysis |
| Find out the enriched GO biological processes and KEGG pathways involved in transition from healthy to precancer to cancer |
| Tissue | Disease Stage | Enriched GO biological Processes |
| Colorectum | AD |  |
| Colorectum | SER |  |
| Colorectum | MSS |  |
| Colorectum | MSI-H |  |
| Colorectum | FAP |  |
| ∗Top 15 enriched GO BP terms are showed in the bar plot of each disease state in each tissue. Each row represents a significant GO biological process which is colored according to the -log10(p.adjust). |
| Page: 1 2 3 4 5 6 7 8 9 |
| GO ID | Tissue | Disease Stage | Description | Gene Ratio | Bg Ratio | pvalue | p.adjust | Count |
| GO:200005933 | Oral cavity | NEOLP | negative regulation of ubiquitin-dependent protein catabolic process | 14/2005 | 48/18723 | 3.56e-04 | 3.41e-03 | 14 |
| GO:004217732 | Oral cavity | NEOLP | negative regulation of protein catabolic process | 25/2005 | 121/18723 | 9.29e-04 | 7.20e-03 | 25 |
| GO:003085021 | Oral cavity | NEOLP | prostate gland development | 12/2005 | 45/18723 | 2.17e-03 | 1.42e-02 | 12 |
| GO:000828622 | Oral cavity | NEOLP | insulin receptor signaling pathway | 23/2005 | 116/18723 | 2.56e-03 | 1.61e-02 | 23 |
| GO:190305132 | Oral cavity | NEOLP | negative regulation of proteolysis involved in cellular protein catabolic process | 15/2005 | 64/18723 | 2.63e-03 | 1.65e-02 | 15 |
| GO:190336332 | Oral cavity | NEOLP | negative regulation of cellular protein catabolic process | 16/2005 | 75/18723 | 5.24e-03 | 2.81e-02 | 16 |
| GO:003243522 | Oral cavity | NEOLP | negative regulation of proteasomal ubiquitin-dependent protein catabolic process | 9/2005 | 35/18723 | 9.72e-03 | 4.55e-02 | 9 |
| GO:004217618 | Prostate | BPH | regulation of protein catabolic process | 139/3107 | 391/18723 | 3.71e-20 | 3.28e-17 | 139 |
| GO:001049818 | Prostate | BPH | proteasomal protein catabolic process | 153/3107 | 490/18723 | 4.13e-16 | 7.51e-14 | 153 |
| GO:190336218 | Prostate | BPH | regulation of cellular protein catabolic process | 93/3107 | 255/18723 | 1.06e-14 | 1.40e-12 | 93 |
| GO:004316118 | Prostate | BPH | proteasome-mediated ubiquitin-dependent protein catabolic process | 127/3107 | 412/18723 | 3.84e-13 | 3.60e-11 | 127 |
| GO:200005818 | Prostate | BPH | regulation of ubiquitin-dependent protein catabolic process | 66/3107 | 164/18723 | 4.20e-13 | 3.88e-11 | 66 |
| GO:190305018 | Prostate | BPH | regulation of proteolysis involved in cellular protein catabolic process | 80/3107 | 221/18723 | 1.20e-12 | 1.02e-10 | 80 |
| GO:006145810 | Prostate | BPH | reproductive system development | 126/3107 | 427/18723 | 1.35e-11 | 9.95e-10 | 126 |
| GO:004860810 | Prostate | BPH | reproductive structure development | 124/3107 | 424/18723 | 3.76e-11 | 2.43e-09 | 124 |
| GO:003243418 | Prostate | BPH | regulation of proteasomal ubiquitin-dependent protein catabolic process | 54/3107 | 134/18723 | 5.22e-11 | 3.29e-09 | 54 |
| GO:006113618 | Prostate | BPH | regulation of proteasomal protein catabolic process | 67/3107 | 187/18723 | 1.34e-10 | 7.74e-09 | 67 |
| GO:004873218 | Prostate | BPH | gland development | 122/3107 | 436/18723 | 1.13e-09 | 5.01e-08 | 122 |
| GO:190165310 | Prostate | BPH | cellular response to peptide | 104/3107 | 359/18723 | 2.51e-09 | 1.00e-07 | 104 |
| GO:002241117 | Prostate | BPH | cellular component disassembly | 121/3107 | 443/18723 | 6.34e-09 | 2.25e-07 | 121 |
| Page: 1 2 3 4 5 6 7 8 9 10 11 12 13 14 15 16 17 18 19 20 21 22 23 24 25 26 27 28 29 30 31 32 33 34 35 36 37 38 39 40 |
| Pathway ID | Tissue | Disease Stage | Description | Gene Ratio | Bg Ratio | pvalue | p.adjust | qvalue | Count |
| hsa0471420 | Cervix | CC | Thermogenesis | 76/1267 | 232/8465 | 4.29e-12 | 1.16e-10 | 6.85e-11 | 76 |
| hsa0522510 | Cervix | CC | Hepatocellular carcinoma | 40/1267 | 168/8465 | 1.52e-03 | 6.39e-03 | 3.78e-03 | 40 |
| hsa04714110 | Cervix | CC | Thermogenesis | 76/1267 | 232/8465 | 4.29e-12 | 1.16e-10 | 6.85e-11 | 76 |
| hsa0522513 | Cervix | CC | Hepatocellular carcinoma | 40/1267 | 168/8465 | 1.52e-03 | 6.39e-03 | 3.78e-03 | 40 |
| hsa04714 | Colorectum | AD | Thermogenesis | 120/2092 | 232/8465 | 2.76e-19 | 1.16e-17 | 7.37e-18 | 120 |
| hsa05225 | Colorectum | AD | Hepatocellular carcinoma | 59/2092 | 168/8465 | 1.50e-03 | 8.69e-03 | 5.54e-03 | 59 |
| hsa047141 | Colorectum | AD | Thermogenesis | 120/2092 | 232/8465 | 2.76e-19 | 1.16e-17 | 7.37e-18 | 120 |
| hsa052251 | Colorectum | AD | Hepatocellular carcinoma | 59/2092 | 168/8465 | 1.50e-03 | 8.69e-03 | 5.54e-03 | 59 |
| hsa047142 | Colorectum | SER | Thermogenesis | 106/1580 | 232/8465 | 1.15e-21 | 6.34e-20 | 4.61e-20 | 106 |
| hsa047143 | Colorectum | SER | Thermogenesis | 106/1580 | 232/8465 | 1.15e-21 | 6.34e-20 | 4.61e-20 | 106 |
| hsa047144 | Colorectum | MSS | Thermogenesis | 113/1875 | 232/8465 | 1.52e-19 | 4.62e-18 | 2.83e-18 | 113 |
| hsa052252 | Colorectum | MSS | Hepatocellular carcinoma | 56/1875 | 168/8465 | 5.04e-04 | 3.45e-03 | 2.11e-03 | 56 |
| hsa047145 | Colorectum | MSS | Thermogenesis | 113/1875 | 232/8465 | 1.52e-19 | 4.62e-18 | 2.83e-18 | 113 |
| hsa052253 | Colorectum | MSS | Hepatocellular carcinoma | 56/1875 | 168/8465 | 5.04e-04 | 3.45e-03 | 2.11e-03 | 56 |
| hsa047146 | Colorectum | MSI-H | Thermogenesis | 56/797 | 232/8465 | 1.79e-11 | 4.14e-10 | 3.47e-10 | 56 |
| hsa047147 | Colorectum | MSI-H | Thermogenesis | 56/797 | 232/8465 | 1.79e-11 | 4.14e-10 | 3.47e-10 | 56 |
| hsa047148 | Colorectum | FAP | Thermogenesis | 70/1404 | 232/8465 | 1.38e-07 | 3.08e-06 | 1.87e-06 | 70 |
| hsa052254 | Colorectum | FAP | Hepatocellular carcinoma | 43/1404 | 168/8465 | 1.78e-03 | 8.99e-03 | 5.47e-03 | 43 |
| hsa047149 | Colorectum | FAP | Thermogenesis | 70/1404 | 232/8465 | 1.38e-07 | 3.08e-06 | 1.87e-06 | 70 |
| hsa052255 | Colorectum | FAP | Hepatocellular carcinoma | 43/1404 | 168/8465 | 1.78e-03 | 8.99e-03 | 5.47e-03 | 43 |
| Page: 1 2 3 |
Top |
Cell-cell communication analysis |
| Identification of potential cell-cell interactions between two cell types and their ligand-receptor pairs for different disease states |
| Ligand | Receptor | LRpair | Pathway | Tissue | Disease Stage |
| Page: 1 |
Top |
Single-cell gene regulatory network inference analysis |
| Find out the significant the regulons (TFs) and the target genes of each regulon across cell types for different disease states |
| TF | Cell Type | Tissue | Disease Stage | Target Gene | RSS | Regulon Activity |
| SMARCC1 | STM | Colorectum | FAP | PVT1,SMAD6,ATRX, etc. | 1.89e-01 |  |
| SMARCC1 | LYMEND | Oral cavity | ADJ | RFFL,WDR53,NEDD4L, etc. | 1.81e-01 |  |
| SMARCC1 | MSC | Oral cavity | EOLP | RFFL,WDR53,NEDD4L, etc. | 2.25e-01 |  |
| SMARCC1 | LYMEND | Oral cavity | Healthy | RFFL,WDR53,NEDD4L, etc. | 8.19e-02 |  |
| SMARCC1 | MSC | Oral cavity | Healthy | RFFL,WDR53,NEDD4L, etc. | 4.29e-02 | |
| SMARCC1 | LYMEND | Oral cavity | LP | RFFL,WDR53,NEDD4L, etc. | 2.29e-01 |  |
| SMARCC1 | MSC | Oral cavity | NEOLP | RFFL,WDR53,NEDD4L, etc. | 2.04e-01 |  |
| SMARCC1 | LYMEND | Oral cavity | OSCC | RFFL,WDR53,NEDD4L, etc. | 1.32e-01 |  |
| SMARCC1 | CD4TN | Stomach | CAG | ANKFY1,KDM3B,SIAH2, etc. | 7.60e-03 |  |
| SMARCC1 | TREG | Stomach | Healthy | ANKFY1,KDM3B,SIAH2, etc. | 0.00e+00 |  |
| ∗The dot plots of a searched regulon are shown for all cell subpopulations in each disease state of each tissue based on the regulon specific score inferred using pySCENIC and by calculating the average expression. |
| Page: 1 2 |
Top |
Somatic mutation of malignant transformation related genes |
| Annotation of somatic variants for genes involved in malignant transformation |
| Hugo Symbol | Variant Class | Variant Classification | dbSNP RS | HGVSc | HGVSp | HGVSp Short | SWISSPROT | BIOTYPE | SIFT | PolyPhen | Tumor Sample Barcode | Tissue | Histology | Sex | Age | Stage | Therapy Types | Drugs | Outcome |
| SMARCC1 | SNV | Missense_Mutation | novel | c.2650N>A | p.Leu884Met | p.L884M | Q92922 | protein_coding | deleterious(0) | probably_damaging(0.999) | TCGA-A2-A25A-01 | Breast | breast invasive carcinoma | Female | <65 | I/II | Unspecific | Cytoxan | SD |
| SMARCC1 | SNV | Missense_Mutation | rs746452222 | c.2171N>A | p.Arg724Gln | p.R724Q | Q92922 | protein_coding | tolerated(0.09) | benign(0.428) | TCGA-A7-A5ZX-01 | Breast | breast invasive carcinoma | Female | <65 | III/IV | Chemotherapy | doxorubicin | CR |
| SMARCC1 | SNV | Missense_Mutation | novel | c.2489N>T | p.Ser830Leu | p.S830L | Q92922 | protein_coding | tolerated(0.22) | benign(0.065) | TCGA-AC-A3W6-01 | Breast | breast invasive carcinoma | Female | >=65 | III/IV | Unknown | Unknown | SD |
| SMARCC1 | SNV | Missense_Mutation | c.2023N>A | p.Asp675Asn | p.D675N | Q92922 | protein_coding | tolerated(0.21) | benign(0.054) | TCGA-AO-A128-01 | Breast | breast invasive carcinoma | Female | <65 | I/II | Chemotherapy | doxorubicin | SD | |
| SMARCC1 | SNV | Missense_Mutation | novel | c.1446N>C | p.Lys482Asn | p.K482N | Q92922 | protein_coding | deleterious(0) | probably_damaging(1) | TCGA-BH-A0B6-01 | Breast | breast invasive carcinoma | Female | <65 | I/II | Unknown | Unknown | SD |
| SMARCC1 | SNV | Missense_Mutation | c.2332N>C | p.Glu778Gln | p.E778Q | Q92922 | protein_coding | tolerated(0.2) | benign(0.022) | TCGA-BH-A0HP-01 | Breast | breast invasive carcinoma | Female | >=65 | III/IV | Chemotherapy | doxorubicin | SD | |
| SMARCC1 | SNV | Missense_Mutation | rs779824613 | c.2602A>C | p.Thr868Pro | p.T868P | Q92922 | protein_coding | deleterious(0) | possibly_damaging(0.905) | TCGA-BH-A0HU-01 | Breast | breast invasive carcinoma | Female | <65 | I/II | Chemotherapy | docetaxel | SD |
| SMARCC1 | SNV | Missense_Mutation | c.1561G>T | p.Ala521Ser | p.A521S | Q92922 | protein_coding | tolerated(0.11) | possibly_damaging(0.895) | TCGA-C8-A1HM-01 | Breast | breast invasive carcinoma | Female | >=65 | I/II | Chemotherapy | doxorubicin | CR | |
| SMARCC1 | SNV | Missense_Mutation | c.2506N>A | p.Glu836Lys | p.E836K | Q92922 | protein_coding | tolerated(0.21) | benign(0.015) | TCGA-D8-A27G-01 | Breast | breast invasive carcinoma | Female | >=65 | I/II | Unknown | Unknown | SD | |
| SMARCC1 | SNV | Missense_Mutation | novel | c.3277N>G | p.Pro1093Ala | p.P1093A | Q92922 | protein_coding | tolerated_low_confidence(0.09) | benign(0.068) | TCGA-PE-A5DE-01 | Breast | breast invasive carcinoma | Female | <65 | I/II | Chemotherapy | taxotere | CR |
| Page: 1 2 3 4 5 6 7 8 9 10 |
Top |
Related drugs of malignant transformation related genes |
| Identification of chemicals and drugs interact with genes involved in malignant transfromation |
| (DGIdb 4.0) |
| Entrez ID | Symbol | Category | Interaction Types | Drug Claim Name | Drug Name | PMIDs |
| Page: 1 |

Copyright 2023-Present -The University of Texas Health Science Center at Houston |