
|
|||||
|
 | |
| |
| |
| |
| |
| |
|
Gene: NT5C |
Gene summary for NT5C |
| Gene information | Species | Human | Gene symbol | NT5C | Gene ID | 30833 |
| Gene name | 5', 3'-nucleotidase, cytosolic | |
| Gene Alias | DNT | |
| Cytomap | 17q25.1 | |
| Gene Type | protein-coding | GO ID | GO:0000255 | UniProtAcc | Q8TCD5 |
Top |
Malignant transformation analysis |
| Identification of the aberrant gene expression in precancerous and cancerous lesions by comparing the gene expression of stem-like cells in diseased tissues with normal stem cells |
| Entrez ID | Symbol | Replicates | Species | Organ | Tissue | Adj P-value | Log2FC | Malignancy |
| 30833 | NT5C | LZE2D | Human | Esophagus | HGIN | 3.51e-04 | 4.29e-01 | 0.0642 |
| 30833 | NT5C | LZE2T | Human | Esophagus | ESCC | 1.15e-06 | 9.43e-01 | 0.082 |
| 30833 | NT5C | LZE4T | Human | Esophagus | ESCC | 1.78e-31 | 9.27e-01 | 0.0811 |
| 30833 | NT5C | LZE7T | Human | Esophagus | ESCC | 1.71e-05 | 5.30e-01 | 0.0667 |
| 30833 | NT5C | LZE8T | Human | Esophagus | ESCC | 2.34e-02 | -2.32e-02 | 0.067 |
| 30833 | NT5C | LZE20T | Human | Esophagus | ESCC | 1.12e-10 | 4.21e-01 | 0.0662 |
| 30833 | NT5C | LZE21D1 | Human | Esophagus | HGIN | 5.88e-07 | 8.64e-01 | 0.0632 |
| 30833 | NT5C | LZE22D1 | Human | Esophagus | HGIN | 2.96e-11 | 6.48e-01 | 0.0595 |
| 30833 | NT5C | LZE22T | Human | Esophagus | ESCC | 5.80e-10 | 9.59e-01 | 0.068 |
| 30833 | NT5C | LZE24T | Human | Esophagus | ESCC | 5.71e-41 | 1.26e+00 | 0.0596 |
| 30833 | NT5C | LZE22D3 | Human | Esophagus | HGIN | 2.10e-07 | 4.96e-01 | 0.0653 |
| 30833 | NT5C | LZE21T | Human | Esophagus | ESCC | 1.36e-13 | 1.11e+00 | 0.0655 |
| 30833 | NT5C | P1T-E | Human | Esophagus | ESCC | 1.36e-15 | 8.33e-01 | 0.0875 |
| 30833 | NT5C | P2T-E | Human | Esophagus | ESCC | 2.35e-55 | 9.43e-01 | 0.1177 |
| 30833 | NT5C | P4T-E | Human | Esophagus | ESCC | 1.01e-50 | 1.14e+00 | 0.1323 |
| 30833 | NT5C | P5T-E | Human | Esophagus | ESCC | 6.49e-34 | 6.79e-01 | 0.1327 |
| 30833 | NT5C | P8T-E | Human | Esophagus | ESCC | 2.36e-63 | 1.05e+00 | 0.0889 |
| 30833 | NT5C | P9T-E | Human | Esophagus | ESCC | 2.34e-55 | 1.26e+00 | 0.1131 |
| 30833 | NT5C | P10T-E | Human | Esophagus | ESCC | 1.34e-97 | 1.56e+00 | 0.116 |
| 30833 | NT5C | P11T-E | Human | Esophagus | ESCC | 7.35e-33 | 1.78e+00 | 0.1426 |
| Page: 1 2 3 4 5 6 7 |
| Tissue | Expression Dynamics | Abbreviation |
| Esophagus |  | ESCC: Esophageal squamous cell carcinoma |
| HGIN: High-grade intraepithelial neoplasias | ||
| LGIN: Low-grade intraepithelial neoplasias | ||
| Liver | 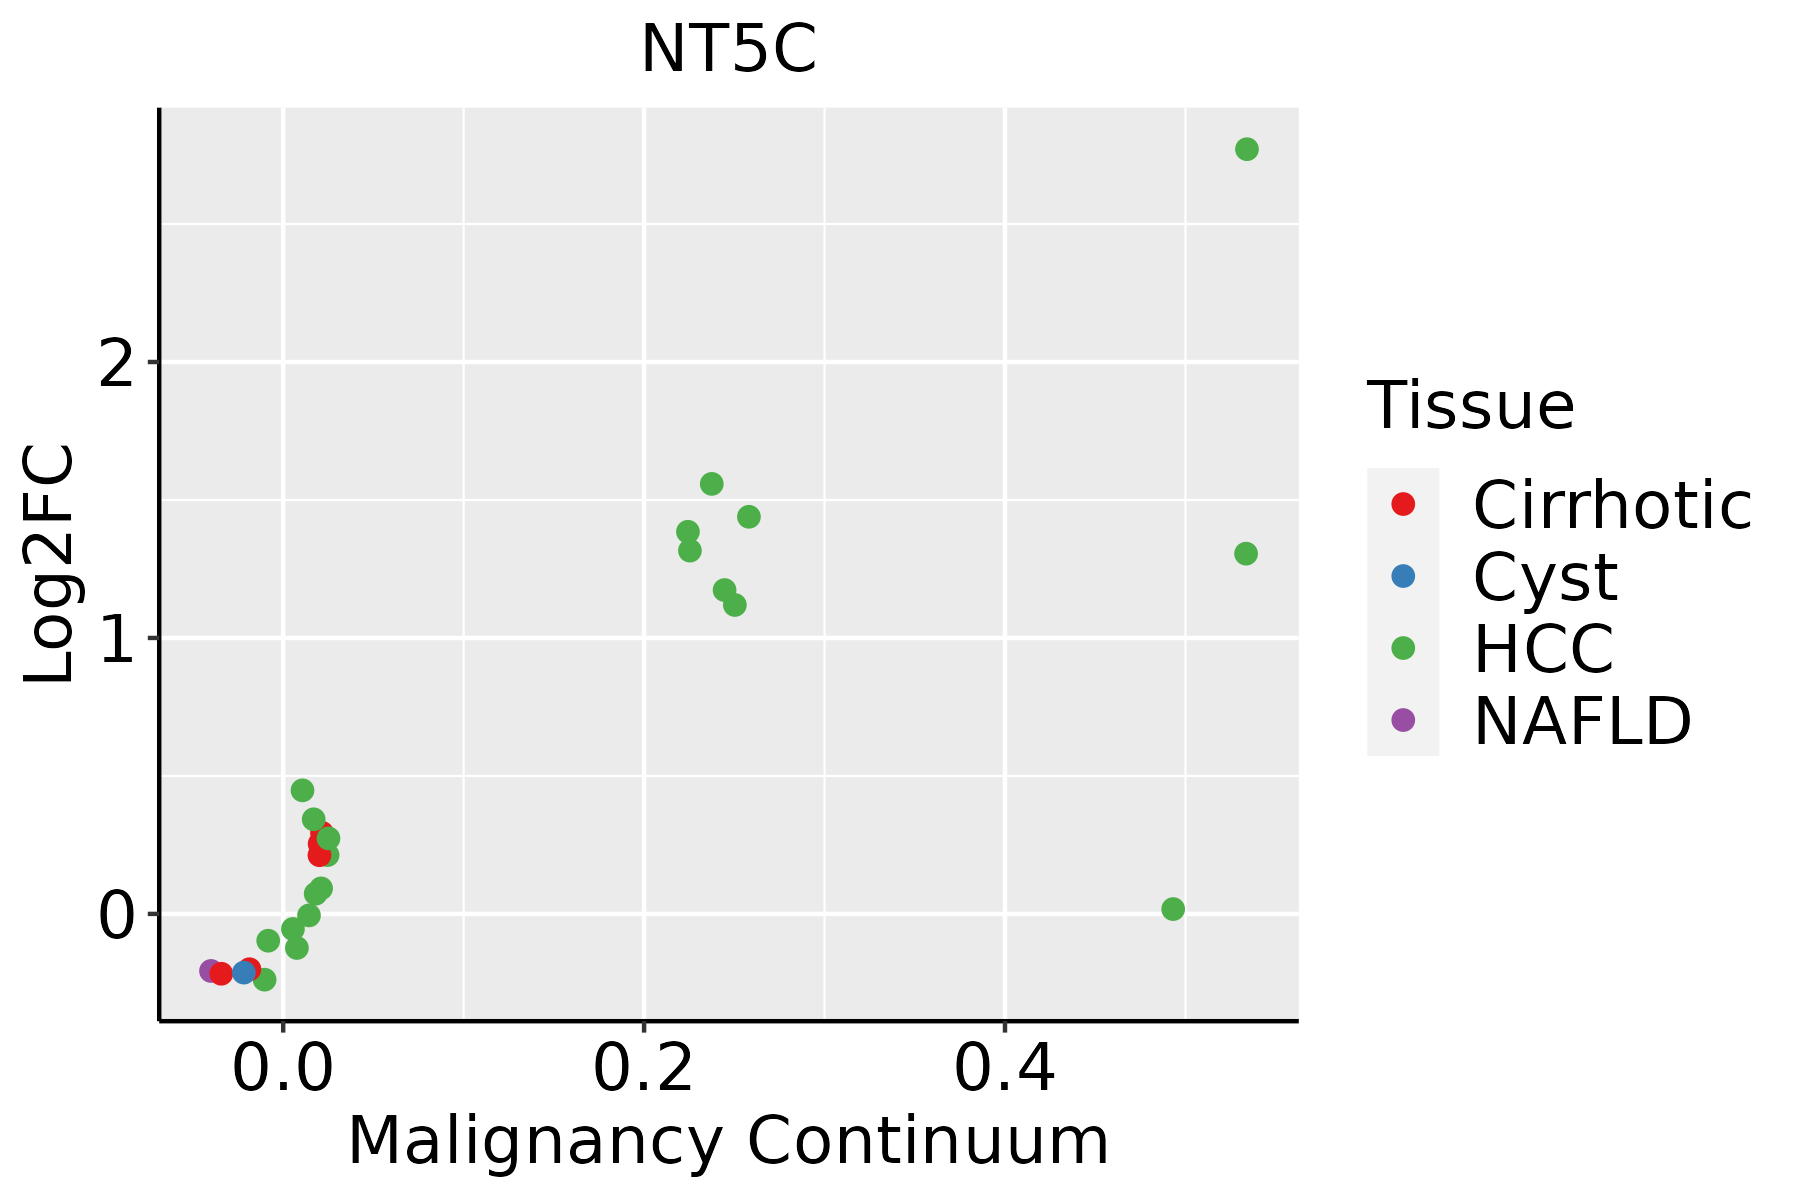 | HCC: Hepatocellular carcinoma |
| NAFLD: Non-alcoholic fatty liver disease | ||
| Oral Cavity |  | EOLP: Erosive Oral lichen planus |
| LP: leukoplakia | ||
| NEOLP: Non-erosive oral lichen planus | ||
| OSCC: Oral squamous cell carcinoma | ||
| Skin | 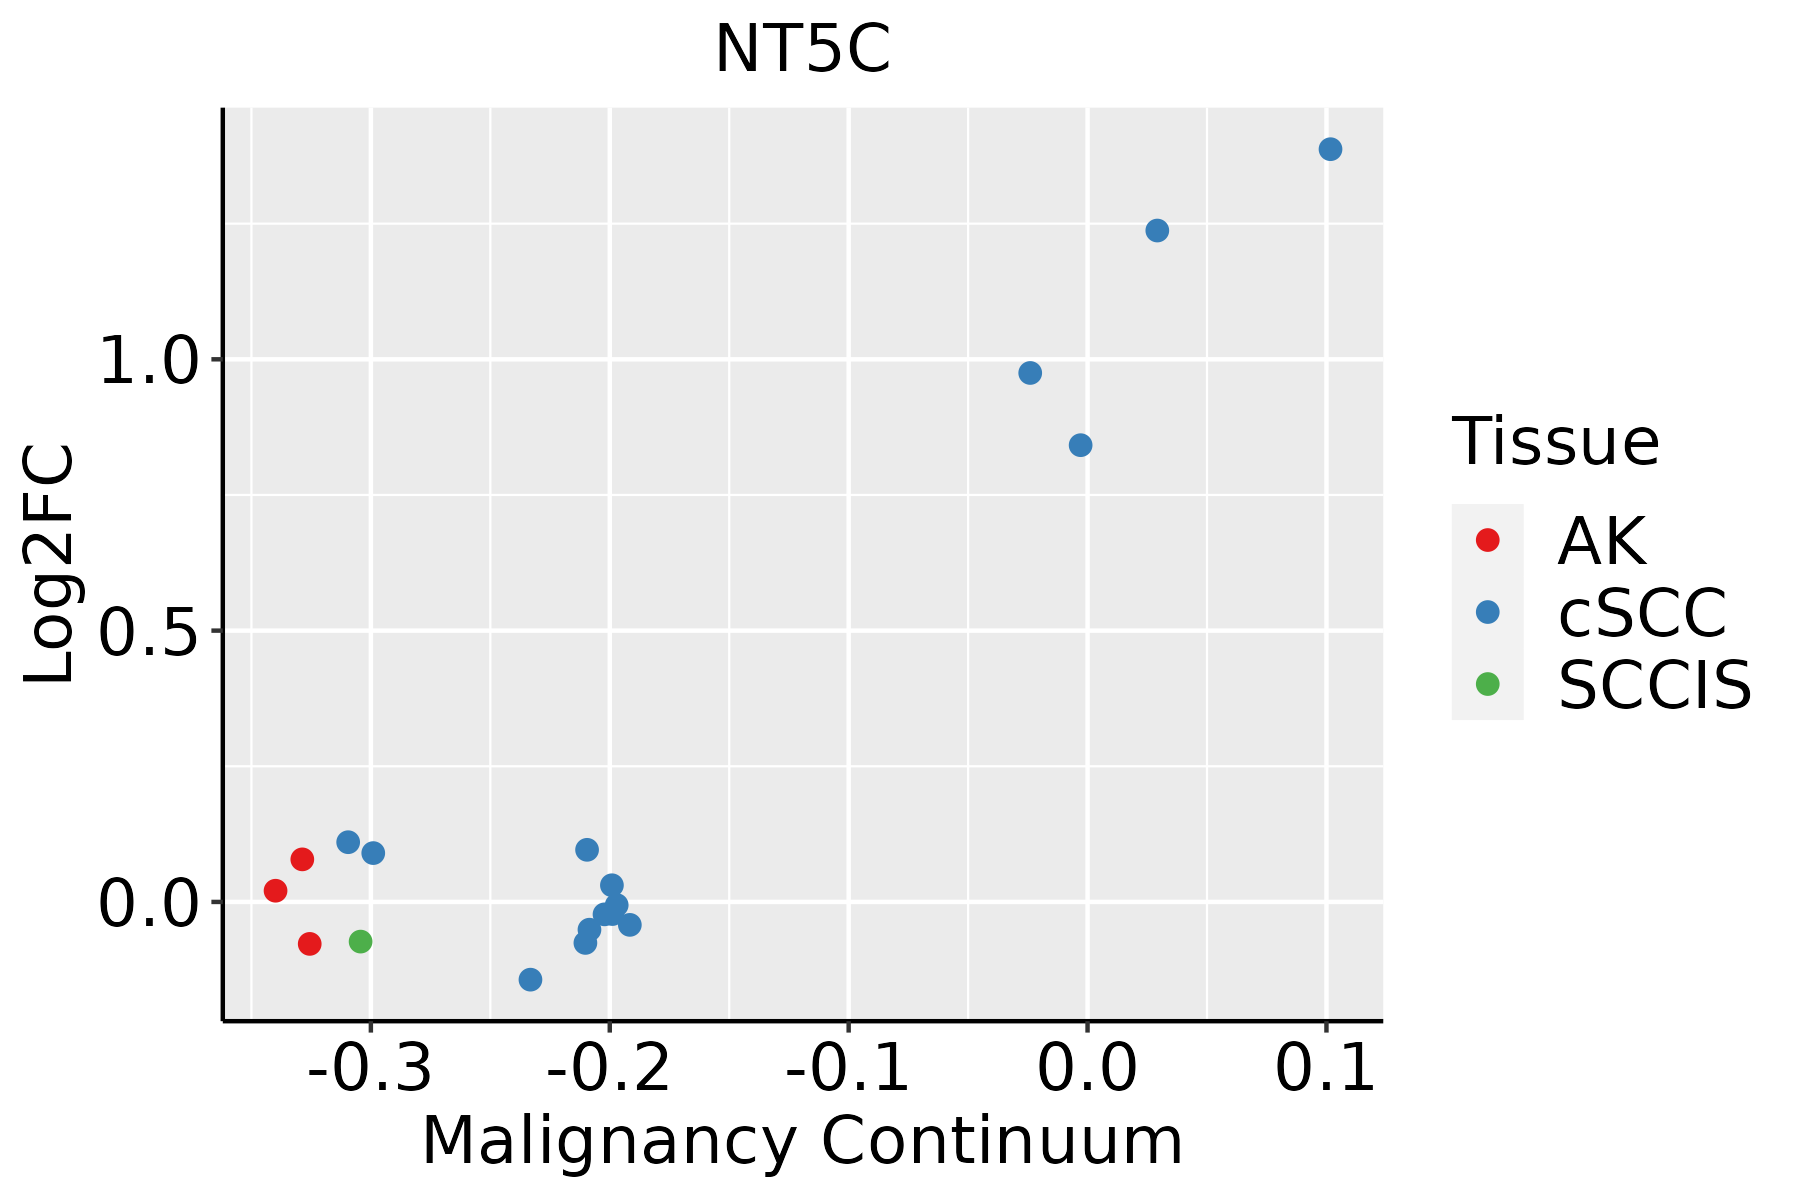 | AK: Actinic keratosis |
| cSCC: Cutaneous squamous cell carcinoma | ||
| SCCIS:squamous cell carcinoma in situ | ||
| Thyroid | 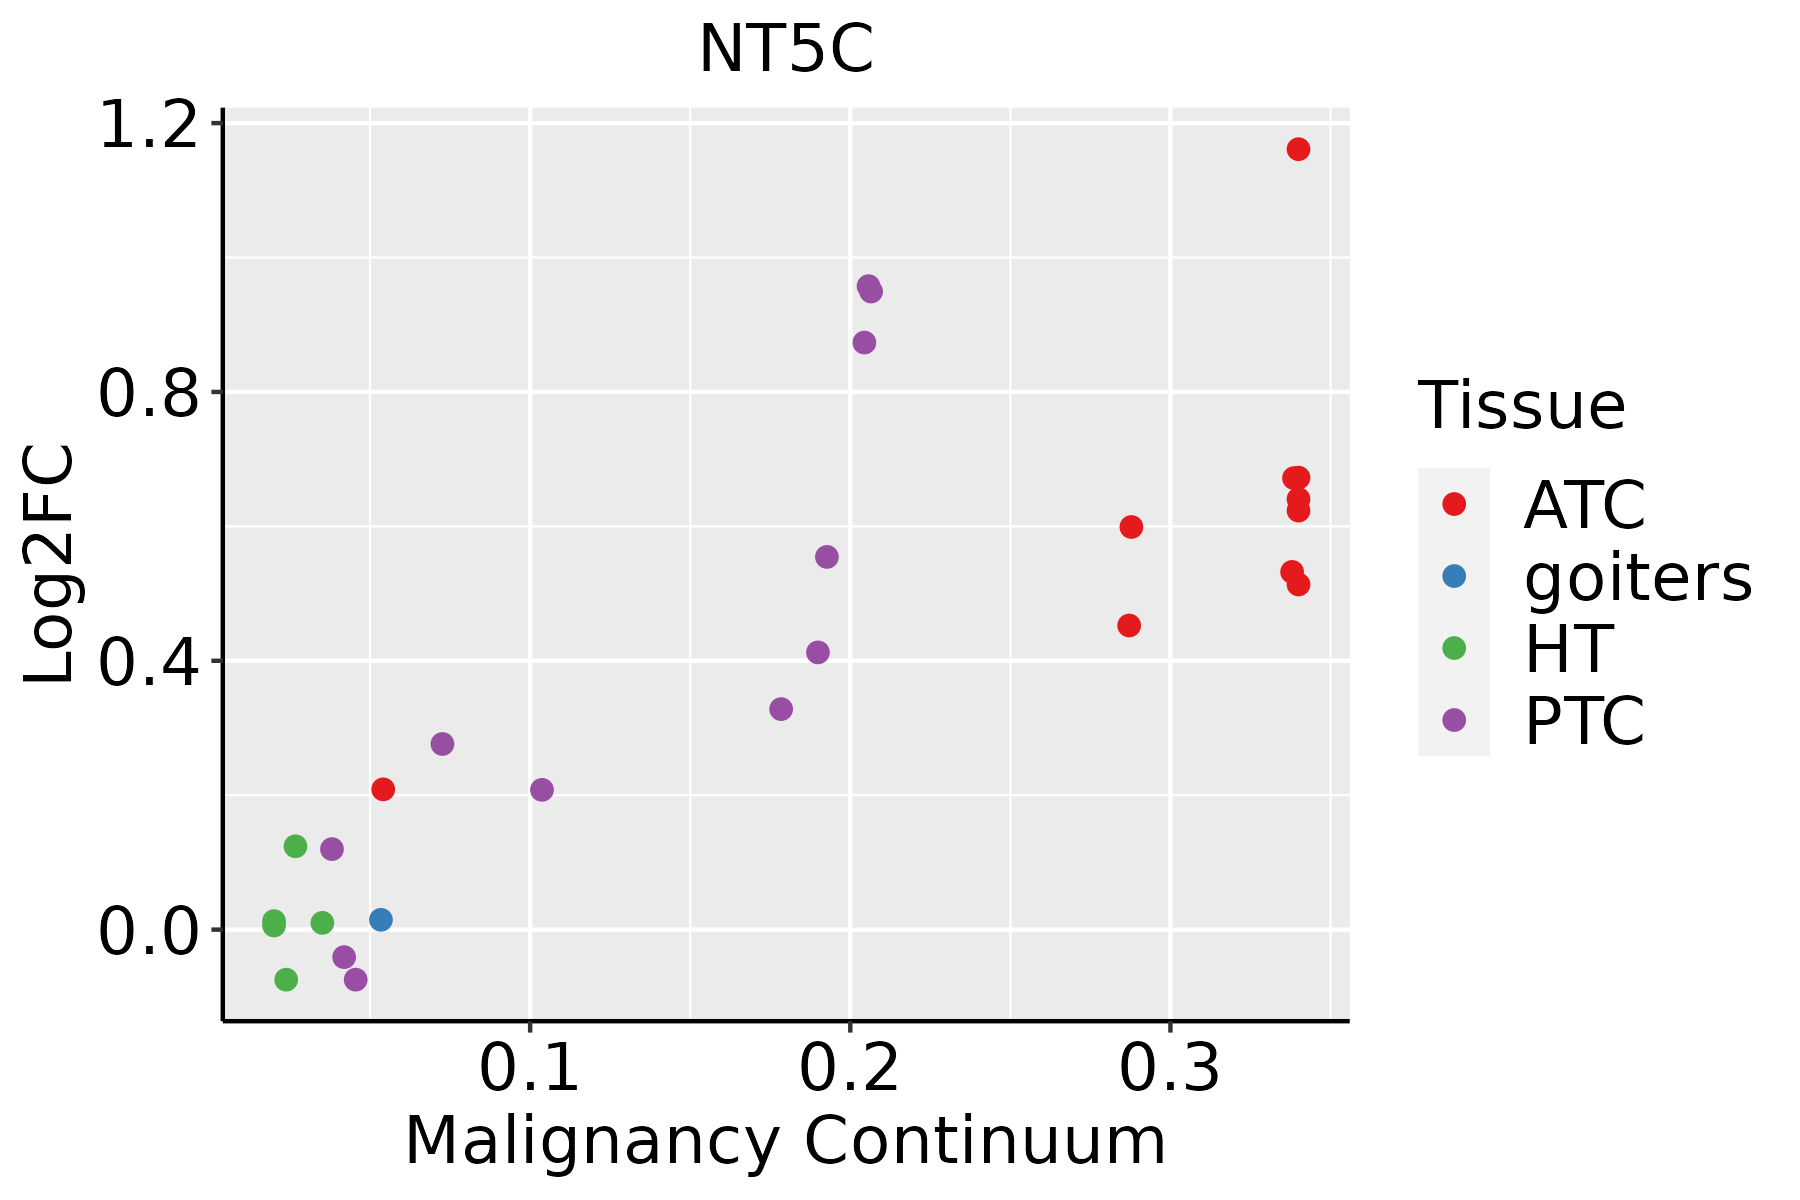 | ATC: Anaplastic thyroid cancer |
| HT: Hashimoto's thyroiditis | ||
| PTC: Papillary thyroid cancer |
| ∗log2FC in expression of this searched gene in stem-like cells from each diseased tissue sample relative to stem-like cells in normal samples in each tissue plotted against the malignancy continuum. Samples are colored based on if they are from different disease stage. |
Top |
Malignant transformation related pathway analysis |
| Find out the enriched GO biological processes and KEGG pathways involved in transition from healthy to precancer to cancer |
| Tissue | Disease Stage | Enriched GO biological Processes |
| Colorectum | AD |  |
| Colorectum | SER |  |
| Colorectum | MSS |  |
| Colorectum | MSI-H |  |
| Colorectum | FAP |  |
| ∗Top 15 enriched GO BP terms are showed in the bar plot of each disease state in each tissue. Each row represents a significant GO biological process which is colored according to the -log10(p.adjust). |
| Page: 1 2 3 4 5 6 7 8 9 |
| GO ID | Tissue | Disease Stage | Description | Gene Ratio | Bg Ratio | pvalue | p.adjust | Count |
| GO:001714814 | Skin | cSCC | negative regulation of translation | 93/4864 | 245/18723 | 2.28e-05 | 2.63e-04 | 93 |
| GO:0009150112 | Skin | cSCC | purine ribonucleotide metabolic process | 131/4864 | 368/18723 | 2.42e-05 | 2.76e-04 | 131 |
| GO:000028818 | Skin | cSCC | nuclear-transcribed mRNA catabolic process, deadenylation-dependent decay | 29/4864 | 56/18723 | 3.25e-05 | 3.56e-04 | 29 |
| GO:00002914 | Skin | cSCC | nuclear-transcribed mRNA catabolic process, exonucleolytic | 13/4864 | 19/18723 | 1.27e-04 | 1.16e-03 | 13 |
| GO:00091679 | Skin | cSCC | purine ribonucleoside monophosphate metabolic process | 22/4864 | 41/18723 | 1.46e-04 | 1.31e-03 | 22 |
| GO:00439284 | Skin | cSCC | exonucleolytic catabolism of deadenylated mRNA | 10/4864 | 13/18723 | 1.78e-04 | 1.50e-03 | 10 |
| GO:00091616 | Skin | cSCC | ribonucleoside monophosphate metabolic process | 28/4864 | 58/18723 | 2.14e-04 | 1.77e-03 | 28 |
| GO:00092625 | Skin | cSCC | deoxyribonucleotide metabolic process | 22/4864 | 44/18723 | 5.41e-04 | 4.01e-03 | 22 |
| GO:00062204 | Skin | cSCC | pyrimidine nucleotide metabolic process | 24/4864 | 50/18723 | 6.60e-04 | 4.73e-03 | 24 |
| GO:00196925 | Skin | cSCC | deoxyribose phosphate metabolic process | 21/4864 | 42/18723 | 7.20e-04 | 5.05e-03 | 21 |
| GO:19016575 | Skin | cSCC | glycosyl compound metabolic process | 37/4864 | 88/18723 | 7.39e-04 | 5.15e-03 | 37 |
| GO:00091164 | Skin | cSCC | nucleoside metabolic process | 27/4864 | 62/18723 | 1.99e-03 | 1.19e-02 | 27 |
| GO:001631115 | Skin | cSCC | dephosphorylation | 134/4864 | 417/18723 | 2.65e-03 | 1.50e-02 | 134 |
| GO:00093945 | Skin | cSCC | 2'-deoxyribonucleotide metabolic process | 19/4864 | 40/18723 | 2.73e-03 | 1.54e-02 | 19 |
| GO:00091624 | Skin | cSCC | deoxyribonucleoside monophosphate metabolic process | 12/4864 | 23/18723 | 6.46e-03 | 3.15e-02 | 12 |
| GO:00092194 | Skin | cSCC | pyrimidine deoxyribonucleotide metabolic process | 12/4864 | 24/18723 | 9.91e-03 | 4.35e-02 | 12 |
| GO:0009896113 | Thyroid | PTC | positive regulation of catabolic process | 278/5968 | 492/18723 | 3.35e-30 | 2.64e-27 | 278 |
| GO:0031331113 | Thyroid | PTC | positive regulation of cellular catabolic process | 249/5968 | 427/18723 | 5.28e-30 | 3.58e-27 | 249 |
| GO:1903311112 | Thyroid | PTC | regulation of mRNA metabolic process | 181/5968 | 288/18723 | 1.60e-27 | 5.94e-25 | 181 |
| GO:0006401112 | Thyroid | PTC | RNA catabolic process | 163/5968 | 278/18723 | 2.13e-20 | 3.27e-18 | 163 |
| Page: 1 2 3 4 5 6 7 8 9 10 11 12 13 14 15 16 17 18 19 20 21 22 23 24 25 26 27 28 29 30 31 32 33 |
| Pathway ID | Tissue | Disease Stage | Description | Gene Ratio | Bg Ratio | pvalue | p.adjust | qvalue | Count |
| hsa012325 | Esophagus | ESCC | Nucleotide metabolism | 59/4205 | 85/8465 | 1.67e-04 | 6.58e-04 | 3.37e-04 | 59 |
| hsa002405 | Esophagus | ESCC | Pyrimidine metabolism | 41/4205 | 58/8465 | 9.14e-04 | 2.92e-03 | 1.49e-03 | 41 |
| hsa0123212 | Esophagus | ESCC | Nucleotide metabolism | 59/4205 | 85/8465 | 1.67e-04 | 6.58e-04 | 3.37e-04 | 59 |
| hsa0024012 | Esophagus | ESCC | Pyrimidine metabolism | 41/4205 | 58/8465 | 9.14e-04 | 2.92e-03 | 1.49e-03 | 41 |
| hsa01232 | Liver | Cirrhotic | Nucleotide metabolism | 39/2530 | 85/8465 | 1.27e-03 | 6.73e-03 | 4.15e-03 | 39 |
| hsa00240 | Liver | Cirrhotic | Pyrimidine metabolism | 27/2530 | 58/8465 | 5.31e-03 | 1.88e-02 | 1.16e-02 | 27 |
| hsa012321 | Liver | Cirrhotic | Nucleotide metabolism | 39/2530 | 85/8465 | 1.27e-03 | 6.73e-03 | 4.15e-03 | 39 |
| hsa002401 | Liver | Cirrhotic | Pyrimidine metabolism | 27/2530 | 58/8465 | 5.31e-03 | 1.88e-02 | 1.16e-02 | 27 |
| hsa002402 | Liver | HCC | Pyrimidine metabolism | 44/4020 | 58/8465 | 9.34e-06 | 7.11e-05 | 3.95e-05 | 44 |
| hsa012322 | Liver | HCC | Nucleotide metabolism | 59/4020 | 85/8465 | 3.30e-05 | 1.88e-04 | 1.04e-04 | 59 |
| hsa002403 | Liver | HCC | Pyrimidine metabolism | 44/4020 | 58/8465 | 9.34e-06 | 7.11e-05 | 3.95e-05 | 44 |
| hsa012323 | Liver | HCC | Nucleotide metabolism | 59/4020 | 85/8465 | 3.30e-05 | 1.88e-04 | 1.04e-04 | 59 |
| hsa012324 | Oral cavity | OSCC | Nucleotide metabolism | 54/3704 | 85/8465 | 1.78e-04 | 5.95e-04 | 3.03e-04 | 54 |
| hsa002404 | Oral cavity | OSCC | Pyrimidine metabolism | 37/3704 | 58/8465 | 1.62e-03 | 4.45e-03 | 2.26e-03 | 37 |
| hsa0123211 | Oral cavity | OSCC | Nucleotide metabolism | 54/3704 | 85/8465 | 1.78e-04 | 5.95e-04 | 3.03e-04 | 54 |
| hsa0024011 | Oral cavity | OSCC | Pyrimidine metabolism | 37/3704 | 58/8465 | 1.62e-03 | 4.45e-03 | 2.26e-03 | 37 |
| hsa0123221 | Oral cavity | LP | Nucleotide metabolism | 42/2418 | 85/8465 | 3.62e-05 | 2.36e-04 | 1.52e-04 | 42 |
| hsa0024021 | Oral cavity | LP | Pyrimidine metabolism | 28/2418 | 58/8465 | 1.12e-03 | 5.02e-03 | 3.24e-03 | 28 |
| hsa0123231 | Oral cavity | LP | Nucleotide metabolism | 42/2418 | 85/8465 | 3.62e-05 | 2.36e-04 | 1.52e-04 | 42 |
| hsa0024031 | Oral cavity | LP | Pyrimidine metabolism | 28/2418 | 58/8465 | 1.12e-03 | 5.02e-03 | 3.24e-03 | 28 |
| Page: 1 |
Top |
Cell-cell communication analysis |
| Identification of potential cell-cell interactions between two cell types and their ligand-receptor pairs for different disease states |
| Ligand | Receptor | LRpair | Pathway | Tissue | Disease Stage |
| Page: 1 |
Top |
Single-cell gene regulatory network inference analysis |
| Find out the significant the regulons (TFs) and the target genes of each regulon across cell types for different disease states |
| TF | Cell Type | Tissue | Disease Stage | Target Gene | RSS | Regulon Activity |
| ∗The dot plots of a searched regulon are shown for all cell subpopulations in each disease state of each tissue based on the regulon specific score inferred using pySCENIC and by calculating the average expression. |
| Page: 1 |
Top |
Somatic mutation of malignant transformation related genes |
| Annotation of somatic variants for genes involved in malignant transformation |
| Hugo Symbol | Variant Class | Variant Classification | dbSNP RS | HGVSc | HGVSp | HGVSp Short | SWISSPROT | BIOTYPE | SIFT | PolyPhen | Tumor Sample Barcode | Tissue | Histology | Sex | Age | Stage | Therapy Types | Drugs | Outcome |
| NT5C | insertion | Frame_Shift_Ins | novel | c.565_566insCTCACGCCTATAATCCCAGCACTTTGGGA | p.Glu189AlafsTer13 | p.E189Afs*13 | Q8TCD5 | protein_coding | TCGA-BH-A0AY-01 | Breast | breast invasive carcinoma | Female | <65 | I/II | Chemotherapy | SD | |||
| NT5C | SNV | Missense_Mutation | rs146917283 | c.272C>T | p.Pro91Leu | p.P91L | Q8TCD5 | protein_coding | tolerated(0.06) | benign(0.085) | TCGA-IR-A3LH-01 | Cervix | cervical & endocervical cancer | Female | <65 | I/II | Chemotherapy | cisplatin | CR |
| NT5C | SNV | Missense_Mutation | c.395N>T | p.Arg132Met | p.R132M | Q8TCD5 | protein_coding | deleterious(0) | possibly_damaging(0.892) | TCGA-A6-4105-01 | Colorectum | colon adenocarcinoma | Male | >=65 | I/II | Unknown | Unknown | PD | |
| NT5C | SNV | Missense_Mutation | c.305T>C | p.Leu102Pro | p.L102P | Q8TCD5 | protein_coding | deleterious(0.01) | benign(0.051) | TCGA-CK-4951-01 | Colorectum | colon adenocarcinoma | Female | >=65 | I/II | Unknown | Unknown | PD | |
| NT5C | SNV | Missense_Mutation | novel | c.445N>T | p.Val149Phe | p.V149F | Q8TCD5 | protein_coding | deleterious(0.01) | benign(0.225) | TCGA-AP-A059-01 | Endometrium | uterine corpus endometrioid carcinoma | Female | >=65 | I/II | Unknown | Unknown | SD |
| NT5C | SNV | Missense_Mutation | c.226N>T | p.Pro76Ser | p.P76S | Q8TCD5 | protein_coding | deleterious(0) | probably_damaging(0.987) | TCGA-AX-A0J0-01 | Endometrium | uterine corpus endometrioid carcinoma | Female | <65 | I/II | Unknown | Unknown | SD | |
| NT5C | SNV | Missense_Mutation | novel | c.191N>C | p.Val64Ala | p.V64A | Q8TCD5 | protein_coding | deleterious(0.02) | benign(0.272) | TCGA-AX-A2HJ-01 | Endometrium | uterine corpus endometrioid carcinoma | Female | <65 | I/II | Unknown | Unknown | SD |
| NT5C | SNV | Missense_Mutation | rs576379965 | c.478C>T | p.His160Tyr | p.H160Y | Q8TCD5 | protein_coding | deleterious(0) | probably_damaging(0.995) | TCGA-B5-A3FC-01 | Endometrium | uterine corpus endometrioid carcinoma | Female | <65 | I/II | Unknown | Unknown | SD |
| NT5C | SNV | Missense_Mutation | novel | c.524N>T | p.Pro175Leu | p.P175L | Q8TCD5 | protein_coding | deleterious(0.01) | benign(0.059) | TCGA-BG-A2L7-01 | Endometrium | uterine corpus endometrioid carcinoma | Female | >=65 | I/II | Chemotherapy | carboplatin | CR |
| NT5C | SNV | Missense_Mutation | novel | c.598N>T | p.Arg200Trp | p.R200W | Q8TCD5 | protein_coding | deleterious_low_confidence(0) | benign(0) | TCGA-FI-A2D5-01 | Endometrium | uterine corpus endometrioid carcinoma | Female | <65 | III/IV | Chemotherapy | carboplatinum | PD |
| Page: 1 2 |
Top |
Related drugs of malignant transformation related genes |
| Identification of chemicals and drugs interact with genes involved in malignant transfromation |
| (DGIdb 4.0) |
| Entrez ID | Symbol | Category | Interaction Types | Drug Claim Name | Drug Name | PMIDs |
| 30833 | NT5C | ENZYME | lamivudine | LAMIVUDINE | ||
| 30833 | NT5C | ENZYME | gemcitabine | GEMCITABINE | 25162786 |
| Page: 1 |

Copyright 2023-Present -The University of Texas Health Science Center at Houston |