Schematic overview of the cellular and molecular mechanisms involved in the cancer progression, including the proposed cellular and molecular mechanisms in cancer cells trajectory. AT1: alveolar type 1 cells; AT2: alveolar type 2 cells; AAH: atypical adenomatous hyperplasia; AIS: adenocarcinoma in situ; MIA: minimally invasive adenocarcinoma; IA: invasive adenocarcinoma; EMT: epithelial-mesenchymal transition

Home

Download

Statistics

Help

Contact

Center for Computational Systems Medicine
leaf

Gene summary

leaf

Malignant transformation analysis

leaf

Malignant transformation related pathway analysis

leaf

Cell-cell communication analysis

leaf

Single-cell gene regulatory network inference analysis

leaf

Somatic mutation of malignant transformation related genes

leaf

Related drugs of malignant transformation related genes

Gene: HECTD1

Gene summary for HECTD1

check button Gene summary.

Gene informationSpeciesHuman
Gene symbol

HECTD1

Gene ID

25831

Gene nameHECT domain E3 ubiquitin protein ligase 1
Gene AliasEULIR
Cytomap14q12
Gene Typeprotein-coding
GO ID

GO:0000003

UniProtAcc

Q9ULT8


Top

Malignant transformation analysis

check button Identification of the aberrant gene expression in precancerous and cancerous lesions by comparing the gene expression of stem-like cells in diseased tissues with normal stem cells
check button Malignant transformation involving gene list.
Entrez IDSymbolReplicatesSpeciesOrganTissueAdj P-valueLog2FCMalignancy
25831HECTD1HTA11_3410_2000001011HumanColorectumAD1.06e-19-5.59e-010.0155
25831HECTD1HTA11_347_2000001011HumanColorectumAD1.18e-054.85e-01-0.1954
25831HECTD1HTA11_3361_2000001011HumanColorectumAD4.17e-09-5.29e-01-0.1207
25831HECTD1HTA11_5212_2000001011HumanColorectumAD6.67e-03-5.25e-01-0.2061
25831HECTD1HTA11_99999971662_82457HumanColorectumMSS5.99e-06-4.19e-010.3859
25831HECTD1HTA11_99999973899_84307HumanColorectumMSS1.98e-03-5.06e-010.2585
25831HECTD1HTA11_99999974143_84620HumanColorectumMSS5.90e-08-4.61e-010.3005
25831HECTD1F007HumanColorectumFAP3.76e-04-3.83e-010.1176
25831HECTD1A001-C-207HumanColorectumFAP1.15e-03-1.84e-010.1278
25831HECTD1A015-C-203HumanColorectumFAP3.58e-31-3.49e-01-0.1294
25831HECTD1A015-C-204HumanColorectumFAP9.65e-05-2.46e-01-0.0228
25831HECTD1A014-C-040HumanColorectumFAP6.94e-05-3.05e-01-0.1184
25831HECTD1A002-C-201HumanColorectumFAP1.46e-15-3.66e-010.0324
25831HECTD1A002-C-203HumanColorectumFAP1.05e-06-1.69e-010.2786
25831HECTD1A001-C-119HumanColorectumFAP2.16e-05-1.45e-01-0.1557
25831HECTD1A001-C-108HumanColorectumFAP1.47e-19-1.75e-01-0.0272
25831HECTD1A002-C-205HumanColorectumFAP6.00e-25-1.93e-01-0.1236
25831HECTD1A001-C-104HumanColorectumFAP1.80e-02-7.51e-020.0184
25831HECTD1A015-C-005HumanColorectumFAP1.02e-09-4.07e-01-0.0336
25831HECTD1A015-C-006HumanColorectumFAP3.28e-16-4.08e-01-0.0994
Page: 1 2 3 4 5 6 7 8 9 10 11 

check button Transcriptomic changes along malignancy continuum.
TissueExpression DynamicsAbbreviation
Colorectum (GSE201348)The image shows the transcriptomic changes along malignancy continuum.log2FC in expression of this searched gene in stem-like cells from each diseased tissue sample relative to stem-like cells in normal samples in each tissue plotted against the malignancy continuum. Samples are colored based on if they are from different disease stage.FAP: Familial adenomatous polyposis
CRC: Colorectal cancer
Colorectum (HTA11)The image shows the transcriptomic changes along malignancy continuum.log2FC in expression of this searched gene in stem-like cells from each diseased tissue sample relative to stem-like cells in normal samples in each tissue plotted against the malignancy continuum. Samples are colored based on if they are from different disease stage.AD: Adenomas
SER: Sessile serrated lesions
MSI-H: Microsatellite-high colorectal cancer
MSS: Microsatellite stable colorectal cancer
EsophagusThe image shows the transcriptomic changes along malignancy continuum.log2FC in expression of this searched gene in stem-like cells from each diseased tissue sample relative to stem-like cells in normal samples in each tissue plotted against the malignancy continuum. Samples are colored based on if they are from different disease stage.ESCC: Esophageal squamous cell carcinoma
HGIN: High-grade intraepithelial neoplasias
LGIN: Low-grade intraepithelial neoplasias
LiverThe image shows the transcriptomic changes along malignancy continuum.log2FC in expression of this searched gene in stem-like cells from each diseased tissue sample relative to stem-like cells in normal samples in each tissue plotted against the malignancy continuum. Samples are colored based on if they are from different disease stage.HCC: Hepatocellular carcinoma
NAFLD: Non-alcoholic fatty liver disease
LungThe image shows the transcriptomic changes along malignancy continuum.log2FC in expression of this searched gene in stem-like cells from each diseased tissue sample relative to stem-like cells in normal samples in each tissue plotted against the malignancy continuum. Samples are colored based on if they are from different disease stage.
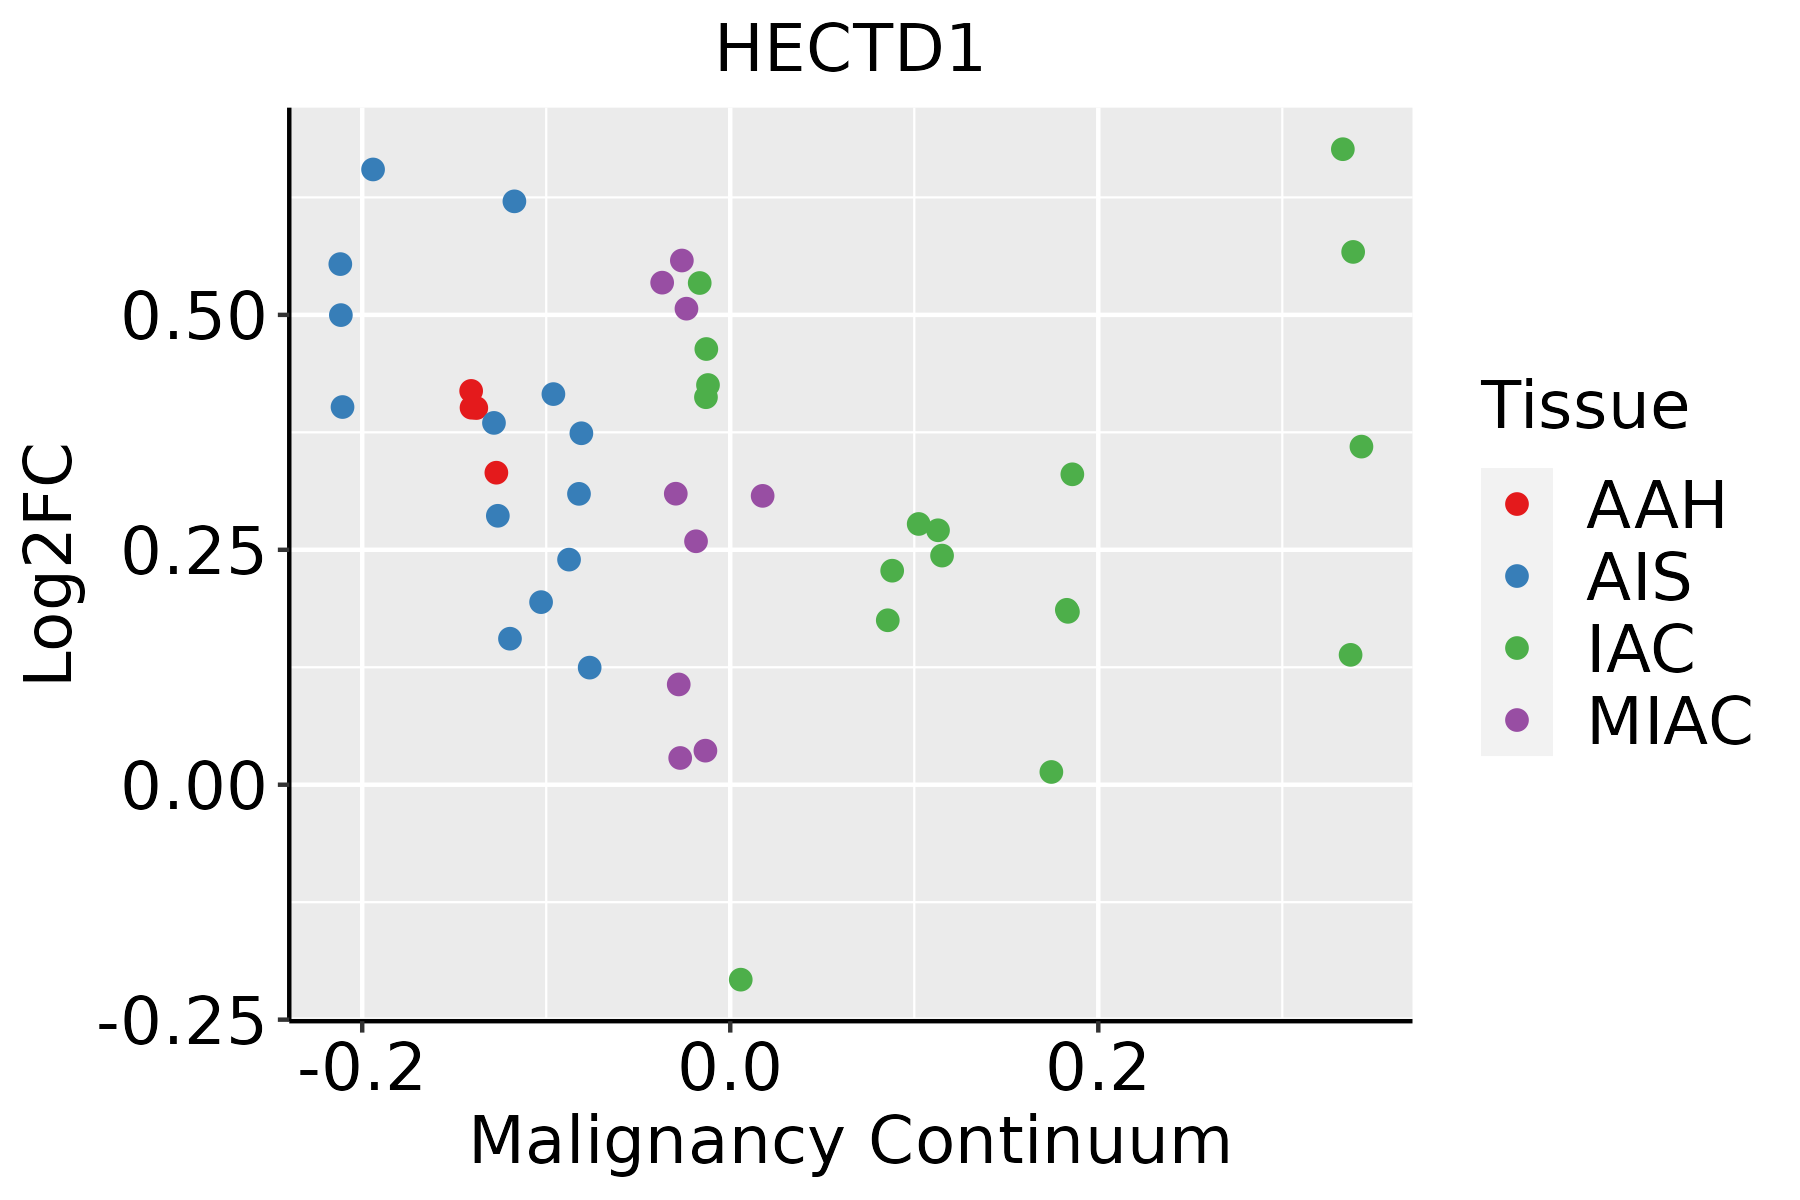
AAH: Atypical adenomatous hyperplasia
AIS: Adenocarcinoma in situ
IAC: Invasive lung adenocarcinoma
MIA: Minimally invasive adenocarcinoma
Oral CavityThe image shows the transcriptomic changes along malignancy continuum.log2FC in expression of this searched gene in stem-like cells from each diseased tissue sample relative to stem-like cells in normal samples in each tissue plotted against the malignancy continuum. Samples are colored based on if they are from different disease stage.
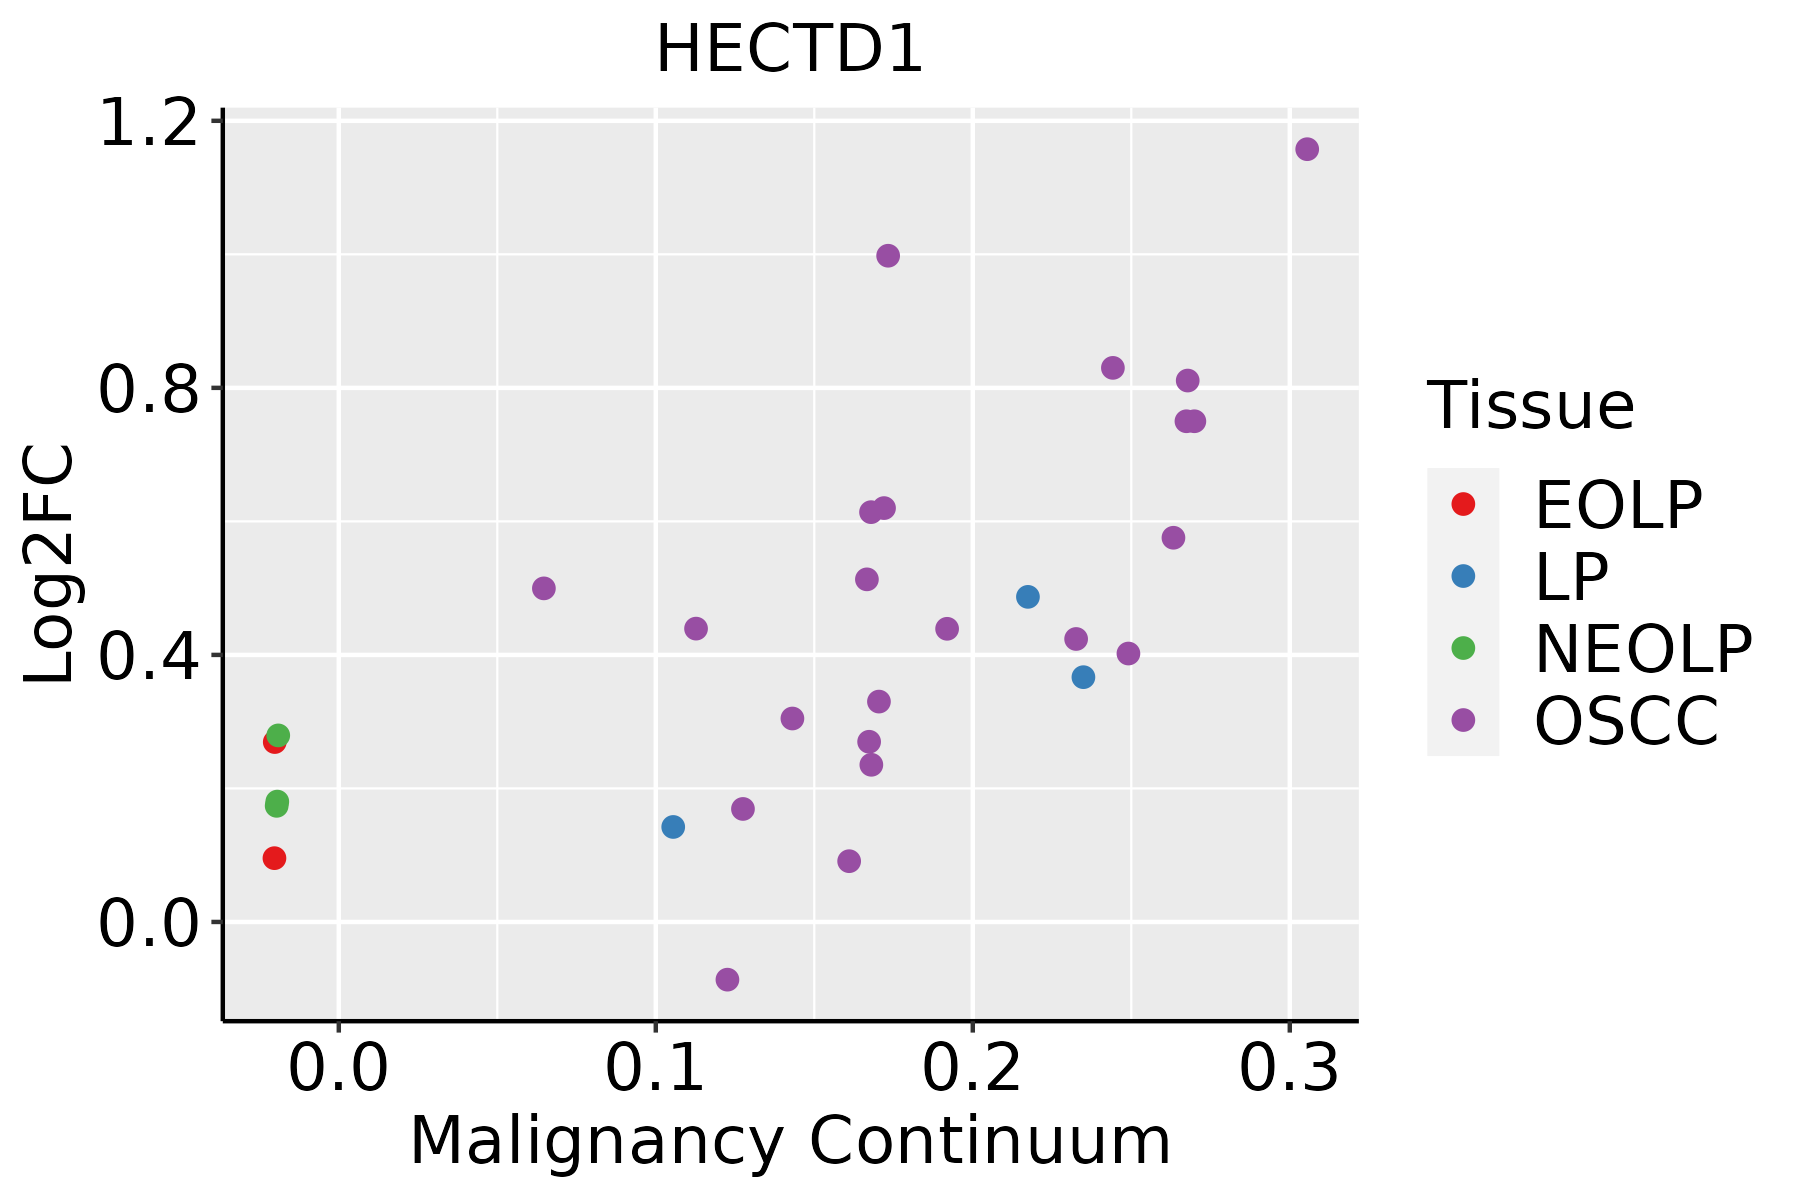
EOLP: Erosive Oral lichen planus
LP: leukoplakia
NEOLP: Non-erosive oral lichen planus
OSCC: Oral squamous cell carcinoma
ProstateThe image shows the transcriptomic changes along malignancy continuum.log2FC in expression of this searched gene in stem-like cells from each diseased tissue sample relative to stem-like cells in normal samples in each tissue plotted against the malignancy continuum. Samples are colored based on if they are from different disease stage.
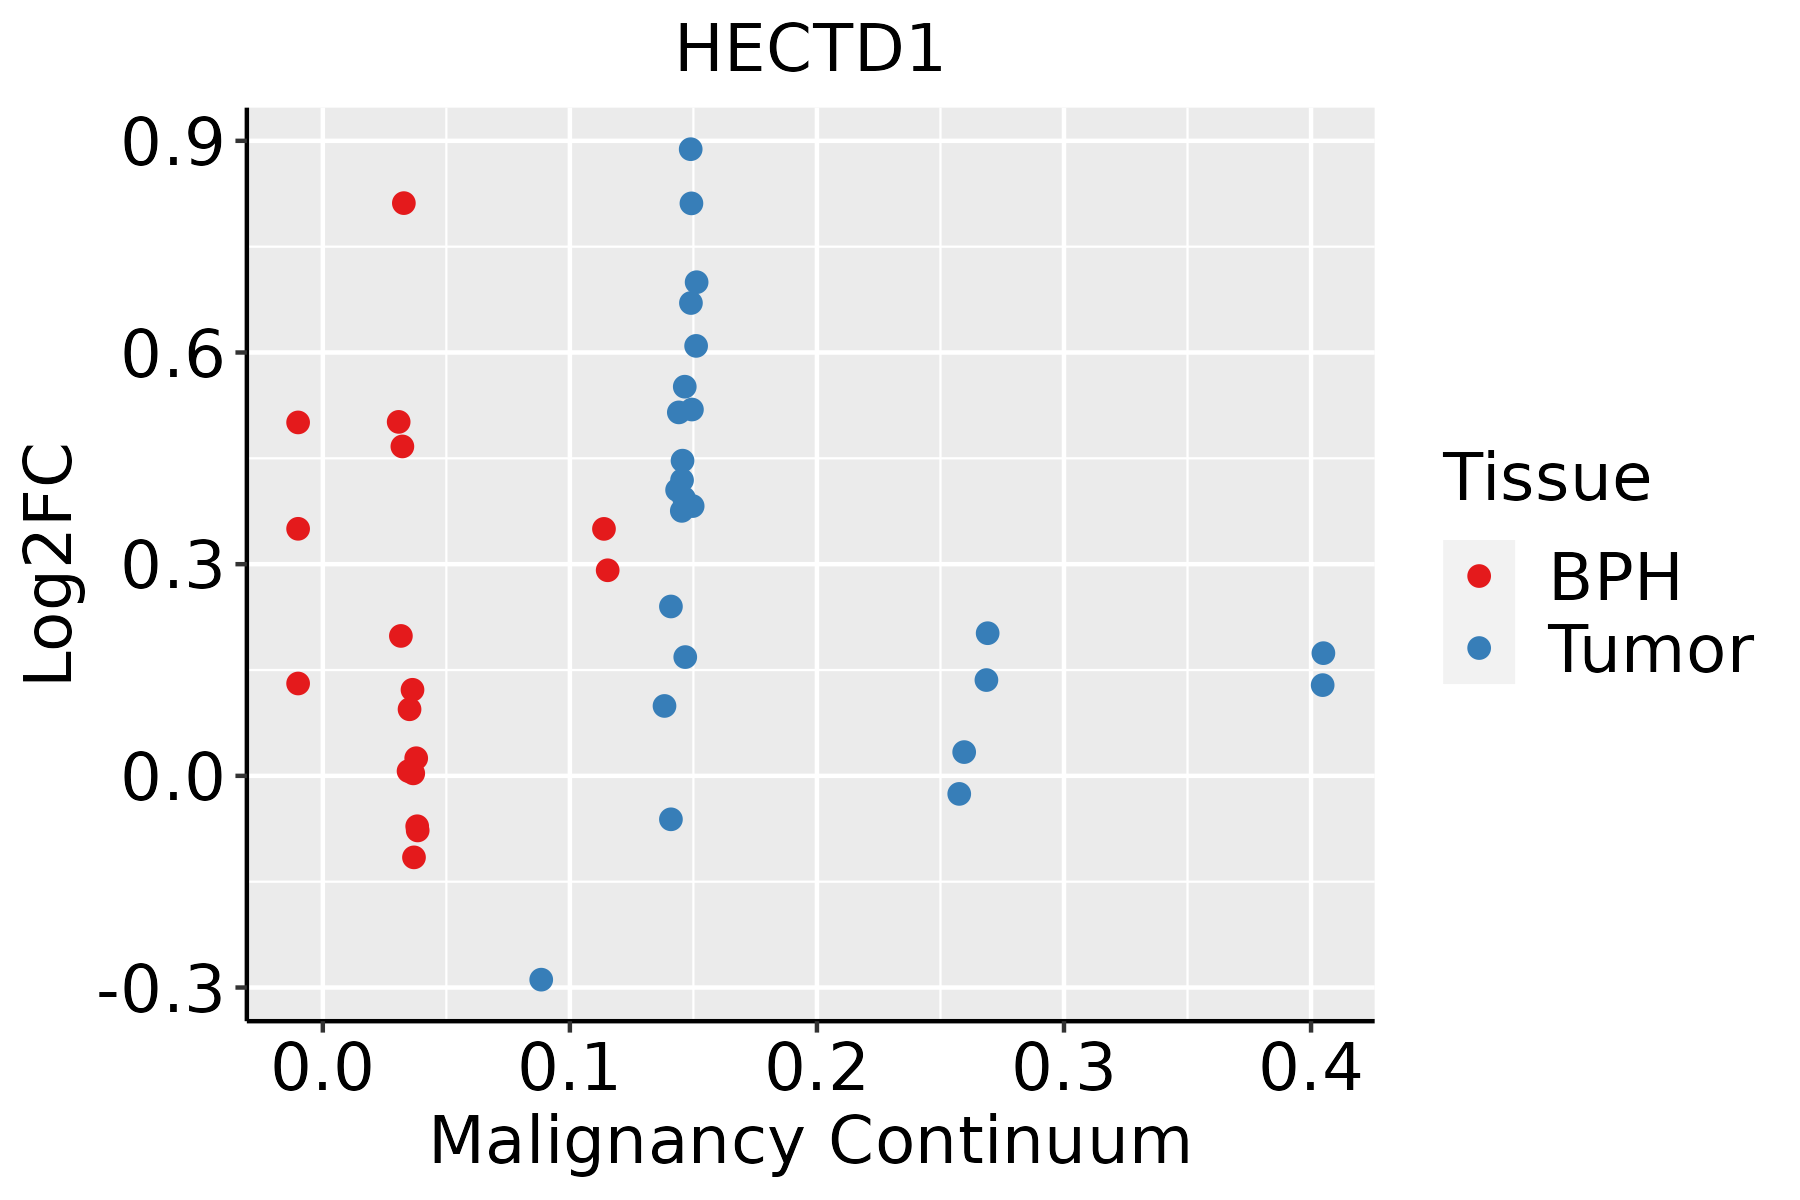
BPH: Benign Prostatic Hyperplasia
SkinThe image shows the transcriptomic changes along malignancy continuum.log2FC in expression of this searched gene in stem-like cells from each diseased tissue sample relative to stem-like cells in normal samples in each tissue plotted against the malignancy continuum. Samples are colored based on if they are from different disease stage.
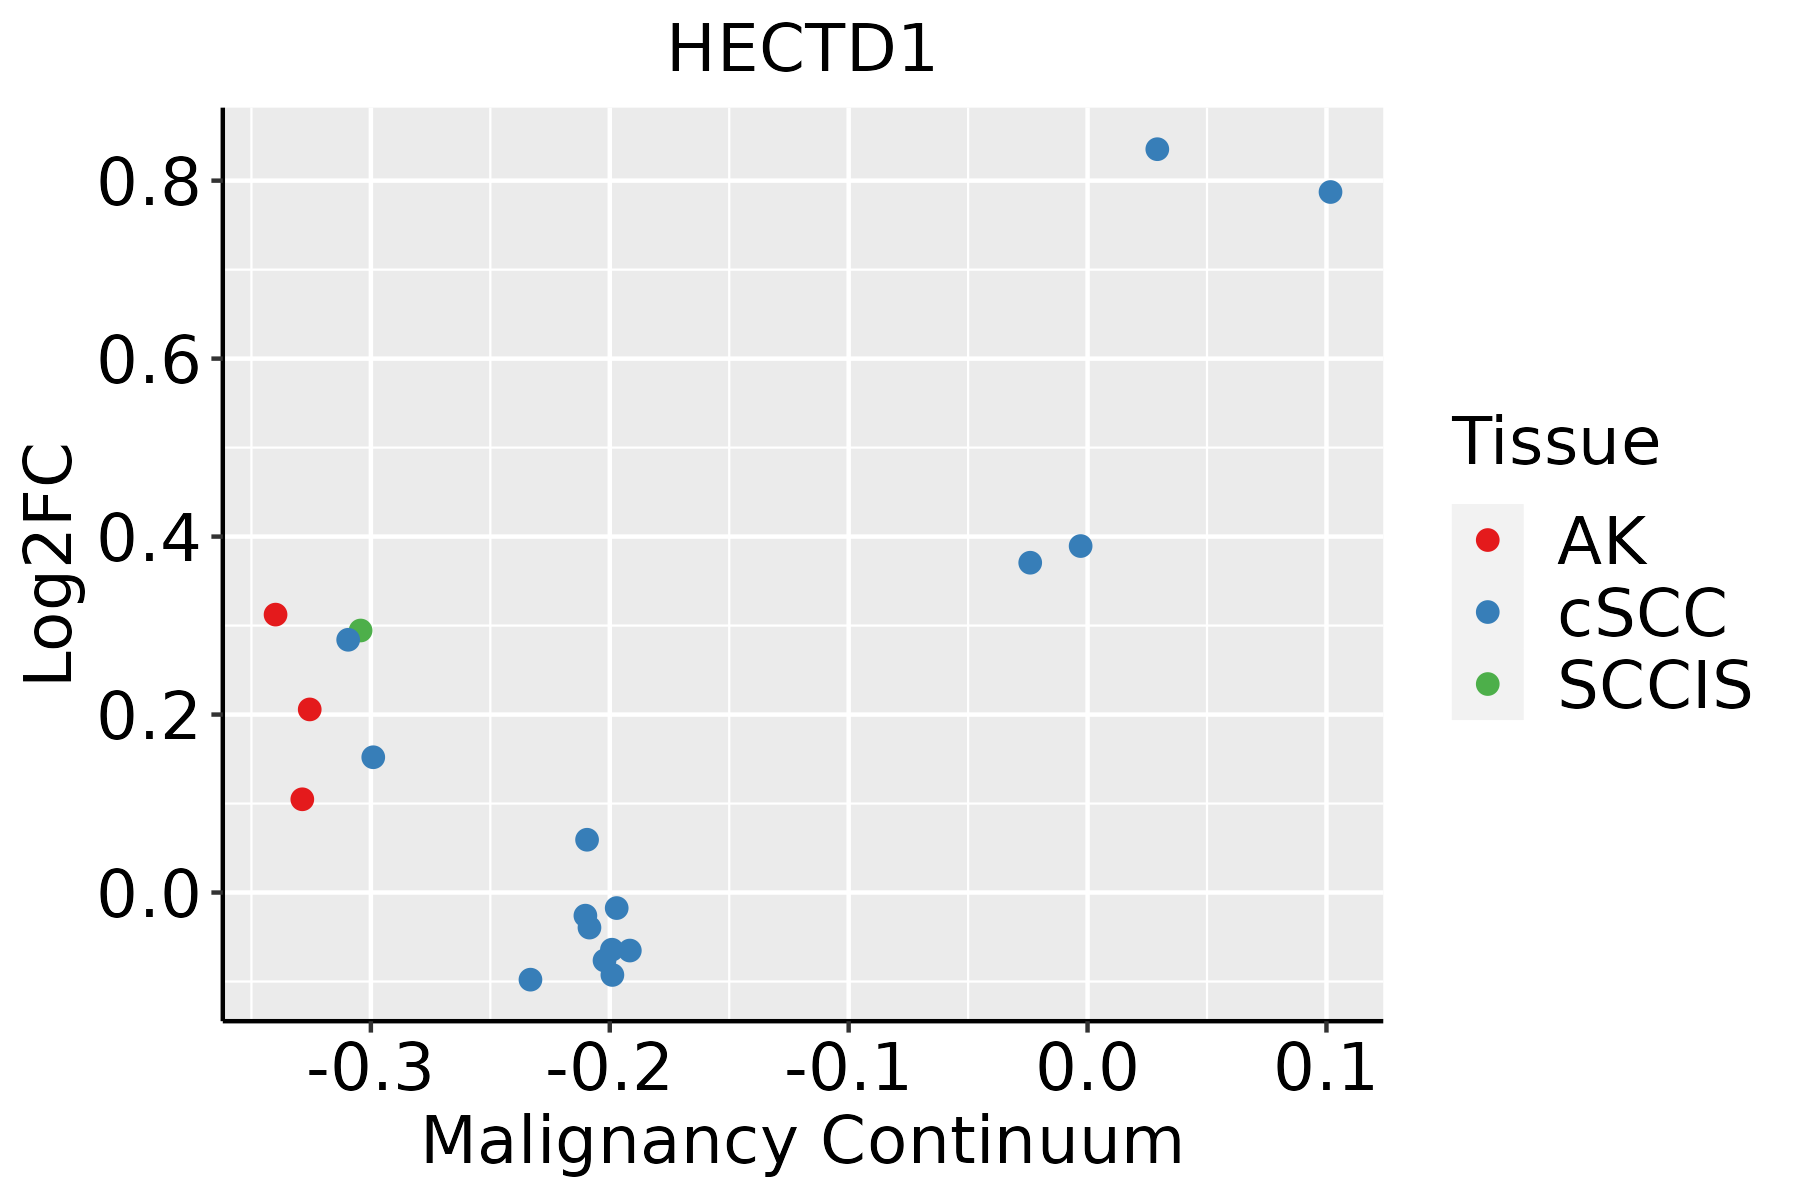
AK: Actinic keratosis
cSCC: Cutaneous squamous cell carcinoma
SCCIS:squamous cell carcinoma in situ
ThyroidThe image shows the transcriptomic changes along malignancy continuum.log2FC in expression of this searched gene in stem-like cells from each diseased tissue sample relative to stem-like cells in normal samples in each tissue plotted against the malignancy continuum. Samples are colored based on if they are from different disease stage.
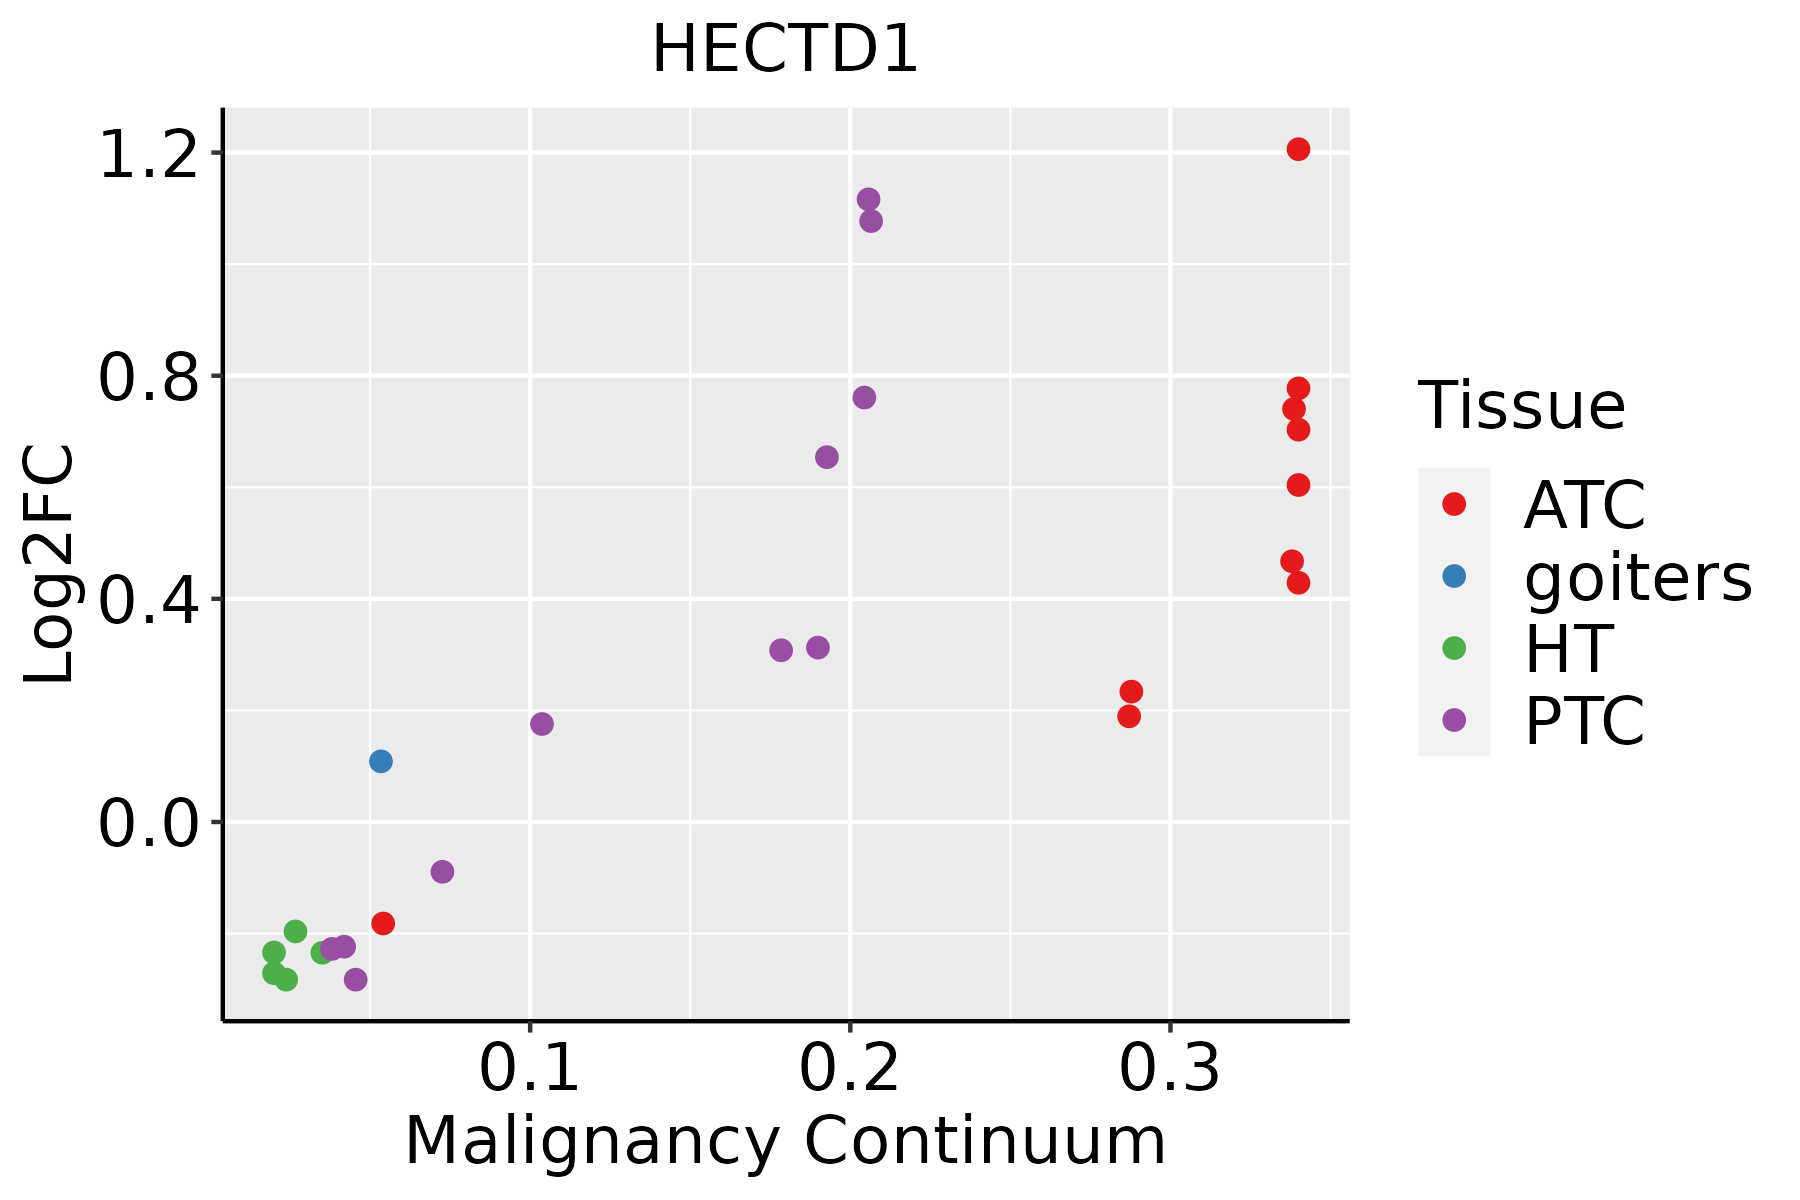
ATC: Anaplastic thyroid cancer
HT: Hashimoto's thyroiditis
PTC: Papillary thyroid cancer
∗log2FC in expression of this searched gene in stem-like cells from each diseased tissue sample relative to stem-like cells in normal samples in each tissue plotted against the malignancy continuum. Samples are colored based on if they are from different disease stage.

Top

Malignant transformation related pathway analysis

check buttonFind out the enriched GO biological processes and KEGG pathways involved in transition from healthy to precancer to cancer
check button Figure of enriched GO biological processes.
TissueDisease StageEnriched GO biological Processes
ColorectumADGO analysis - Figure of enriched GO biological processes: Top 15 enriched GO BP terms are showed in the bar plot of each disease state in each tissue. Each row represents a significant GO biological process which is colored according to the -log10(p.adjust).
ColorectumSERGO analysis - Figure of enriched GO biological processes: Top 15 enriched GO BP terms are showed in the bar plot of each disease state in each tissue. Each row represents a significant GO biological process which is colored according to the -log10(p.adjust).
ColorectumMSSGO analysis - Figure of enriched GO biological processes: Top 15 enriched GO BP terms are showed in the bar plot of each disease state in each tissue. Each row represents a significant GO biological process which is colored according to the -log10(p.adjust).
ColorectumMSI-HGO analysis - Figure of enriched GO biological processes: Top 15 enriched GO BP terms are showed in the bar plot of each disease state in each tissue. Each row represents a significant GO biological process which is colored according to the -log10(p.adjust).
ColorectumFAPGO analysis - Figure of enriched GO biological processes: Top 15 enriched GO BP terms are showed in the bar plot of each disease state in each tissue. Each row represents a significant GO biological process which is colored according to the -log10(p.adjust).
∗Top 15 enriched GO BP terms are showed in the bar plot of each disease state in each tissue. Each row represents a significant GO biological process which is colored according to the -log10(p.adjust).
Page: 1 2 3 4 5 6 7 8 9 

check button Enriched GO biological processes.
GO IDTissueDisease StageDescriptionGene RatioBg Ratiopvaluep.adjustCount
GO:003243433Oral cavityNEOLPregulation of proteasomal ubiquitin-dependent protein catabolic process38/2005134/187231.19e-085.70e-0738
GO:190336433Oral cavityNEOLPpositive regulation of cellular protein catabolic process41/2005155/187232.87e-081.22e-0641
GO:006113632Oral cavityNEOLPregulation of proteasomal protein catabolic process46/2005187/187234.76e-081.95e-0646
GO:000189231Oral cavityNEOLPembryonic placenta development27/200582/187235.12e-082.08e-0627
GO:000020931Oral cavityNEOLPprotein polyubiquitination53/2005236/187231.22e-074.38e-0653
GO:003243632Oral cavityNEOLPpositive regulation of proteasomal ubiquitin-dependent protein catabolic process26/200590/187231.58e-063.89e-0526
GO:200006032Oral cavityNEOLPpositive regulation of ubiquitin-dependent protein catabolic process29/2005107/187231.72e-064.19e-0529
GO:190313122Oral cavityNEOLPmononuclear cell differentiation77/2005426/187232.80e-066.41e-0577
GO:007265931Oral cavityNEOLPprotein localization to plasma membrane56/2005284/187234.51e-069.60e-0556
GO:190180031Oral cavityNEOLPpositive regulation of proteasomal protein catabolic process29/2005114/187236.80e-061.36e-0429
GO:190305232Oral cavityNEOLPpositive regulation of proteolysis involved in cellular protein catabolic process32/2005133/187238.26e-061.60e-0432
GO:199077831Oral cavityNEOLPprotein localization to cell periphery62/2005333/187239.84e-061.86e-0462
GO:003009821Oral cavityNEOLPlymphocyte differentiation66/2005374/187233.08e-054.67e-0466
GO:00485686Oral cavityNEOLPembryonic organ development71/2005427/187231.12e-041.34e-0371
GO:007053421Oral cavityNEOLPprotein K63-linked ubiquitination16/200556/187231.80e-041.97e-0316
GO:00032312Oral cavityNEOLPcardiac ventricle development27/2005123/187232.14e-042.27e-0327
GO:0060840Oral cavityNEOLPartery development23/2005100/187233.00e-042.97e-0323
GO:00032814Oral cavityNEOLPventricular septum development17/200571/187231.10e-038.28e-0317
GO:000317011Oral cavityNEOLPheart valve development16/200565/187231.11e-038.33e-0316
GO:00032053Oral cavityNEOLPcardiac chamber development30/2005161/187231.78e-031.22e-0230
Page: 1 2 3 4 5 6 7 8 9 10 11 12 13 14 15 16 17 18 19 20 21 22 23 24 25 26 27 28 29 30 31 32 33 34 35 36 37 38 39 40 41 42 43 44 

check button Enriched KEGG pathways.
Pathway IDTissueDisease StageDescriptionGene RatioBg Ratiopvaluep.adjustqvalueCount
Page: 1 

Top

Cell-cell communication analysis

check buttonIdentification of potential cell-cell interactions between two cell types and their ligand-receptor pairs for different disease states
LigandReceptorLRpairPathwayTissueDisease Stage
Page: 1 

Top

Single-cell gene regulatory network inference analysis

check buttonFind out the significant the regulons (TFs) and the target genes of each regulon across cell types for different disease states
TFCell TypeTissueDisease StageTarget GeneRSSRegulon Activity
∗The dot plots of a searched regulon are shown for all cell subpopulations in each disease state of each tissue based on the regulon specific score inferred using pySCENIC and by calculating the average expression.
Page: 1 

Top

Somatic mutation of malignant transformation related genes

check buttonAnnotation of somatic variants for genes involved in malignant transformation
Hugo SymbolVariant ClassVariant ClassificationdbSNP RSHGVScHGVSpHGVSp ShortSWISSPROTBIOTYPESIFTPolyPhenTumor Sample BarcodeTissueHistologySexAgeStageTherapy TypesDrugsOutcome
HECTD1SNVMissense_Mutationc.6715N>Ap.Glu2239Lysp.E2239KQ9ULT8protein_codingtolerated(0.11)probably_damaging(0.973)TCGA-A2-A0YK-01Breastbreast invasive carcinomaFemale<65I/IIChemotherapycytoxanSD
HECTD1SNVMissense_Mutationc.140N>Gp.Thr47Argp.T47RQ9ULT8protein_codingdeleterious(0.01)benign(0.148)TCGA-A2-A0YM-01Breastbreast invasive carcinomaFemale>=65I/IIUnknownUnknownSD
HECTD1SNVMissense_Mutationc.2228N>Gp.Pro743Argp.P743RQ9ULT8protein_codingdeleterious(0)possibly_damaging(0.896)TCGA-A8-A08P-01Breastbreast invasive carcinomaFemale>=65III/IVChemotherapy5-fluorouracilCR
HECTD1SNVMissense_Mutationc.5992G>Cp.Glu1998Glnp.E1998QQ9ULT8protein_codingdeleterious(0.01)benign(0.115)TCGA-A8-A095-01Breastbreast invasive carcinomaFemale<65I/IIChemotherapy5-fluorouracilCR
HECTD1SNVMissense_Mutationrs755152978c.3005N>Ap.Arg1002Glnp.R1002QQ9ULT8protein_codingdeleterious(0)probably_damaging(0.916)TCGA-A8-A09W-01Breastbreast invasive carcinomaFemale>=65III/IVUnknownUnknownSD
HECTD1SNVMissense_Mutationrs748524391c.4411N>Tp.Arg1471Cysp.R1471CQ9ULT8protein_codingdeleterious(0.02)benign(0.336)TCGA-AN-A046-01Breastbreast invasive carcinomaFemale>=65I/IIUnknownUnknownSD
HECTD1SNVMissense_Mutationc.1259N>Tp.Ala420Valp.A420VQ9ULT8protein_codingdeleterious(0)probably_damaging(0.982)TCGA-AO-A0J9-01Breastbreast invasive carcinomaFemale<65III/IVChemotherapycyclophosphamidePD
HECTD1SNVMissense_Mutationc.1510G>Ap.Glu504Lysp.E504KQ9ULT8protein_codingtolerated(0.26)benign(0.009)TCGA-AR-A0TP-01Breastbreast invasive carcinomaFemale<65I/IIChemotherapydoxorubicinSD
HECTD1SNVMissense_Mutationc.4696C>Gp.Leu1566Valp.L1566VQ9ULT8protein_codingtolerated(0.29)probably_damaging(0.931)TCGA-B6-A0RG-01Breastbreast invasive carcinomaFemale<65I/IIUnknownUnknownSD
HECTD1SNVMissense_Mutationnovelc.3858N>Tp.Trp1286Cysp.W1286CQ9ULT8protein_codingdeleterious(0)probably_damaging(0.999)TCGA-BH-A2L8-01Breastbreast invasive carcinomaFemale<65I/IIChemotherapycytoxanCR
Page: 1 2 3 4 5 6 7 8 9 10 11 12 13 14 15 16 17 18 19 20 21 22 

Top

Related drugs of malignant transformation related genes

check buttonIdentification of chemicals and drugs interact with genes involved in malignant transfromation
(DGIdb 4.0)
Entrez IDSymbolCategoryInteraction TypesDrug Claim NameDrug NamePMIDs
Page: 1