
|
|||||
|
 | |
| |
| |
| |
| |
| |
|
Gene: FAS |
Gene summary for FAS |
| Gene information | Species | Human | Gene symbol | FAS | Gene ID | 355 |
| Gene name | Fas cell surface death receptor | |
| Gene Alias | ALPS1A | |
| Cytomap | 10q23.31 | |
| Gene Type | protein-coding | GO ID | GO:0000165 | UniProtAcc | P25445 |
Top |
Malignant transformation analysis |
| Identification of the aberrant gene expression in precancerous and cancerous lesions by comparing the gene expression of stem-like cells in diseased tissues with normal stem cells |
| Entrez ID | Symbol | Replicates | Species | Organ | Tissue | Adj P-value | Log2FC | Malignancy |
| 355 | FAS | LZE4T | Human | Esophagus | ESCC | 9.35e-06 | 1.19e-01 | 0.0811 |
| 355 | FAS | LZE8T | Human | Esophagus | ESCC | 3.11e-08 | 2.93e-01 | 0.067 |
| 355 | FAS | LZE20T | Human | Esophagus | ESCC | 1.03e-05 | 3.08e-02 | 0.0662 |
| 355 | FAS | LZE22D1 | Human | Esophagus | HGIN | 6.30e-06 | 1.15e-01 | 0.0595 |
| 355 | FAS | LZE22T | Human | Esophagus | ESCC | 4.91e-02 | 2.67e-01 | 0.068 |
| 355 | FAS | LZE24T | Human | Esophagus | ESCC | 1.64e-11 | 2.72e-02 | 0.0596 |
| 355 | FAS | LZE6T | Human | Esophagus | ESCC | 3.85e-03 | 2.03e-01 | 0.0845 |
| 355 | FAS | P2T-E | Human | Esophagus | ESCC | 5.17e-36 | 8.88e-01 | 0.1177 |
| 355 | FAS | P4T-E | Human | Esophagus | ESCC | 7.55e-04 | 2.05e-02 | 0.1323 |
| 355 | FAS | P8T-E | Human | Esophagus | ESCC | 1.93e-19 | 2.75e-01 | 0.0889 |
| 355 | FAS | P9T-E | Human | Esophagus | ESCC | 3.13e-07 | 1.05e-01 | 0.1131 |
| 355 | FAS | P11T-E | Human | Esophagus | ESCC | 5.71e-06 | 3.92e-01 | 0.1426 |
| 355 | FAS | P15T-E | Human | Esophagus | ESCC | 2.41e-06 | 6.38e-02 | 0.1149 |
| 355 | FAS | P16T-E | Human | Esophagus | ESCC | 4.63e-02 | 2.46e-02 | 0.1153 |
| 355 | FAS | P21T-E | Human | Esophagus | ESCC | 3.15e-05 | 1.90e-01 | 0.1617 |
| 355 | FAS | P22T-E | Human | Esophagus | ESCC | 1.01e-03 | -2.44e-02 | 0.1236 |
| 355 | FAS | P23T-E | Human | Esophagus | ESCC | 4.67e-11 | 3.15e-01 | 0.108 |
| 355 | FAS | P24T-E | Human | Esophagus | ESCC | 4.87e-11 | 1.95e-01 | 0.1287 |
| 355 | FAS | P26T-E | Human | Esophagus | ESCC | 2.19e-07 | 9.14e-02 | 0.1276 |
| 355 | FAS | P27T-E | Human | Esophagus | ESCC | 9.86e-04 | 1.08e-01 | 0.1055 |
| Page: 1 2 3 4 |
| Tissue | Expression Dynamics | Abbreviation |
| Esophagus | 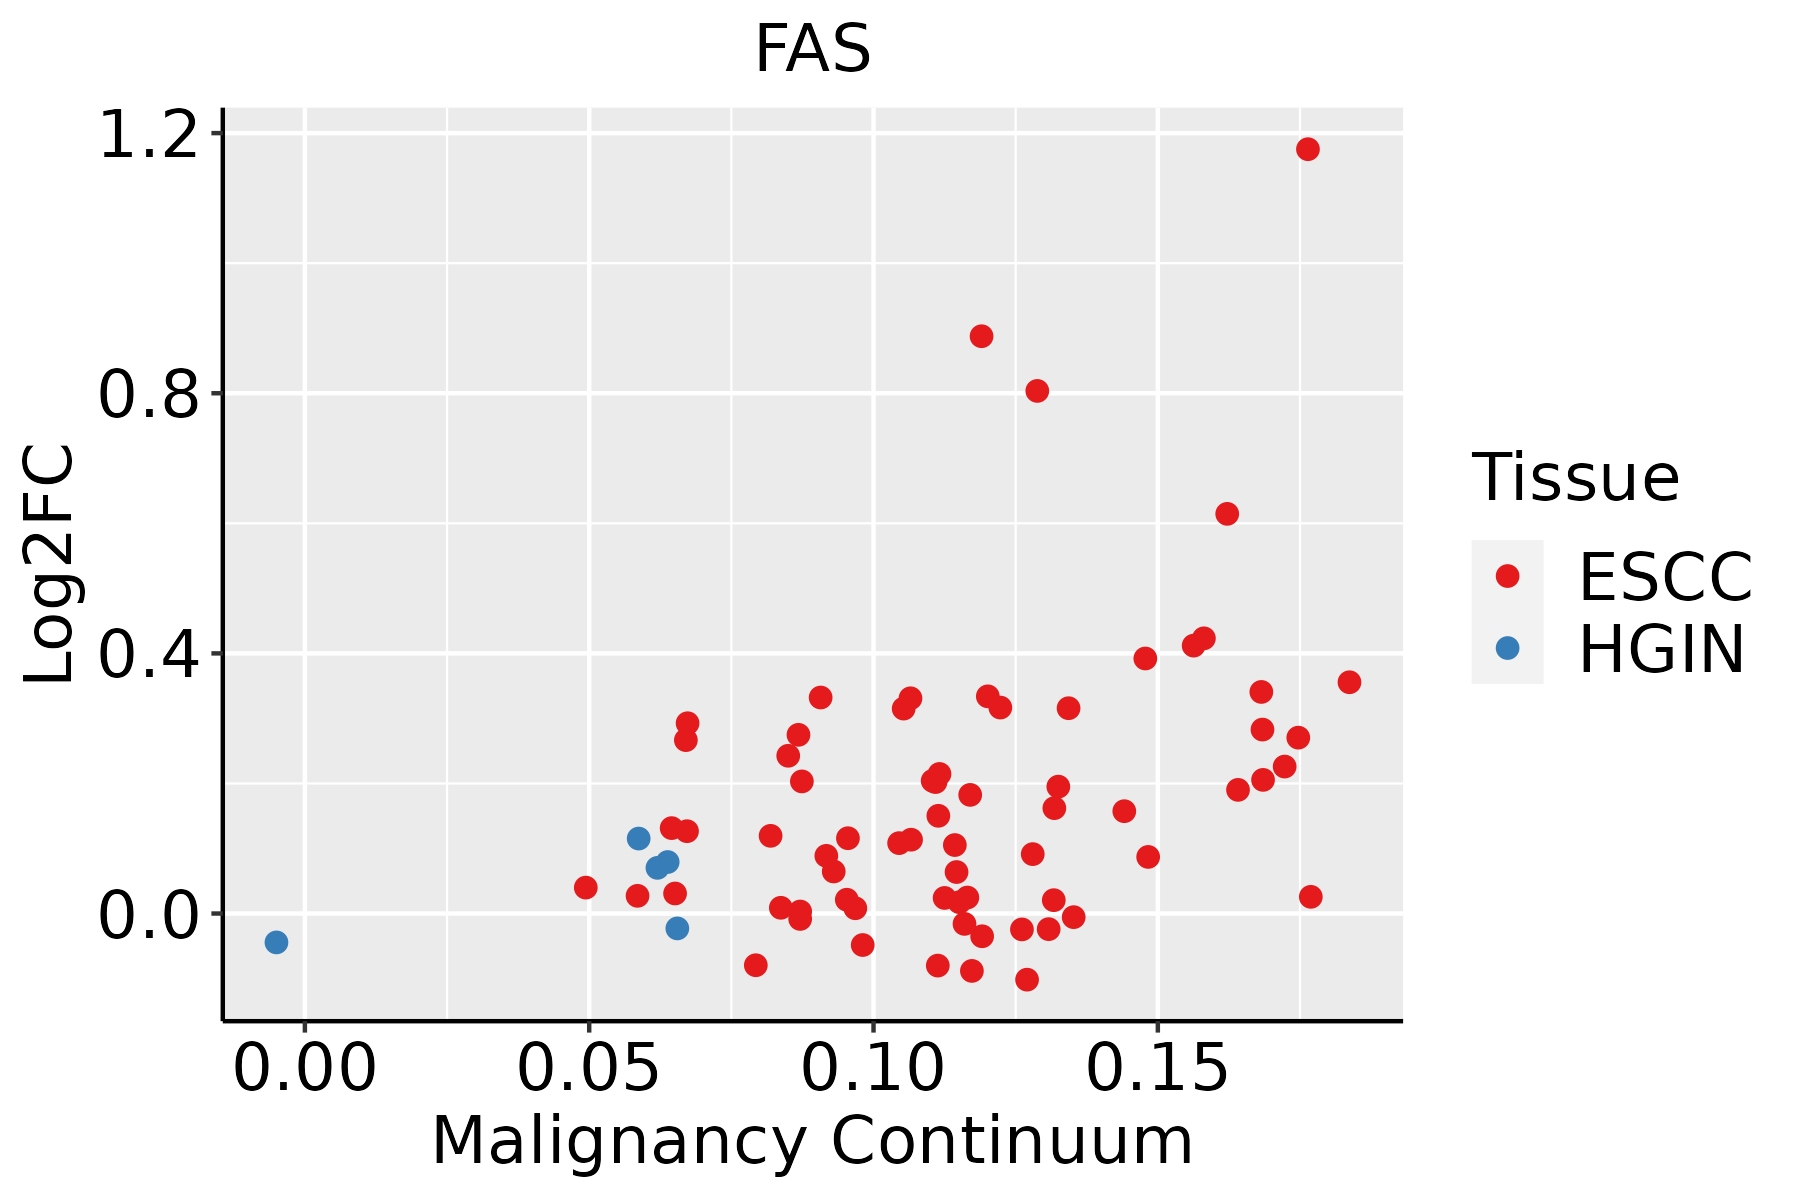 | ESCC: Esophageal squamous cell carcinoma |
| HGIN: High-grade intraepithelial neoplasias | ||
| LGIN: Low-grade intraepithelial neoplasias | ||
| Oral Cavity |  | EOLP: Erosive Oral lichen planus |
| LP: leukoplakia | ||
| NEOLP: Non-erosive oral lichen planus | ||
| OSCC: Oral squamous cell carcinoma | ||
| Thyroid | 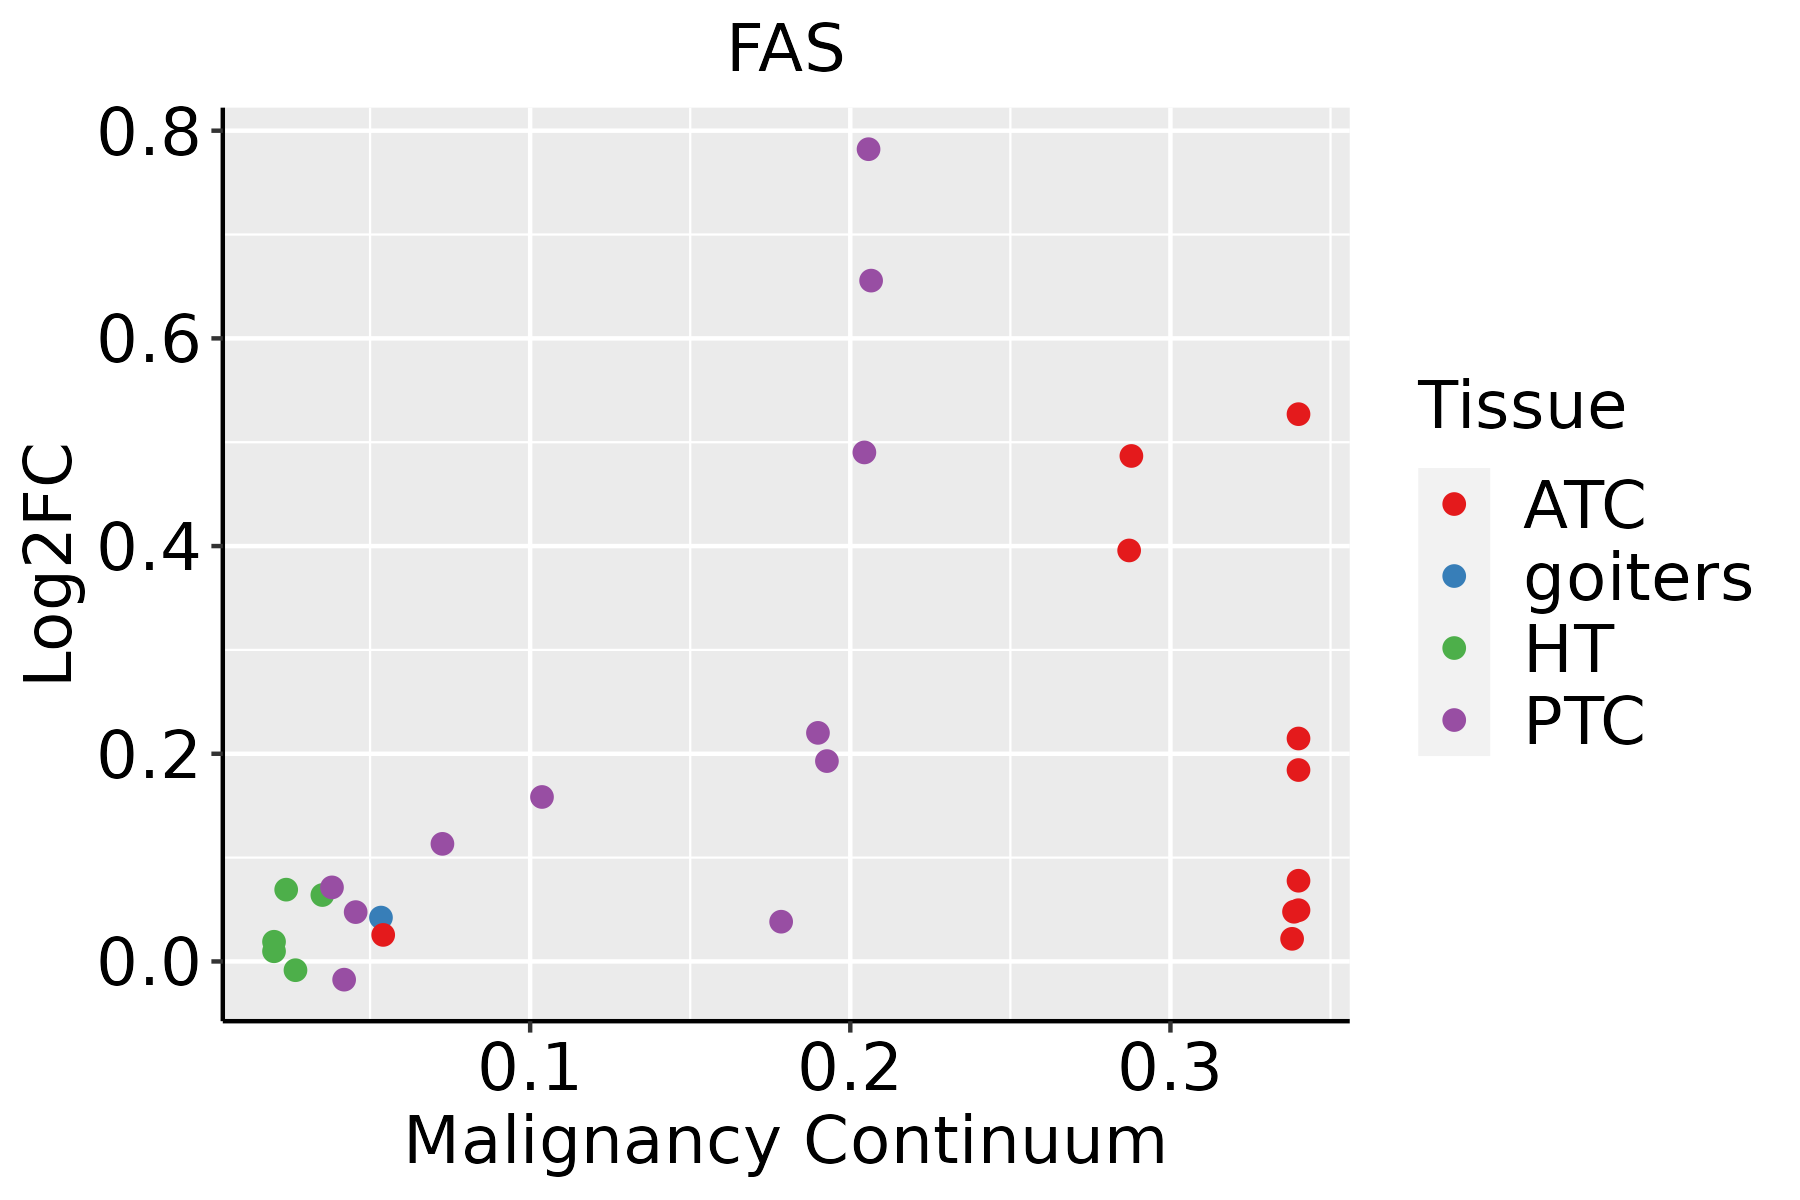 | ATC: Anaplastic thyroid cancer |
| HT: Hashimoto's thyroiditis | ||
| PTC: Papillary thyroid cancer |
| ∗log2FC in expression of this searched gene in stem-like cells from each diseased tissue sample relative to stem-like cells in normal samples in each tissue plotted against the malignancy continuum. Samples are colored based on if they are from different disease stage. |
Top |
Malignant transformation related pathway analysis |
| Find out the enriched GO biological processes and KEGG pathways involved in transition from healthy to precancer to cancer |
| Tissue | Disease Stage | Enriched GO biological Processes |
| Colorectum | AD |  |
| Colorectum | SER |  |
| Colorectum | MSS |  |
| Colorectum | MSI-H |  |
| Colorectum | FAP |  |
| ∗Top 15 enriched GO BP terms are showed in the bar plot of each disease state in each tissue. Each row represents a significant GO biological process which is colored according to the -log10(p.adjust). |
| Page: 1 2 3 4 5 6 7 8 9 |
| GO ID | Tissue | Disease Stage | Description | Gene Ratio | Bg Ratio | pvalue | p.adjust | Count |
| GO:0001776 | Oral cavity | OSCC | leukocyte homeostasis | 48/7305 | 87/18723 | 1.60e-03 | 7.62e-03 | 48 |
| GO:00621251 | Oral cavity | OSCC | regulation of mitochondrial gene expression | 19/7305 | 28/18723 | 1.88e-03 | 8.84e-03 | 19 |
| GO:00362962 | Oral cavity | OSCC | response to increased oxygen levels | 20/7305 | 30/18723 | 1.99e-03 | 9.23e-03 | 20 |
| GO:003022414 | Oral cavity | OSCC | monocyte differentiation | 23/7305 | 36/18723 | 2.19e-03 | 9.95e-03 | 23 |
| GO:00905577 | Oral cavity | OSCC | establishment of endothelial intestinal barrier | 10/7305 | 12/18723 | 2.25e-03 | 1.00e-02 | 10 |
| GO:00338654 | Oral cavity | OSCC | nucleoside bisphosphate metabolic process | 66/7305 | 128/18723 | 2.58e-03 | 1.13e-02 | 66 |
| GO:00338754 | Oral cavity | OSCC | ribonucleoside bisphosphate metabolic process | 66/7305 | 128/18723 | 2.58e-03 | 1.13e-02 | 66 |
| GO:00340324 | Oral cavity | OSCC | purine nucleoside bisphosphate metabolic process | 66/7305 | 128/18723 | 2.58e-03 | 1.13e-02 | 66 |
| GO:0070227 | Oral cavity | OSCC | lymphocyte apoptotic process | 40/7305 | 72/18723 | 3.21e-03 | 1.38e-02 | 40 |
| GO:00009591 | Oral cavity | OSCC | mitochondrial RNA metabolic process | 29/7305 | 49/18723 | 3.33e-03 | 1.42e-02 | 29 |
| GO:00454469 | Oral cavity | OSCC | endothelial cell differentiation | 61/7305 | 118/18723 | 3.40e-03 | 1.44e-02 | 61 |
| GO:0097300 | Oral cavity | OSCC | programmed necrotic cell death | 28/7305 | 47/18723 | 3.41e-03 | 1.45e-02 | 28 |
| GO:00713535 | Oral cavity | OSCC | cellular response to interleukin-4 | 21/7305 | 33/18723 | 3.63e-03 | 1.51e-02 | 21 |
| GO:00060842 | Oral cavity | OSCC | acetyl-CoA metabolic process | 22/7305 | 35/18723 | 3.65e-03 | 1.51e-02 | 22 |
| GO:003087910 | Oral cavity | OSCC | mammary gland development | 69/7305 | 137/18723 | 4.43e-03 | 1.79e-02 | 69 |
| GO:0000963 | Oral cavity | OSCC | mitochondrial RNA processing | 14/7305 | 20/18723 | 4.95e-03 | 1.94e-02 | 14 |
| GO:00066373 | Oral cavity | OSCC | acyl-CoA metabolic process | 50/7305 | 96/18723 | 6.24e-03 | 2.35e-02 | 50 |
| GO:00353833 | Oral cavity | OSCC | thioester metabolic process | 50/7305 | 96/18723 | 6.24e-03 | 2.35e-02 | 50 |
| GO:00701311 | Oral cavity | OSCC | positive regulation of mitochondrial translation | 11/7305 | 15/18723 | 7.49e-03 | 2.75e-02 | 11 |
| GO:00702653 | Oral cavity | OSCC | necrotic cell death | 34/7305 | 62/18723 | 8.23e-03 | 3.00e-02 | 34 |
| Page: 1 2 3 4 5 6 7 8 9 10 11 12 13 14 15 16 17 18 19 20 21 22 23 24 25 26 27 28 29 30 31 32 33 34 35 36 37 38 39 40 41 42 43 44 45 46 |
| Pathway ID | Tissue | Disease Stage | Description | Gene Ratio | Bg Ratio | pvalue | p.adjust | qvalue | Count |
| hsa0502230 | Esophagus | HGIN | Pathways of neurodegeneration - multiple diseases | 153/1383 | 476/8465 | 1.22e-18 | 4.41e-17 | 3.50e-17 | 153 |
| hsa0501030 | Esophagus | HGIN | Alzheimer disease | 130/1383 | 384/8465 | 5.26e-18 | 1.71e-16 | 1.36e-16 | 130 |
| hsa0493230 | Esophagus | HGIN | Non-alcoholic fatty liver disease | 66/1383 | 155/8465 | 5.21e-15 | 1.21e-13 | 9.64e-14 | 66 |
| hsa0513039 | Esophagus | HGIN | Pathogenic Escherichia coli infection | 54/1383 | 197/8465 | 4.91e-05 | 6.15e-04 | 4.89e-04 | 54 |
| hsa0516930 | Esophagus | HGIN | Epstein-Barr virus infection | 55/1383 | 202/8465 | 5.13e-05 | 6.19e-04 | 4.92e-04 | 55 |
| hsa0516730 | Esophagus | HGIN | Kaposi sarcoma-associated herpesvirus infection | 51/1383 | 194/8465 | 2.46e-04 | 2.69e-03 | 2.14e-03 | 51 |
| hsa0421020 | Esophagus | HGIN | Apoptosis | 36/1383 | 136/8465 | 1.67e-03 | 1.52e-02 | 1.20e-02 | 36 |
| hsa0517029 | Esophagus | HGIN | Human immunodeficiency virus 1 infection | 51/1383 | 212/8465 | 2.16e-03 | 1.90e-02 | 1.51e-02 | 51 |
| hsa0541739 | Esophagus | HGIN | Lipid and atherosclerosis | 51/1383 | 215/8465 | 2.95e-03 | 2.41e-02 | 1.91e-02 | 51 |
| hsa0516420 | Esophagus | HGIN | Influenza A | 42/1383 | 171/8465 | 3.41e-03 | 2.54e-02 | 2.02e-02 | 42 |
| hsa0411510 | Esophagus | HGIN | p53 signaling pathway | 21/1383 | 74/8465 | 6.25e-03 | 4.25e-02 | 3.37e-02 | 21 |
| hsa0516330 | Esophagus | HGIN | Human cytomegalovirus infection | 51/1383 | 225/8465 | 7.67e-03 | 4.63e-02 | 3.68e-02 | 51 |
| hsa0520528 | Esophagus | HGIN | Proteoglycans in cancer | 47/1383 | 205/8465 | 8.23e-03 | 4.71e-02 | 3.74e-02 | 47 |
| hsa05022113 | Esophagus | HGIN | Pathways of neurodegeneration - multiple diseases | 153/1383 | 476/8465 | 1.22e-18 | 4.41e-17 | 3.50e-17 | 153 |
| hsa05010113 | Esophagus | HGIN | Alzheimer disease | 130/1383 | 384/8465 | 5.26e-18 | 1.71e-16 | 1.36e-16 | 130 |
| hsa04932113 | Esophagus | HGIN | Non-alcoholic fatty liver disease | 66/1383 | 155/8465 | 5.21e-15 | 1.21e-13 | 9.64e-14 | 66 |
| hsa05130115 | Esophagus | HGIN | Pathogenic Escherichia coli infection | 54/1383 | 197/8465 | 4.91e-05 | 6.15e-04 | 4.89e-04 | 54 |
| hsa05169114 | Esophagus | HGIN | Epstein-Barr virus infection | 55/1383 | 202/8465 | 5.13e-05 | 6.19e-04 | 4.92e-04 | 55 |
| hsa05167114 | Esophagus | HGIN | Kaposi sarcoma-associated herpesvirus infection | 51/1383 | 194/8465 | 2.46e-04 | 2.69e-03 | 2.14e-03 | 51 |
| hsa04210110 | Esophagus | HGIN | Apoptosis | 36/1383 | 136/8465 | 1.67e-03 | 1.52e-02 | 1.20e-02 | 36 |
| Page: 1 2 3 4 5 6 7 8 |
Top |
Cell-cell communication analysis |
| Identification of potential cell-cell interactions between two cell types and their ligand-receptor pairs for different disease states |
| Ligand | Receptor | LRpair | Pathway | Tissue | Disease Stage |
| FASLG | FAS | FASL_FAS | FASLG | Breast | ADJ |
| FASLG | FAS | FASL_FAS | FASLG | Breast | DCIS |
| FASLG | FAS | FASL_FAS | FASLG | Cervix | ADJ |
| FASLG | FAS | FASL_FAS | FASLG | Cervix | CC |
| FASLG | FAS | FASL_FAS | FASLG | Cervix | Healthy |
| FASLG | FAS | FASL_FAS | FASLG | Cervix | Precancer |
| FASLG | FAS | FASL_FAS | FASLG | Endometrium | ADJ |
| FASLG | FAS | FASL_FAS | FASLG | Endometrium | AEH |
| FASLG | FAS | FASL_FAS | FASLG | Endometrium | EEC |
| FASLG | FAS | FASL_FAS | FASLG | HNSCC | OSCC |
| FASLG | FAS | FASL_FAS | FASLG | THCA | ADJ |
| FASLG | FAS | FASL_FAS | FASLG | THCA | Cancer |
| Page: 1 |
Top |
Single-cell gene regulatory network inference analysis |
| Find out the significant the regulons (TFs) and the target genes of each regulon across cell types for different disease states |
| TF | Cell Type | Tissue | Disease Stage | Target Gene | RSS | Regulon Activity |
| ∗The dot plots of a searched regulon are shown for all cell subpopulations in each disease state of each tissue based on the regulon specific score inferred using pySCENIC and by calculating the average expression. |
| Page: 1 |
Top |
Somatic mutation of malignant transformation related genes |
| Annotation of somatic variants for genes involved in malignant transformation |
| Hugo Symbol | Variant Class | Variant Classification | dbSNP RS | HGVSc | HGVSp | HGVSp Short | SWISSPROT | BIOTYPE | SIFT | PolyPhen | Tumor Sample Barcode | Tissue | Histology | Sex | Age | Stage | Therapy Types | Drugs | Outcome |
| FAS | SNV | Missense_Mutation | c.682N>A | p.Asp228Asn | p.D228N | P25445 | protein_coding | deleterious(0.04) | benign(0.323) | TCGA-C8-A12T-01 | Breast | breast invasive carcinoma | Female | <65 | I/II | Unknown | Unknown | SD | |
| FAS | SNV | Missense_Mutation | novel | c.783G>T | p.Glu261Asp | p.E261D | P25445 | protein_coding | tolerated(0.24) | benign(0.047) | TCGA-2W-A8YY-01 | Cervix | cervical & endocervical cancer | Female | <65 | I/II | Chemotherapy | cisplatin | CR |
| FAS | SNV | Missense_Mutation | c.781N>A | p.Glu261Lys | p.E261K | P25445 | protein_coding | deleterious(0.01) | possibly_damaging(0.807) | TCGA-C5-A1MH-01 | Cervix | cervical & endocervical cancer | Female | >=65 | III/IV | Chemotherapy | cisplatin | PD | |
| FAS | SNV | Missense_Mutation | c.814N>C | p.Glu272Gln | p.E272Q | P25445 | protein_coding | deleterious(0) | probably_damaging(1) | TCGA-C5-A2LZ-01 | Cervix | cervical & endocervical cancer | Female | >=65 | III/IV | Unknown | Unknown | PD | |
| FAS | SNV | Missense_Mutation | c.781N>A | p.Glu261Lys | p.E261K | P25445 | protein_coding | deleterious(0.01) | possibly_damaging(0.807) | TCGA-C5-A8XK-01 | Cervix | cervical & endocervical cancer | Female | <65 | I/II | Chemotherapy | cisplatin | SD | |
| FAS | SNV | Missense_Mutation | c.628N>T | p.His210Tyr | p.H210Y | P25445 | protein_coding | tolerated(1) | benign(0.119) | TCGA-IR-A3LK-01 | Cervix | cervical & endocervical cancer | Female | >=65 | I/II | Chemotherapy | cisplatin | PD | |
| FAS | SNV | Missense_Mutation | c.793G>C | p.Asp265His | p.D265H | P25445 | protein_coding | deleterious(0.02) | benign(0.136) | TCGA-JW-A5VL-01 | Cervix | cervical & endocervical cancer | Female | <65 | I/II | Unknown | Unknown | SD | |
| FAS | SNV | Missense_Mutation | c.781N>A | p.Glu261Lys | p.E261K | P25445 | protein_coding | deleterious(0.01) | possibly_damaging(0.807) | TCGA-LP-A4AV-01 | Cervix | cervical & endocervical cancer | Female | <65 | I/II | Unknown | Unknown | SD | |
| FAS | SNV | Missense_Mutation | rs773565107 | c.340N>A | p.Glu114Lys | p.E114K | P25445 | protein_coding | deleterious(0) | probably_damaging(0.995) | TCGA-CA-6717-01 | Colorectum | colon adenocarcinoma | Male | <65 | I/II | Chemotherapy | oxaliplatin | CR |
| FAS | SNV | Missense_Mutation | c.542T>C | p.Leu181Pro | p.L181P | P25445 | protein_coding | tolerated(0.08) | benign(0.055) | TCGA-CK-4947-01 | Colorectum | colon adenocarcinoma | Female | <65 | III/IV | Other, specify in notes | folinic | SD |
| Page: 1 2 3 4 5 |
Top |
Related drugs of malignant transformation related genes |
| Identification of chemicals and drugs interact with genes involved in malignant transfromation |
| (DGIdb 4.0) |
| Entrez ID | Symbol | Category | Interaction Types | Drug Claim Name | Drug Name | PMIDs |
| 355 | FAS | CELL SURFACE, EXTERNAL SIDE OF PLASMA MEMBRANE, CLINICALLY ACTIONABLE, DRUGGABLE GENOME | MPA | PROGESTERONE | 14659903 | |
| 355 | FAS | CELL SURFACE, EXTERNAL SIDE OF PLASMA MEMBRANE, CLINICALLY ACTIONABLE, DRUGGABLE GENOME | ALL-TRANS RETINOIC ACID | 9792441 | ||
| 355 | FAS | CELL SURFACE, EXTERNAL SIDE OF PLASMA MEMBRANE, CLINICALLY ACTIONABLE, DRUGGABLE GENOME | VALPROIC ACID | 16328060 | ||
| 355 | FAS | CELL SURFACE, EXTERNAL SIDE OF PLASMA MEMBRANE, CLINICALLY ACTIONABLE, DRUGGABLE GENOME | CHOLECALCIFEROL | CHOLECALCIFEROL | 9811059 | |
| 355 | FAS | CELL SURFACE, EXTERNAL SIDE OF PLASMA MEMBRANE, CLINICALLY ACTIONABLE, DRUGGABLE GENOME | TENIPOSIDE | TENIPOSIDE | 9543255 | |
| 355 | FAS | CELL SURFACE, EXTERNAL SIDE OF PLASMA MEMBRANE, CLINICALLY ACTIONABLE, DRUGGABLE GENOME | VESNARINONE | VESNARINONE | 9226479 | |
| 355 | FAS | CELL SURFACE, EXTERNAL SIDE OF PLASMA MEMBRANE, CLINICALLY ACTIONABLE, DRUGGABLE GENOME | CYCLOPHOSPHAMIDE | CYCLOPHOSPHAMIDE | 11437491 | |
| 355 | FAS | CELL SURFACE, EXTERNAL SIDE OF PLASMA MEMBRANE, CLINICALLY ACTIONABLE, DRUGGABLE GENOME | LITHIUM | LITHIUM | 15475000 | |
| 355 | FAS | CELL SURFACE, EXTERNAL SIDE OF PLASMA MEMBRANE, CLINICALLY ACTIONABLE, DRUGGABLE GENOME | ASPIRIN | ASPIRIN | 15200494 | |
| 355 | FAS | CELL SURFACE, EXTERNAL SIDE OF PLASMA MEMBRANE, CLINICALLY ACTIONABLE, DRUGGABLE GENOME | BISPECIFIC ANTIBODY | 11280736 |
| Page: 1 2 3 4 |

Copyright 2023-Present -The University of Texas Health Science Center at Houston |