
|
|||||
|
 | |
| |
| |
| |
| |
| |
|
Gene: DCD |
Gene summary for DCD |
| Gene information | Species | Human | Gene symbol | DCD | Gene ID | 117159 |
| Gene name | dermcidin | |
| Gene Alias | AIDD | |
| Cytomap | 12q13.2 | |
| Gene Type | protein-coding | GO ID | GO:0001906 | UniProtAcc | P81605 |
Top |
Malignant transformation analysis |
| Identification of the aberrant gene expression in precancerous and cancerous lesions by comparing the gene expression of stem-like cells in diseased tissues with normal stem cells |
| Entrez ID | Symbol | Replicates | Species | Organ | Tissue | Adj P-value | Log2FC | Malignancy |
| 117159 | DCD | GSM4909289 | Human | Breast | IDC | 1.61e-13 | 8.75e-01 | 0.1064 |
| 117159 | DCD | GSM4909292 | Human | Breast | IDC | 2.82e-28 | 2.04e+00 | 0.1236 |
| 117159 | DCD | GSM4909294 | Human | Breast | IDC | 3.32e-03 | 2.96e-01 | 0.2022 |
| 117159 | DCD | NCCBC11 | Human | Breast | DCIS | 1.80e-08 | 1.08e+00 | 0.1232 |
| 117159 | DCD | P2 | Human | Breast | IDC | 1.29e-107 | 2.38e+00 | 0.21 |
| 117159 | DCD | GSM6177620_NYU_UCEC1_lib1_lib1 | Human | Endometrium | EEC | 3.51e-21 | 7.45e-01 | -0.1869 |
| 117159 | DCD | GSM6177620_NYU_UCEC1_lib2_lib2 | Human | Endometrium | EEC | 2.13e-10 | 4.65e-01 | -0.1875 |
| 117159 | DCD | GSM6177621_NYU_UCEC2_lib1_lib1 | Human | Endometrium | EEC | 1.49e-22 | 6.80e-01 | -0.1934 |
| 117159 | DCD | GSM6177622_NYU_UCEC3_lib1_lib1 | Human | Endometrium | EEC | 3.99e-06 | 3.01e-01 | -0.1917 |
| Page: 1 |
| Tissue | Expression Dynamics | Abbreviation |
| Breast |  | IDC: Invasive ductal carcinoma |
| DCIS: Ductal carcinoma in situ | ||
| Precancer(BRCA1-mut): Precancerous lesion from BRCA1 mutation carriers | ||
| Endometrium | 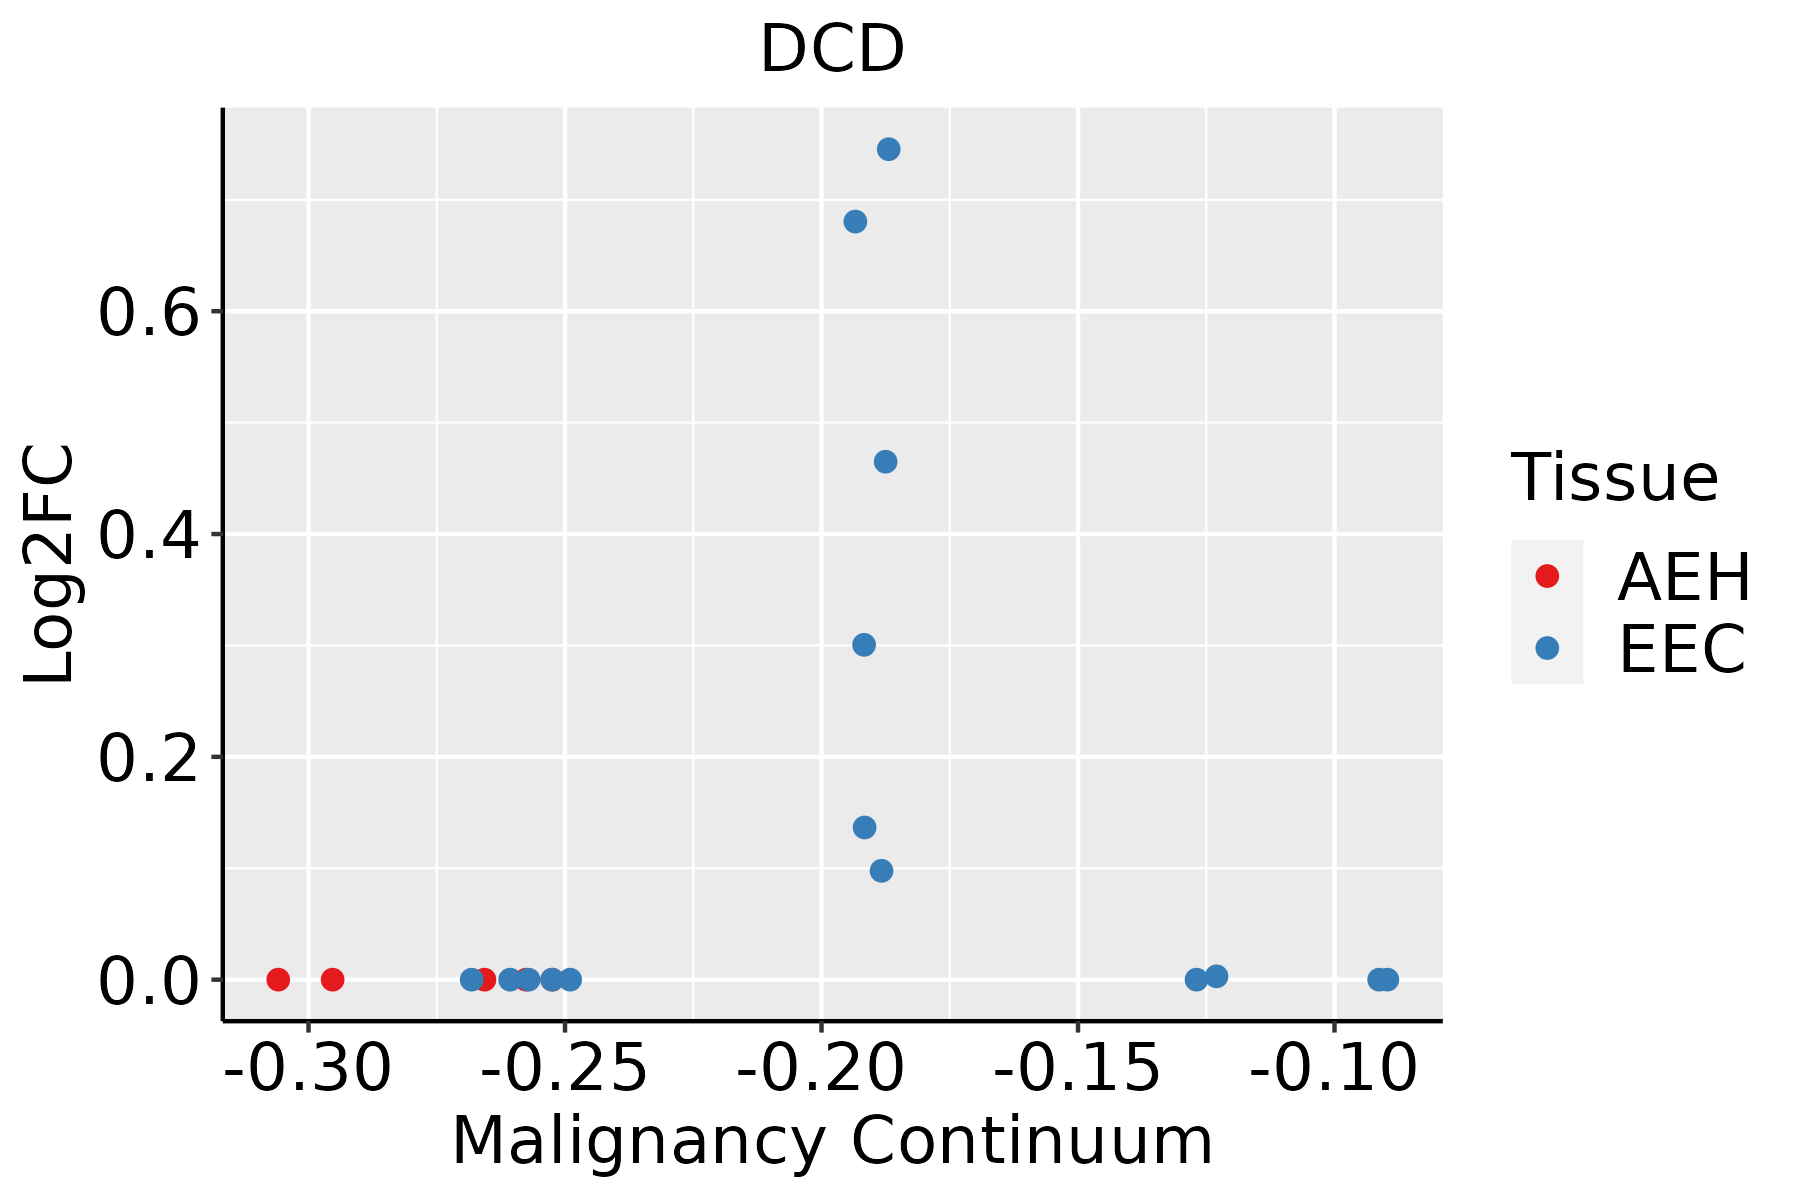 | AEH: Atypical endometrial hyperplasia |
| EEC: Endometrioid Cancer |
| ∗log2FC in expression of this searched gene in stem-like cells from each diseased tissue sample relative to stem-like cells in normal samples in each tissue plotted against the malignancy continuum. Samples are colored based on if they are from different disease stage. |
Top |
Malignant transformation related pathway analysis |
| Find out the enriched GO biological processes and KEGG pathways involved in transition from healthy to precancer to cancer |
| Tissue | Disease Stage | Enriched GO biological Processes |
| Colorectum | AD |  |
| Colorectum | SER |  |
| Colorectum | MSS |  |
| Colorectum | MSI-H |  |
| Colorectum | FAP |  |
| ∗Top 15 enriched GO BP terms are showed in the bar plot of each disease state in each tissue. Each row represents a significant GO biological process which is colored according to the -log10(p.adjust). |
| Page: 1 2 3 4 5 6 7 8 9 |
| GO ID | Tissue | Disease Stage | Description | Gene Ratio | Bg Ratio | pvalue | p.adjust | Count |
| GO:00328721 | Colorectum | MSS | regulation of stress-activated MAPK cascade | 51/3467 | 192/18723 | 3.65e-03 | 2.69e-02 | 51 |
| GO:00435422 | Colorectum | MSS | endothelial cell migration | 70/3467 | 279/18723 | 3.69e-03 | 2.71e-02 | 70 |
| GO:00100382 | Colorectum | MSS | response to metal ion | 90/3467 | 373/18723 | 3.76e-03 | 2.76e-02 | 90 |
| GO:00071781 | Colorectum | MSS | transmembrane receptor protein serine/threonine kinase signaling pathway | 86/3467 | 355/18723 | 4.04e-03 | 2.95e-02 | 86 |
| GO:0048659 | Colorectum | MSS | smooth muscle cell proliferation | 49/3467 | 184/18723 | 4.08e-03 | 2.97e-02 | 49 |
| GO:0048660 | Colorectum | MSS | regulation of smooth muscle cell proliferation | 48/3467 | 180/18723 | 4.32e-03 | 3.07e-02 | 48 |
| GO:00346052 | Colorectum | MSS | cellular response to heat | 22/3467 | 69/18723 | 5.31e-03 | 3.62e-02 | 22 |
| GO:0031929 | Colorectum | MSS | TOR signaling | 35/3467 | 126/18723 | 6.91e-03 | 4.44e-02 | 35 |
| GO:0050678 | Colorectum | MSS | regulation of epithelial cell proliferation | 90/3467 | 381/18723 | 6.92e-03 | 4.45e-02 | 90 |
| GO:0048762 | Colorectum | MSS | mesenchymal cell differentiation | 59/3467 | 236/18723 | 7.79e-03 | 4.84e-02 | 59 |
| GO:00065131 | Colorectum | MSS | protein monoubiquitination | 21/3467 | 67/18723 | 7.90e-03 | 4.84e-02 | 21 |
| GO:00328731 | Colorectum | MSS | negative regulation of stress-activated MAPK cascade | 17/3467 | 51/18723 | 8.28e-03 | 4.99e-02 | 17 |
| GO:00703031 | Colorectum | MSS | negative regulation of stress-activated protein kinase signaling cascade | 17/3467 | 51/18723 | 8.28e-03 | 4.99e-02 | 17 |
| GO:19033203 | Colorectum | MSI-H | regulation of protein modification by small protein conjugation or removal | 43/1319 | 242/18723 | 1.60e-08 | 1.85e-06 | 43 |
| GO:00313963 | Colorectum | MSI-H | regulation of protein ubiquitination | 39/1319 | 210/18723 | 2.12e-08 | 2.36e-06 | 39 |
| GO:00525473 | Colorectum | MSI-H | regulation of peptidase activity | 66/1319 | 461/18723 | 2.63e-08 | 2.81e-06 | 66 |
| GO:00525483 | Colorectum | MSI-H | regulation of endopeptidase activity | 60/1319 | 432/18723 | 3.29e-07 | 2.57e-05 | 60 |
| GO:20001163 | Colorectum | MSI-H | regulation of cysteine-type endopeptidase activity | 36/1319 | 235/18723 | 8.40e-06 | 4.09e-04 | 36 |
| GO:00458623 | Colorectum | MSI-H | positive regulation of proteolysis | 49/1319 | 372/18723 | 1.67e-05 | 7.15e-04 | 49 |
| GO:00432813 | Colorectum | MSI-H | regulation of cysteine-type endopeptidase activity involved in apoptotic process | 31/1319 | 209/18723 | 6.50e-05 | 2.19e-03 | 31 |
| Page: 1 2 3 4 5 6 7 8 9 10 11 12 13 14 15 16 17 18 19 20 21 22 23 24 25 26 27 28 29 30 31 32 33 34 35 36 37 38 39 40 41 42 43 44 45 46 47 48 49 50 51 52 53 54 55 56 57 58 59 60 61 62 63 64 65 66 67 68 69 70 71 72 73 74 75 76 77 78 79 80 81 82 83 84 85 86 87 88 89 90 91 92 93 94 95 96 97 98 99 100 101 102 103 104 105 106 107 108 109 110 111 112 113 114 115 116 117 118 119 120 121 122 123 124 125 126 127 128 129 130 131 132 133 134 135 136 137 138 139 140 141 142 143 144 145 146 147 148 149 150 151 152 153 154 155 156 157 158 159 |
| Pathway ID | Tissue | Disease Stage | Description | Gene Ratio | Bg Ratio | pvalue | p.adjust | qvalue | Count |
| Page: 1 |
Top |
Cell-cell communication analysis |
| Identification of potential cell-cell interactions between two cell types and their ligand-receptor pairs for different disease states |
| Ligand | Receptor | LRpair | Pathway | Tissue | Disease Stage |
| CD274 | PDCD1 | CD274_PDCD1 | PD-L1 | Cervix | CC |
| CD274 | PDCD1 | CD274_PDCD1 | PD-L1 | GC | ADJ |
| Page: 1 |
Top |
Single-cell gene regulatory network inference analysis |
| Find out the significant the regulons (TFs) and the target genes of each regulon across cell types for different disease states |
| TF | Cell Type | Tissue | Disease Stage | Target Gene | RSS | Regulon Activity |
| ∗The dot plots of a searched regulon are shown for all cell subpopulations in each disease state of each tissue based on the regulon specific score inferred using pySCENIC and by calculating the average expression. |
| Page: 1 |
Top |
Somatic mutation of malignant transformation related genes |
| Annotation of somatic variants for genes involved in malignant transformation |
| Hugo Symbol | Variant Class | Variant Classification | dbSNP RS | HGVSc | HGVSp | HGVSp Short | SWISSPROT | BIOTYPE | SIFT | PolyPhen | Tumor Sample Barcode | Tissue | Histology | Sex | Age | Stage | Therapy Types | Drugs | Outcome |
| DCD | SNV | Missense_Mutation | c.151N>A | p.Leu51Ile | p.L51I | P81605 | protein_coding | tolerated_low_confidence(0.18) | possibly_damaging(0.87) | TCGA-D8-A1XM-01 | Breast | breast invasive carcinoma | Female | <65 | I/II | Unknown | Unknown | SD | |
| DCD | SNV | Missense_Mutation | novel | c.298N>C | p.Glu100Gln | p.E100Q | P81605 | protein_coding | deleterious_low_confidence(0) | benign(0.322) | TCGA-4J-AA1J-01 | Cervix | cervical & endocervical cancer | Female | <65 | I/II | Unknown | Unknown | SD |
| DCD | SNV | Missense_Mutation | c.10A>G | p.Met4Val | p.M4V | P81605 | protein_coding | deleterious_low_confidence(0) | benign(0.075) | TCGA-AA-A02R-01 | Colorectum | colon adenocarcinoma | Female | >=65 | I/II | Unknown | Unknown | PD | |
| DCD | SNV | Missense_Mutation | novel | c.125A>C | p.Lys42Thr | p.K42T | P81605 | protein_coding | tolerated_low_confidence(0.1) | benign(0.017) | TCGA-AX-A3FT-01 | Endometrium | uterine corpus endometrioid carcinoma | Female | <65 | I/II | Unknown | Unknown | SD |
| DCD | SNV | Missense_Mutation | c.71N>T | p.Ala24Val | p.A24V | P81605 | protein_coding | tolerated_low_confidence(0.47) | possibly_damaging(0.905) | TCGA-B5-A11E-01 | Endometrium | uterine corpus endometrioid carcinoma | Female | <65 | I/II | Unknown | Unknown | SD | |
| DCD | SNV | Missense_Mutation | rs190416576 | c.265N>A | p.Glu89Lys | p.E89K | P81605 | protein_coding | deleterious_low_confidence(0.05) | benign(0.006) | TCGA-D1-A17Q-01 | Endometrium | uterine corpus endometrioid carcinoma | Female | <65 | I/II | Unknown | Unknown | SD |
| DCD | SNV | Missense_Mutation | c.73N>T | p.Ala25Ser | p.A25S | P81605 | protein_coding | tolerated_low_confidence(0.17) | probably_damaging(0.998) | TCGA-FV-A2QQ-01 | Liver | liver hepatocellular carcinoma | Male | >=65 | I/II | Unknown | Unknown | SD | |
| DCD | SNV | Missense_Mutation | c.97C>A | p.Pro33Thr | p.P33T | P81605 | protein_coding | tolerated_low_confidence(0.52) | benign(0.231) | TCGA-MI-A75G-01 | Liver | liver hepatocellular carcinoma | Male | <65 | I/II | Unknown | Unknown | SD | |
| DCD | SNV | Missense_Mutation | c.149G>A | p.Gly50Glu | p.G50E | P81605 | protein_coding | tolerated_low_confidence(0.49) | benign(0.367) | TCGA-55-1595-01 | Lung | lung adenocarcinoma | Female | >=65 | I/II | Unknown | Unknown | SD | |
| DCD | SNV | Missense_Mutation | c.230N>C | p.Val77Ala | p.V77A | P81605 | protein_coding | deleterious_low_confidence(0.02) | benign(0) | TCGA-55-A4DF-01 | Lung | lung adenocarcinoma | Male | >=65 | I/II | Unknown | Unknown | PD |
| Page: 1 2 |
Top |
Related drugs of malignant transformation related genes |
| Identification of chemicals and drugs interact with genes involved in malignant transfromation |
| (DGIdb 4.0) |
| Entrez ID | Symbol | Category | Interaction Types | Drug Claim Name | Drug Name | PMIDs |
| Page: 1 |

Copyright 2023-Present -The University of Texas Health Science Center at Houston |