
|
|||||
|
 | |
| |
| |
| |
| |
| |
|
Gene: CTSH |
Gene summary for CTSH |
| Gene information | Species | Human | Gene symbol | CTSH | Gene ID | 1512 |
| Gene name | cathepsin H | |
| Gene Alias | ACC-4 | |
| Cytomap | 15q25.1 | |
| Gene Type | protein-coding | GO ID | GO:0000165 | UniProtAcc | P09668 |
Top |
Malignant transformation analysis |
| Identification of the aberrant gene expression in precancerous and cancerous lesions by comparing the gene expression of stem-like cells in diseased tissues with normal stem cells |
| Entrez ID | Symbol | Replicates | Species | Organ | Tissue | Adj P-value | Log2FC | Malignancy |
| 1512 | CTSH | GSM4909282 | Human | Breast | IDC | 1.97e-11 | 4.21e-01 | -0.0288 |
| 1512 | CTSH | GSM4909291 | Human | Breast | IDC | 2.29e-10 | 4.99e-01 | 0.1753 |
| 1512 | CTSH | GSM4909304 | Human | Breast | IDC | 3.07e-02 | -1.28e-01 | 0.1636 |
| 1512 | CTSH | GSM4909305 | Human | Breast | IDC | 2.23e-05 | 3.15e-01 | 0.0436 |
| 1512 | CTSH | GSM4909306 | Human | Breast | IDC | 3.34e-03 | 2.95e-01 | 0.1564 |
| 1512 | CTSH | GSM4909311 | Human | Breast | IDC | 3.27e-05 | -2.05e-02 | 0.1534 |
| 1512 | CTSH | GSM4909319 | Human | Breast | IDC | 3.46e-08 | -8.06e-02 | 0.1563 |
| 1512 | CTSH | GSM4909321 | Human | Breast | IDC | 2.87e-03 | 2.24e-01 | 0.1559 |
| 1512 | CTSH | NCCBC11 | Human | Breast | DCIS | 9.89e-03 | 4.69e-01 | 0.1232 |
| 1512 | CTSH | NCCBC14 | Human | Breast | DCIS | 3.87e-04 | 2.46e-01 | 0.2021 |
| 1512 | CTSH | NCCBC3 | Human | Breast | DCIS | 2.42e-12 | 5.40e-01 | 0.1198 |
| 1512 | CTSH | NCCBC5 | Human | Breast | DCIS | 1.50e-09 | 4.71e-01 | 0.2046 |
| 1512 | CTSH | DCIS2 | Human | Breast | DCIS | 4.62e-54 | 2.55e-01 | 0.0085 |
| 1512 | CTSH | CA_HPV_1 | Human | Cervix | CC | 6.80e-03 | 2.50e-01 | 0.0264 |
| 1512 | CTSH | CA_HPV_3 | Human | Cervix | CC | 1.08e-04 | -2.50e-02 | 0.0414 |
| 1512 | CTSH | N_HPV_2 | Human | Cervix | N_HPV | 1.89e-03 | 1.07e-01 | -0.0131 |
| 1512 | CTSH | CCI_2 | Human | Cervix | CC | 1.06e-04 | -5.88e-01 | 0.5249 |
| 1512 | CTSH | CCI_3 | Human | Cervix | CC | 1.14e-06 | -5.70e-01 | 0.516 |
| 1512 | CTSH | CCII_1 | Human | Cervix | CC | 9.97e-03 | -3.90e-01 | 0.3249 |
| 1512 | CTSH | Tumor | Human | Cervix | CC | 2.81e-06 | 1.33e-01 | 0.1241 |
| Page: 1 2 3 4 5 6 7 8 9 10 11 |
| Tissue | Expression Dynamics | Abbreviation |
| Breast | 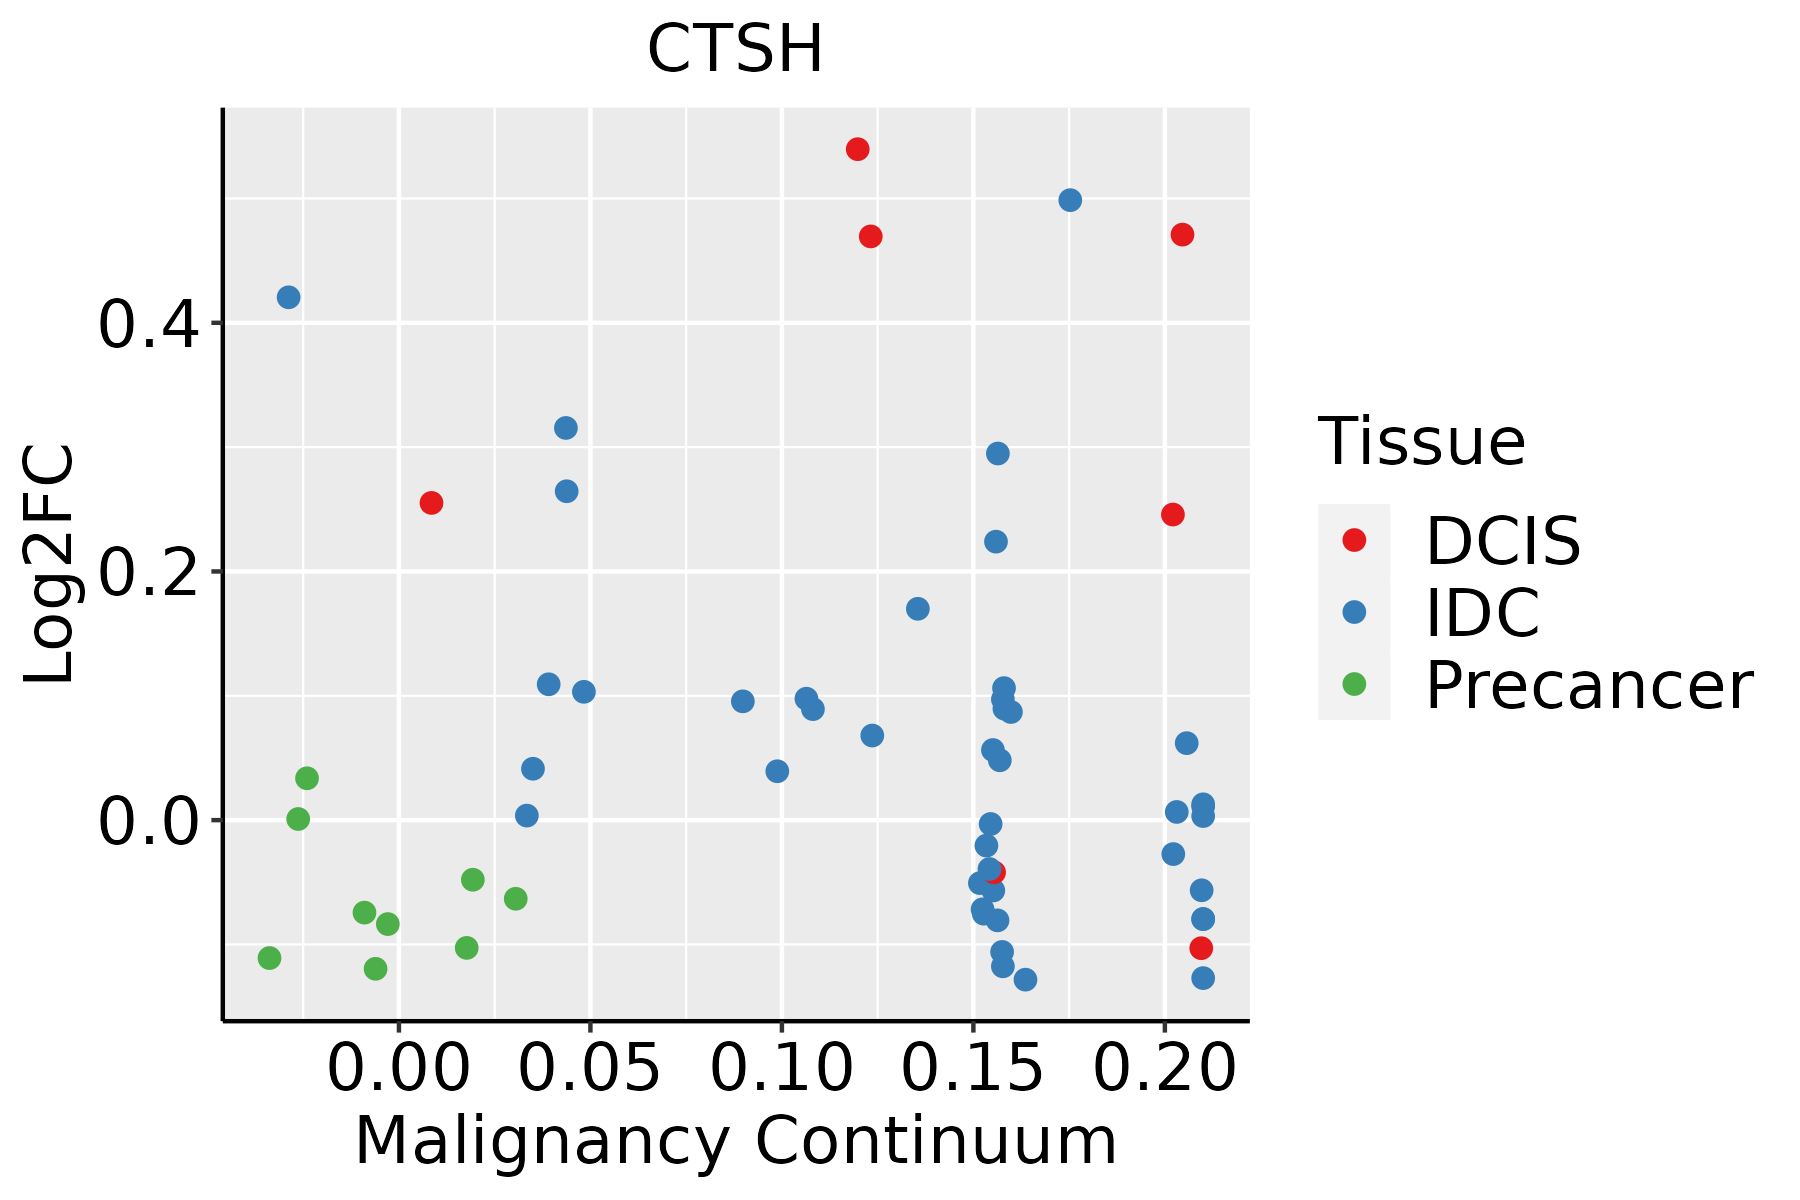 | IDC: Invasive ductal carcinoma |
| DCIS: Ductal carcinoma in situ | ||
| Precancer(BRCA1-mut): Precancerous lesion from BRCA1 mutation carriers | ||
| Cervix | 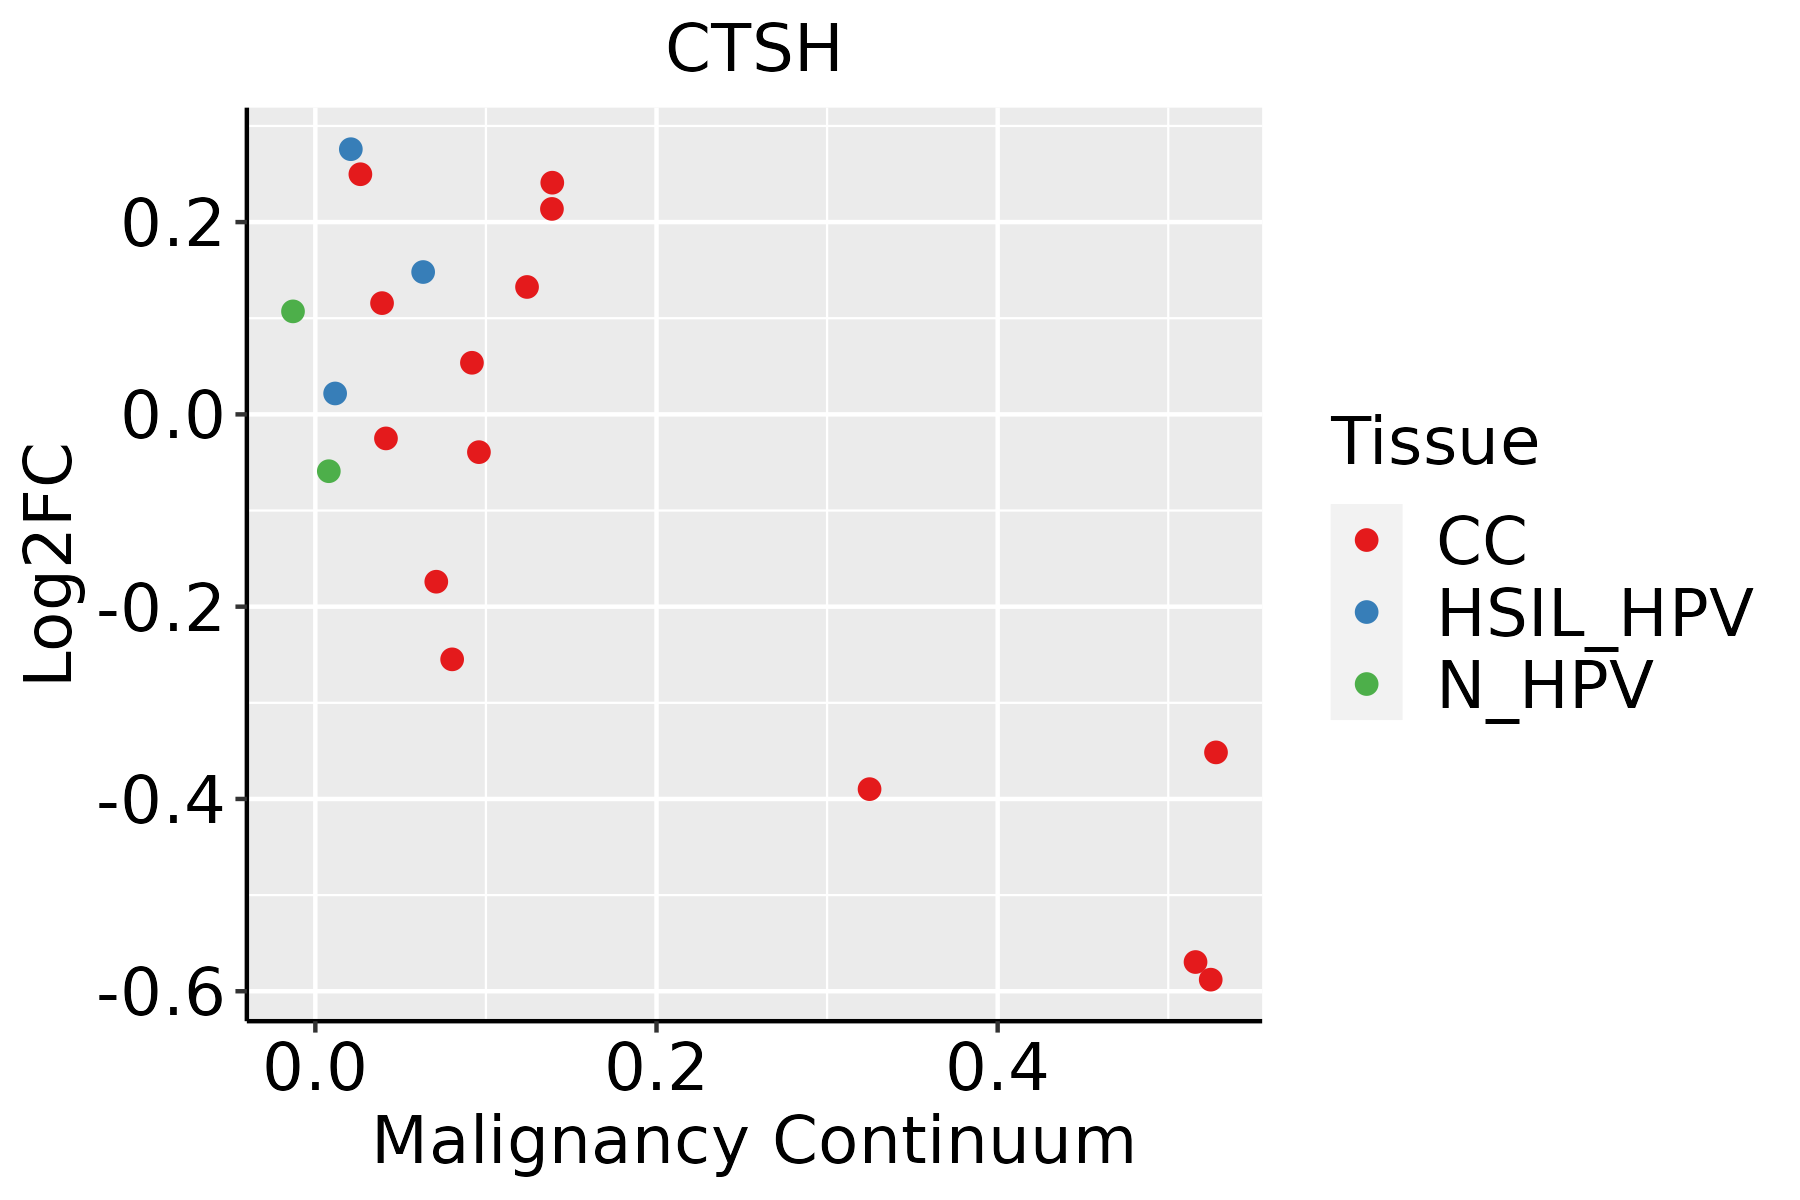 | CC: Cervix cancer |
| HSIL_HPV: HPV-infected high-grade squamous intraepithelial lesions | ||
| N_HPV: HPV-infected normal cervix | ||
| Colorectum (GSE201348) | 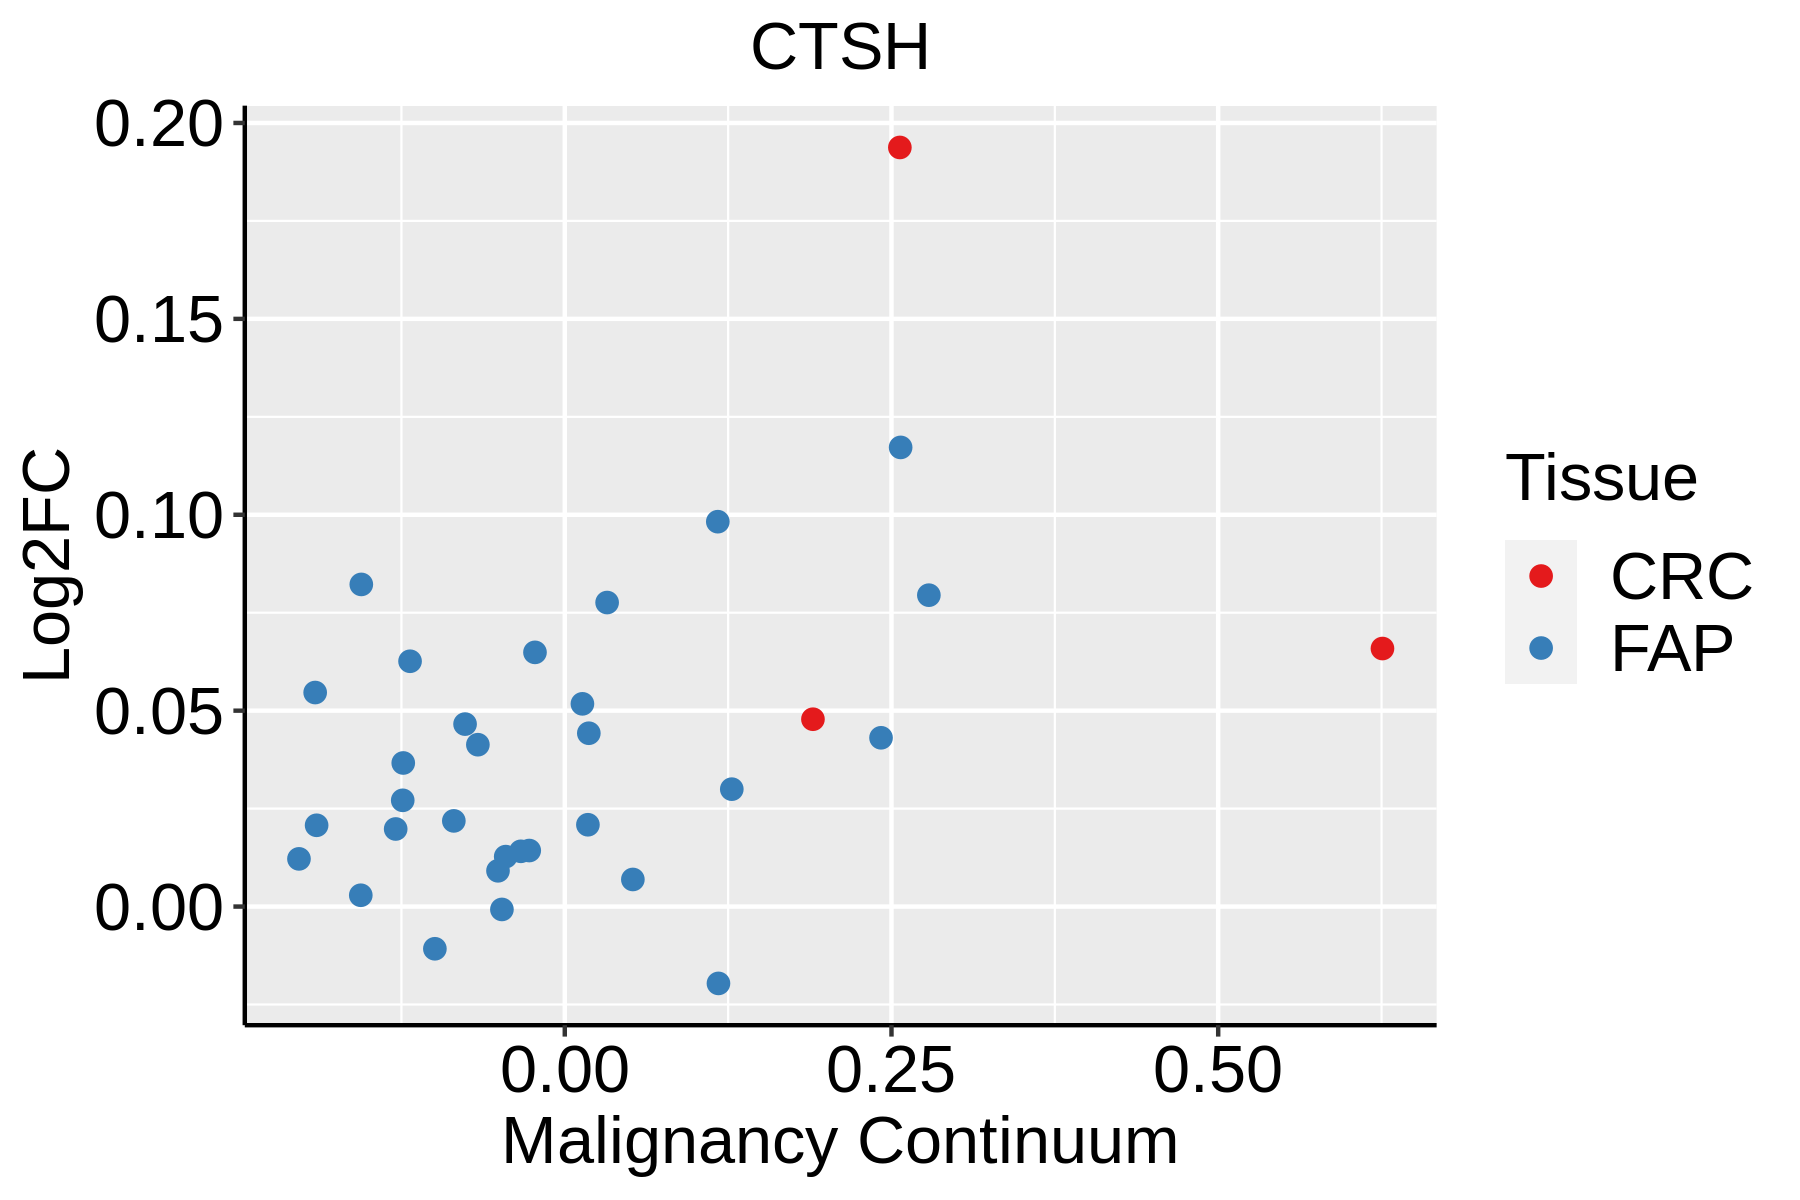 | FAP: Familial adenomatous polyposis |
| CRC: Colorectal cancer | ||
| Colorectum (HTA11) | 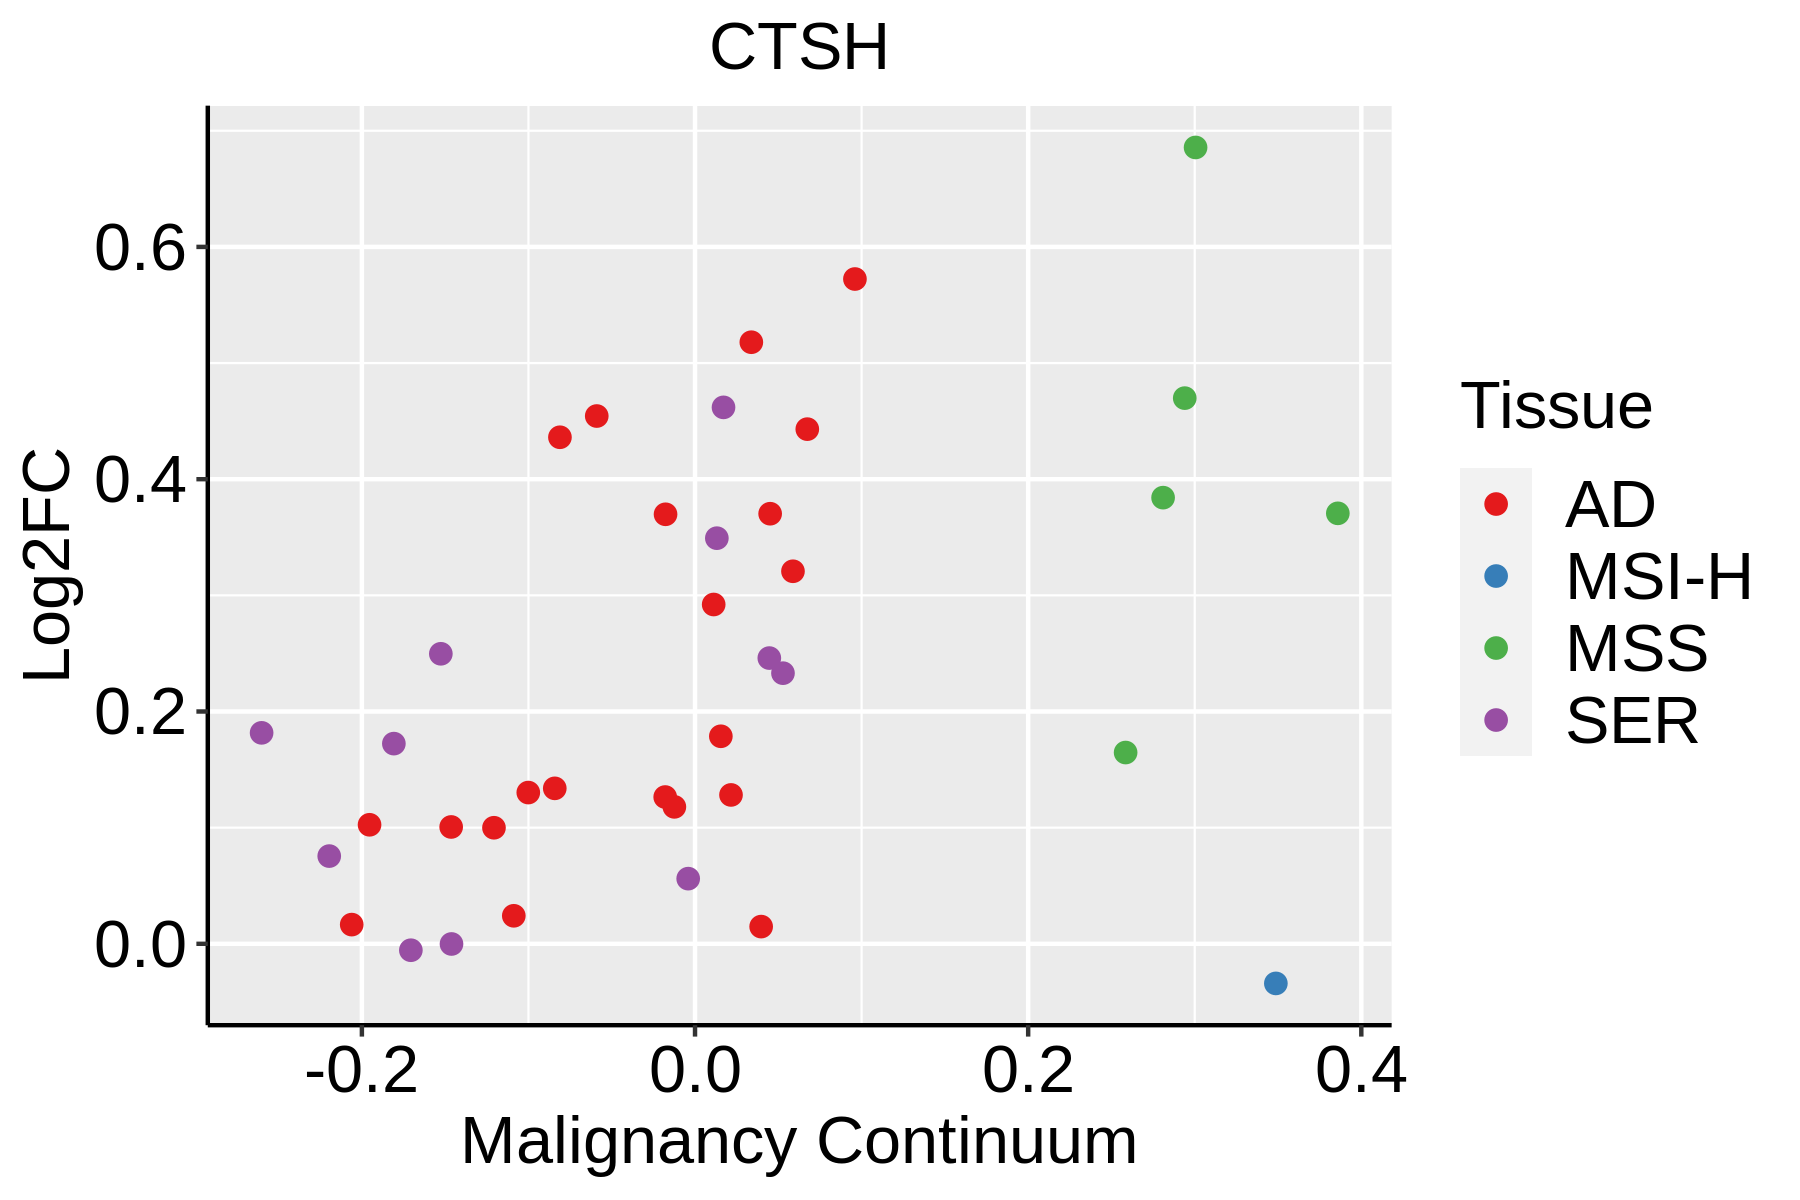 | AD: Adenomas |
| SER: Sessile serrated lesions | ||
| MSI-H: Microsatellite-high colorectal cancer | ||
| MSS: Microsatellite stable colorectal cancer | ||
| Endometrium | 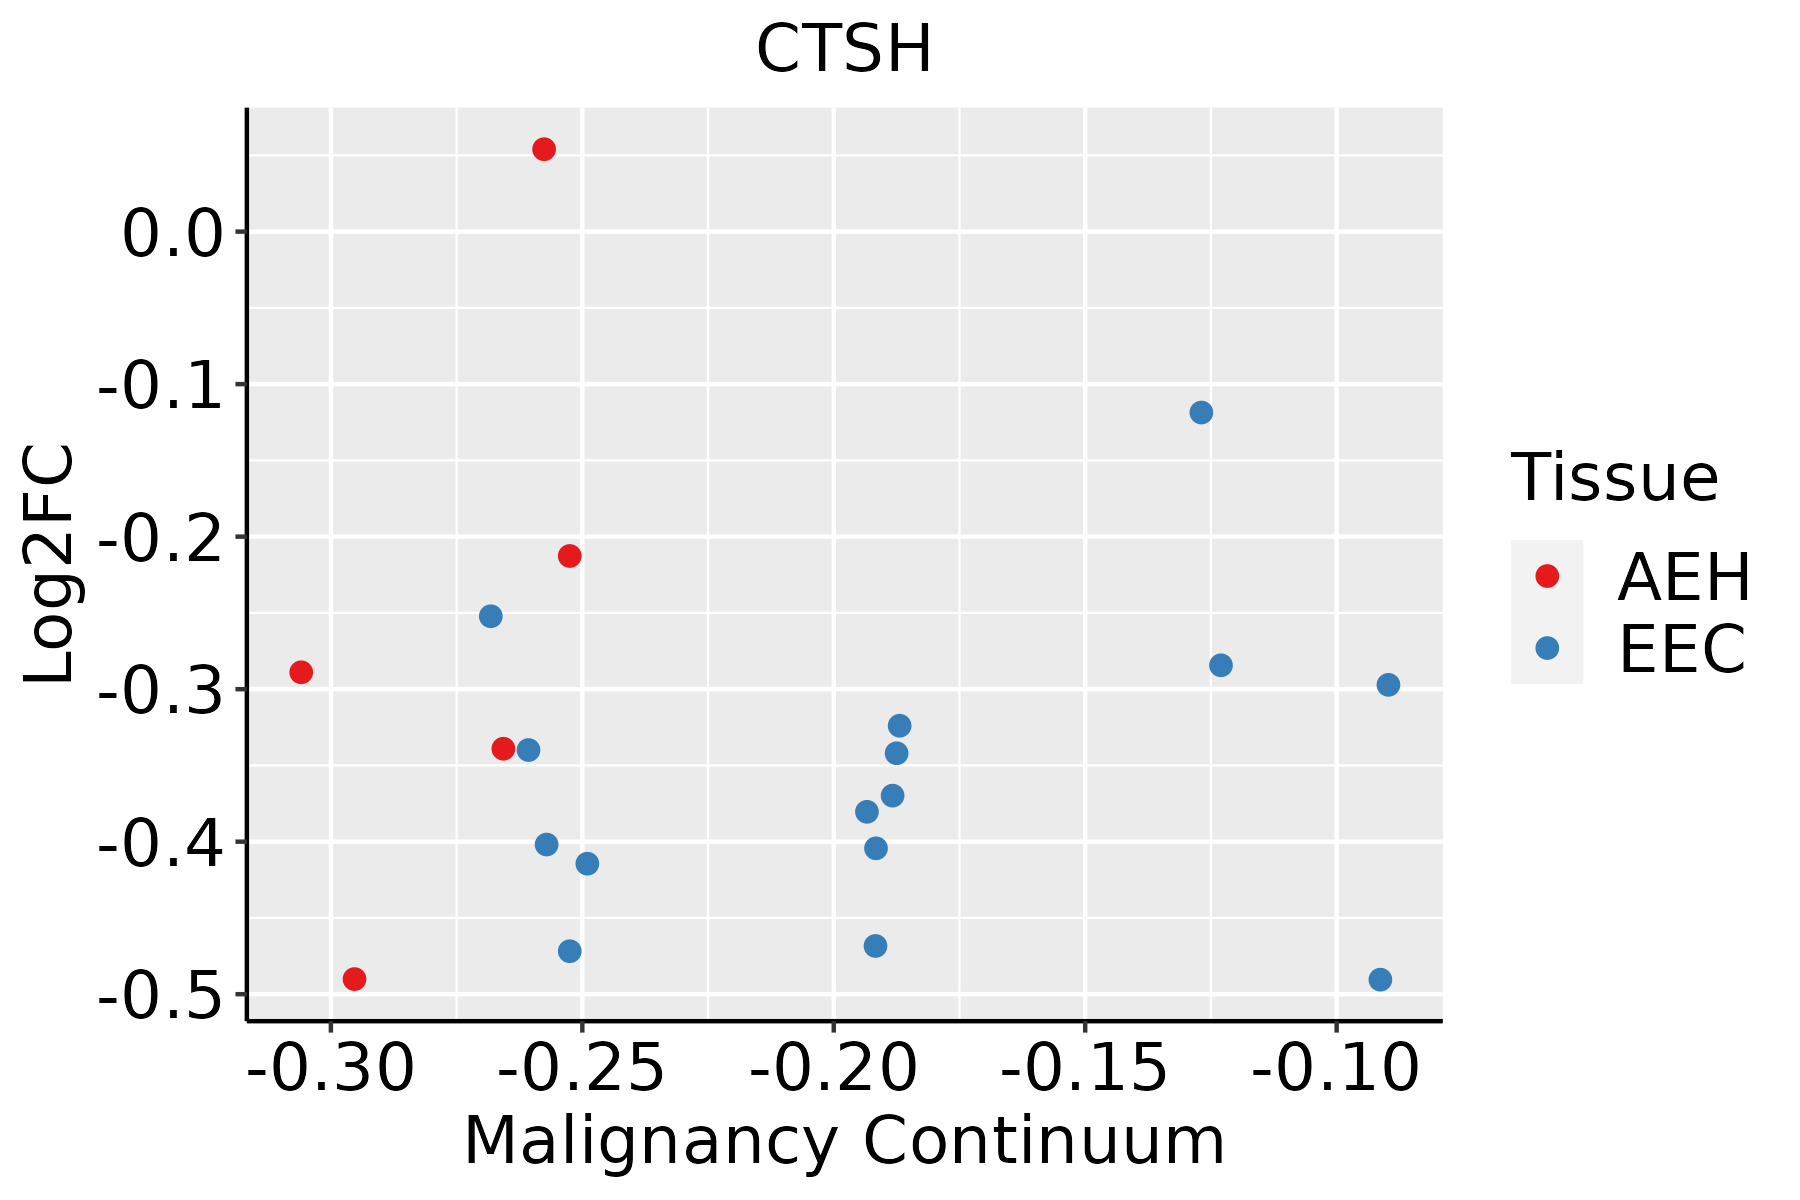 | AEH: Atypical endometrial hyperplasia |
| EEC: Endometrioid Cancer | ||
| Esophagus | 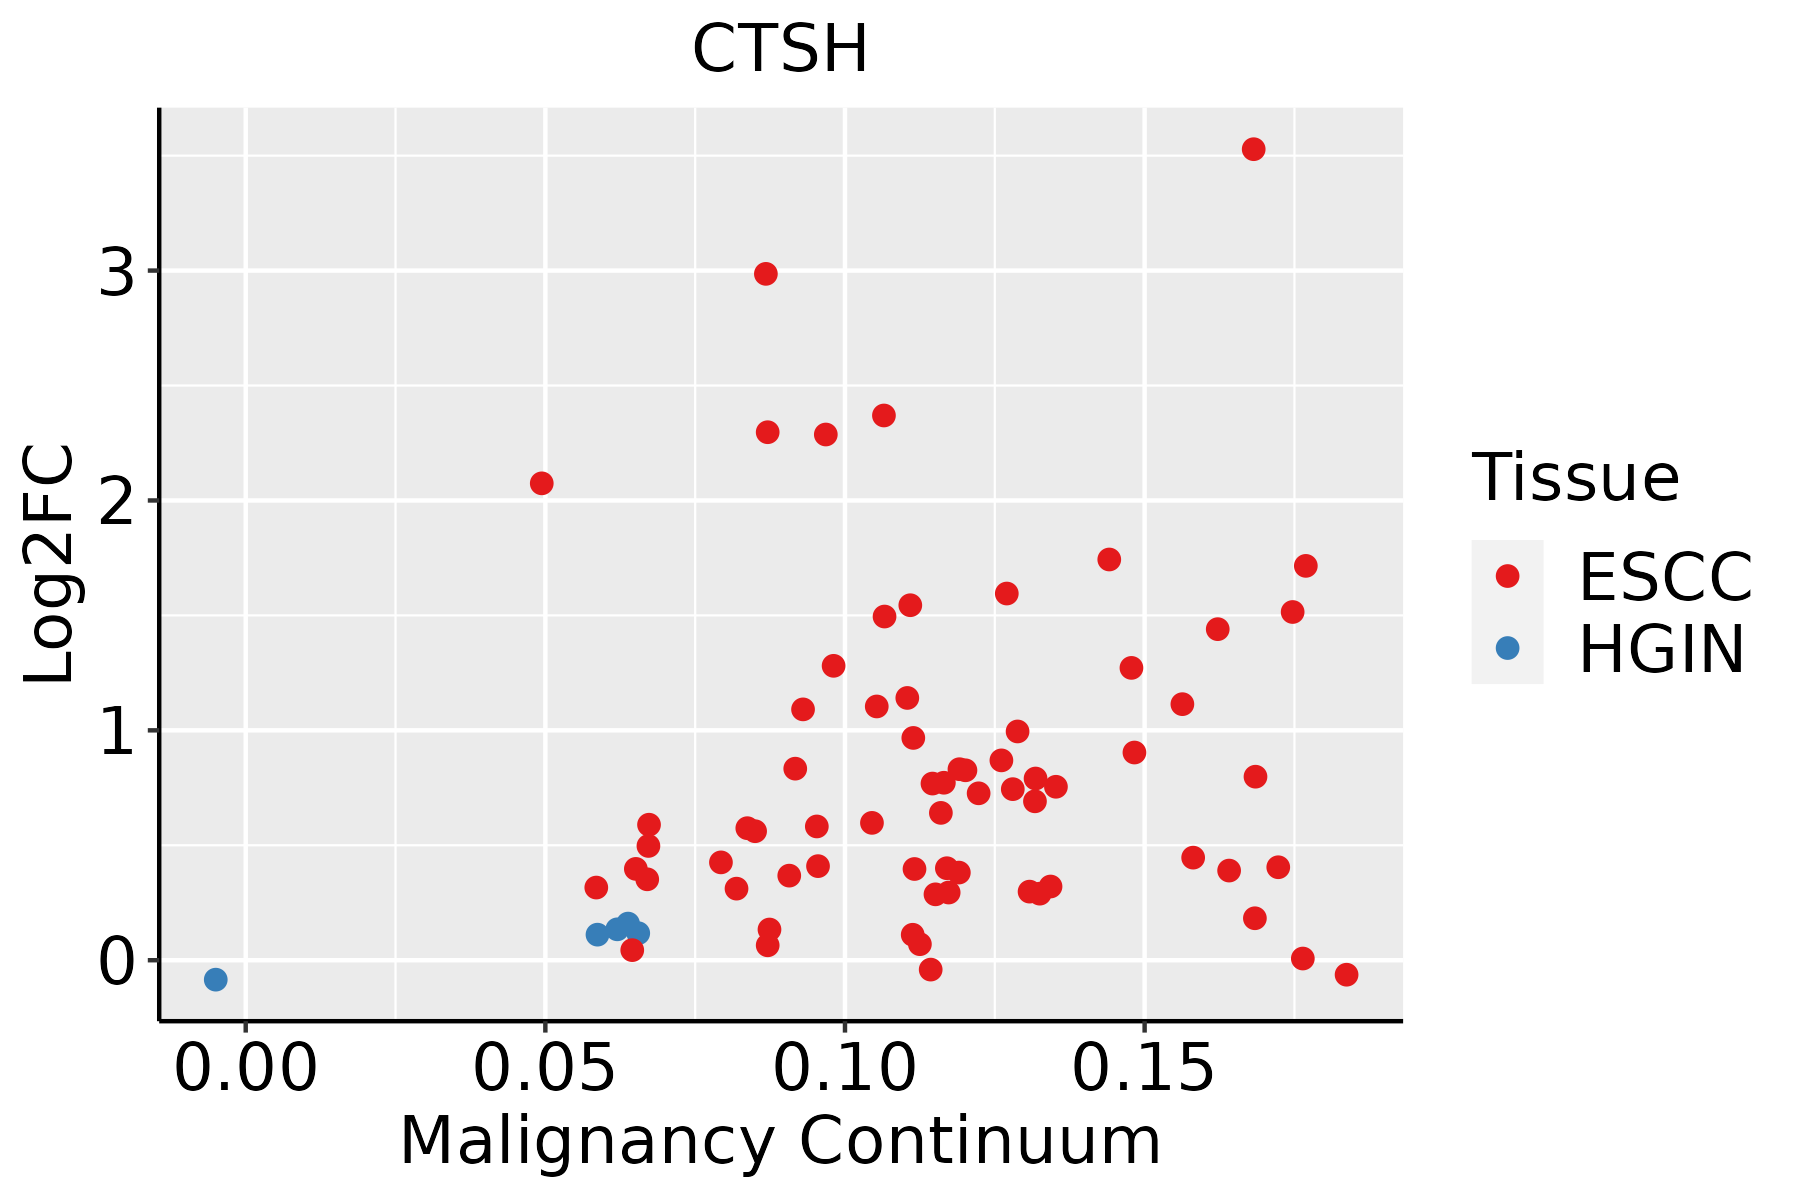 | ESCC: Esophageal squamous cell carcinoma |
| HGIN: High-grade intraepithelial neoplasias | ||
| LGIN: Low-grade intraepithelial neoplasias | ||
| Liver |  | HCC: Hepatocellular carcinoma |
| NAFLD: Non-alcoholic fatty liver disease | ||
| Lung |  | AAH: Atypical adenomatous hyperplasia |
| AIS: Adenocarcinoma in situ | ||
| IAC: Invasive lung adenocarcinoma | ||
| MIA: Minimally invasive adenocarcinoma | ||
| Oral Cavity |  | EOLP: Erosive Oral lichen planus |
| LP: leukoplakia | ||
| NEOLP: Non-erosive oral lichen planus | ||
| OSCC: Oral squamous cell carcinoma | ||
| Prostate | 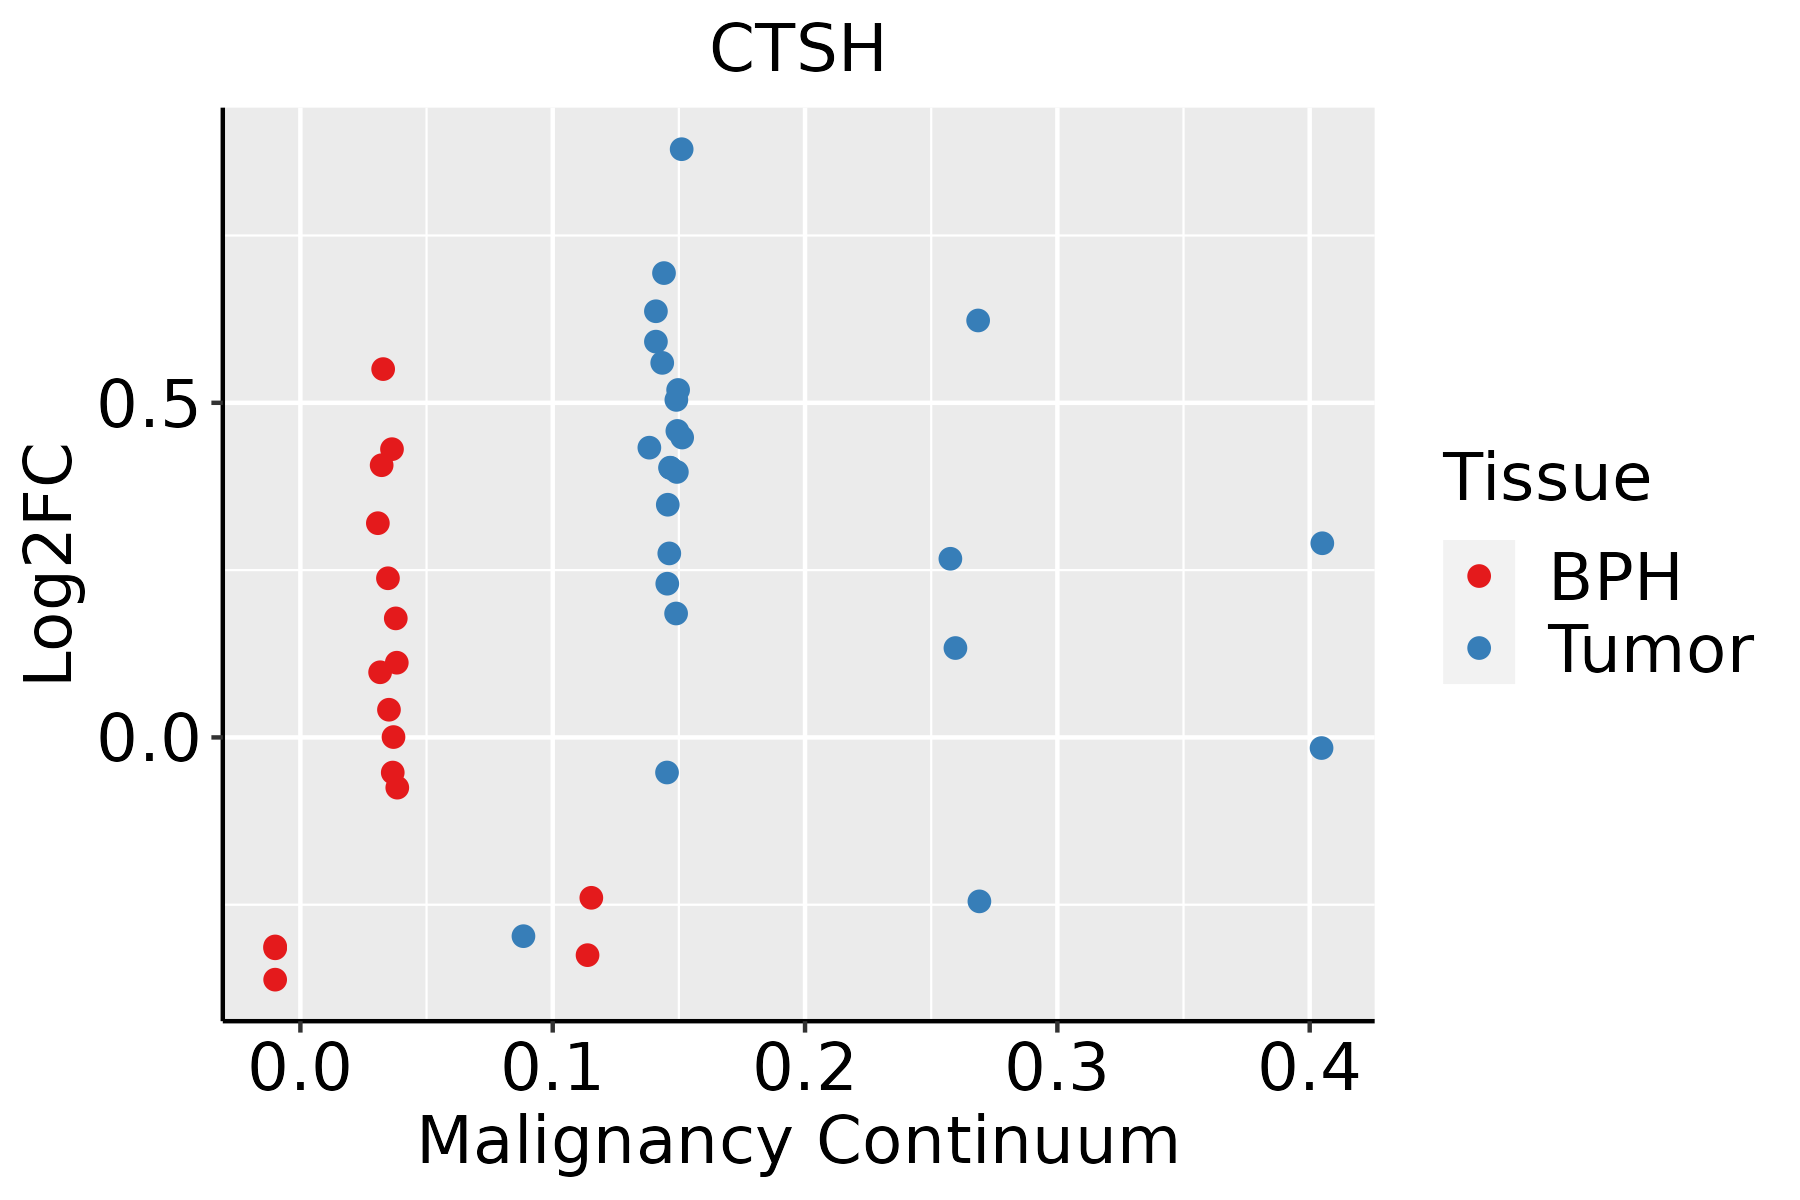 | BPH: Benign Prostatic Hyperplasia |
| Thyroid | 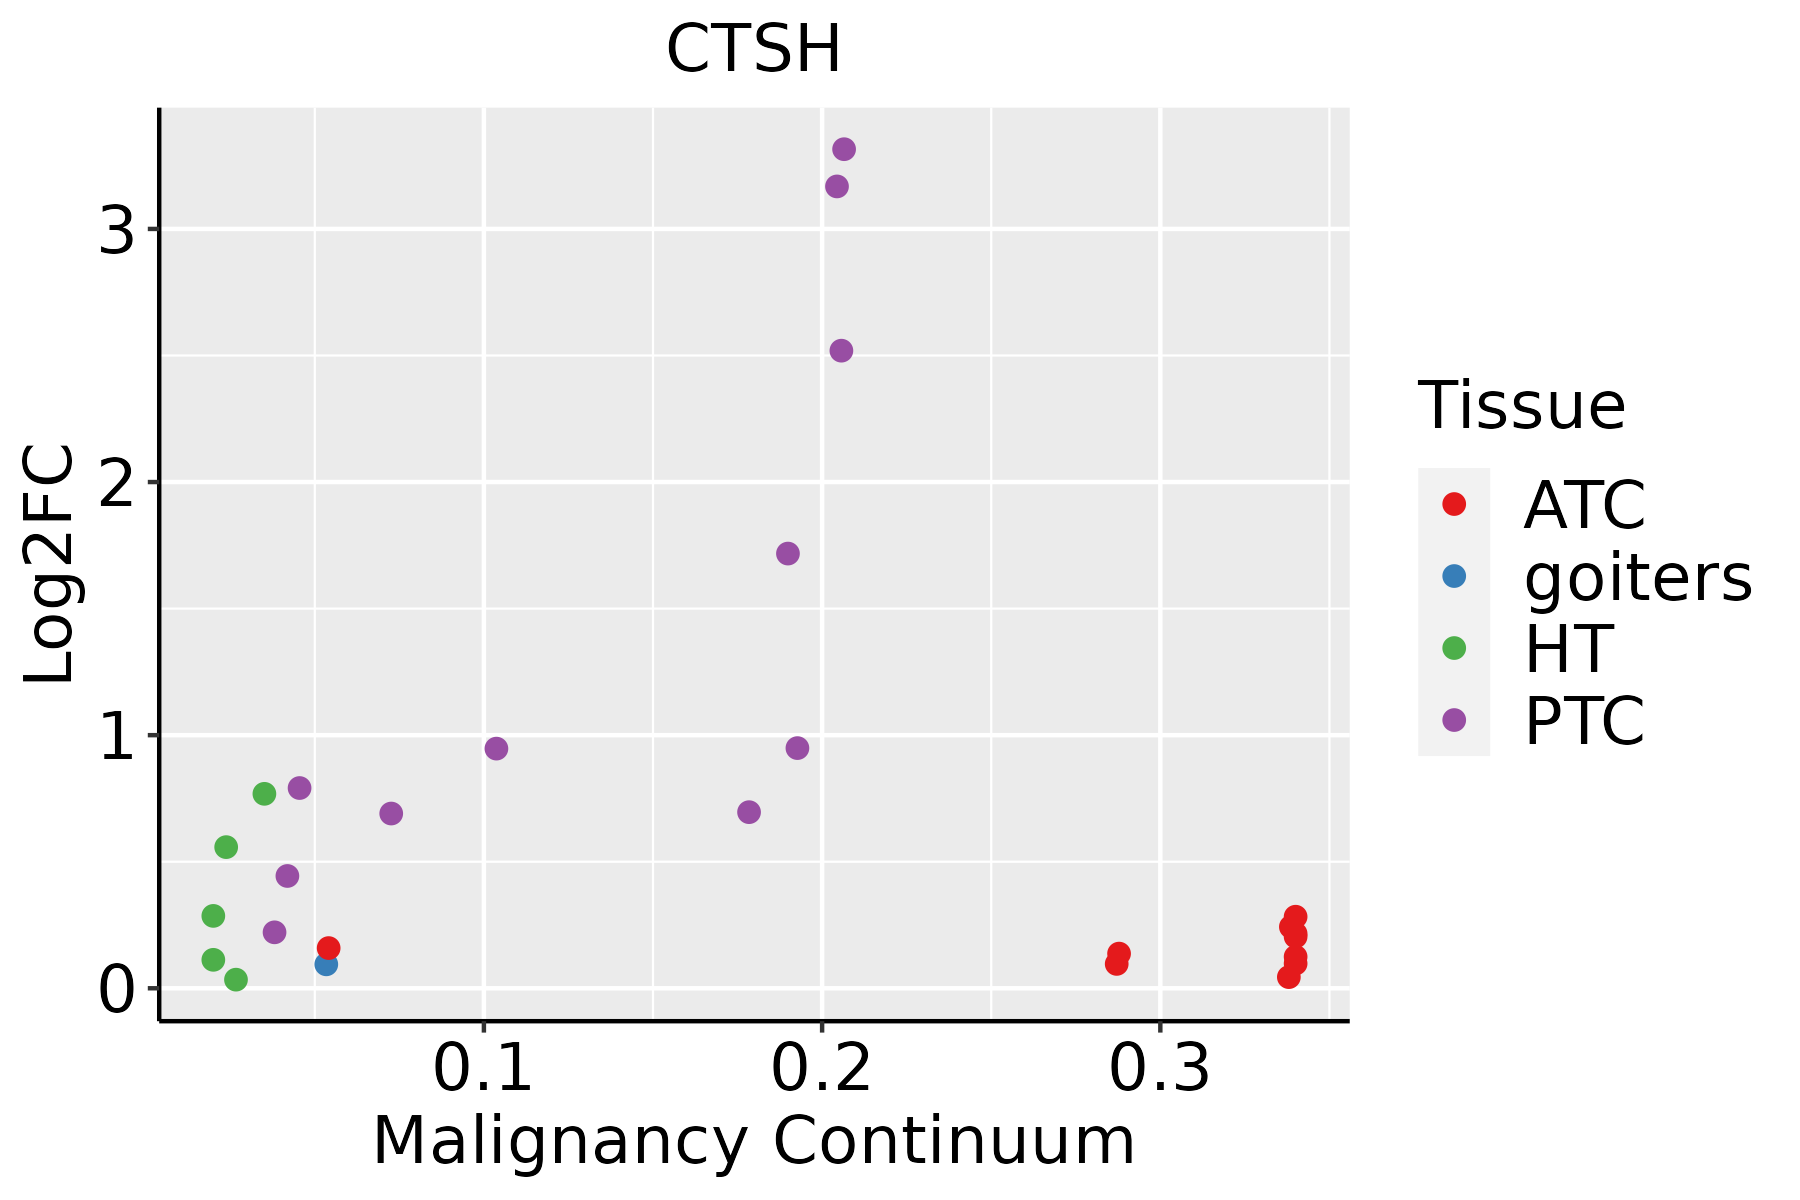 | ATC: Anaplastic thyroid cancer |
| HT: Hashimoto's thyroiditis | ||
| PTC: Papillary thyroid cancer |
| ∗log2FC in expression of this searched gene in stem-like cells from each diseased tissue sample relative to stem-like cells in normal samples in each tissue plotted against the malignancy continuum. Samples are colored based on if they are from different disease stage. |
Top |
Malignant transformation related pathway analysis |
| Find out the enriched GO biological processes and KEGG pathways involved in transition from healthy to precancer to cancer |
| Tissue | Disease Stage | Enriched GO biological Processes |
| Colorectum | AD |  |
| Colorectum | SER |  |
| Colorectum | MSS |  |
| Colorectum | MSI-H |  |
| Colorectum | FAP |  |
| ∗Top 15 enriched GO BP terms are showed in the bar plot of each disease state in each tissue. Each row represents a significant GO biological process which is colored according to the -log10(p.adjust). |
| Page: 1 2 3 4 5 6 7 8 9 |
| GO ID | Tissue | Disease Stage | Description | Gene Ratio | Bg Ratio | pvalue | p.adjust | Count |
| GO:006042513 | Oral cavity | LP | lung morphogenesis | 22/4623 | 50/18723 | 2.18e-03 | 1.58e-02 | 22 |
| GO:200123318 | Prostate | BPH | regulation of apoptotic signaling pathway | 134/3107 | 356/18723 | 5.06e-22 | 7.84e-19 | 134 |
| GO:003164718 | Prostate | BPH | regulation of protein stability | 111/3107 | 298/18723 | 4.58e-18 | 1.42e-15 | 111 |
| GO:004586218 | Prostate | BPH | positive regulation of proteolysis | 121/3107 | 372/18723 | 2.05e-14 | 2.44e-12 | 121 |
| GO:005254718 | Prostate | BPH | regulation of peptidase activity | 133/3107 | 461/18723 | 2.08e-11 | 1.43e-09 | 133 |
| GO:20012359 | Prostate | BPH | positive regulation of apoptotic signaling pathway | 50/3107 | 126/18723 | 5.08e-10 | 2.56e-08 | 50 |
| GO:004328118 | Prostate | BPH | regulation of cysteine-type endopeptidase activity involved in apoptotic process | 71/3107 | 209/18723 | 5.88e-10 | 2.89e-08 | 71 |
| GO:005254818 | Prostate | BPH | regulation of endopeptidase activity | 122/3107 | 432/18723 | 6.10e-10 | 2.91e-08 | 122 |
| GO:200011618 | Prostate | BPH | regulation of cysteine-type endopeptidase activity | 76/3107 | 235/18723 | 1.90e-09 | 7.79e-08 | 76 |
| GO:009013216 | Prostate | BPH | epithelium migration | 104/3107 | 360/18723 | 2.96e-09 | 1.15e-07 | 104 |
| GO:009013016 | Prostate | BPH | tissue migration | 105/3107 | 365/18723 | 3.21e-09 | 1.24e-07 | 105 |
| GO:001063116 | Prostate | BPH | epithelial cell migration | 103/3107 | 357/18723 | 3.80e-09 | 1.44e-07 | 103 |
| GO:001095218 | Prostate | BPH | positive regulation of peptidase activity | 66/3107 | 197/18723 | 4.44e-09 | 1.66e-07 | 66 |
| GO:000166717 | Prostate | BPH | ameboidal-type cell migration | 128/3107 | 475/18723 | 5.69e-09 | 2.05e-07 | 128 |
| GO:001063216 | Prostate | BPH | regulation of epithelial cell migration | 87/3107 | 292/18723 | 1.18e-08 | 3.87e-07 | 87 |
| GO:001063416 | Prostate | BPH | positive regulation of epithelial cell migration | 57/3107 | 176/18723 | 1.82e-07 | 4.04e-06 | 57 |
| GO:00017638 | Prostate | BPH | morphogenesis of a branching structure | 61/3107 | 196/18723 | 3.33e-07 | 7.06e-06 | 61 |
| GO:001095017 | Prostate | BPH | positive regulation of endopeptidase activity | 56/3107 | 179/18723 | 8.24e-07 | 1.54e-05 | 56 |
| GO:00611385 | Prostate | BPH | morphogenesis of a branching epithelium | 56/3107 | 182/18723 | 1.48e-06 | 2.56e-05 | 56 |
| GO:00605628 | Prostate | BPH | epithelial tube morphogenesis | 87/3107 | 325/18723 | 2.05e-06 | 3.39e-05 | 87 |
| Page: 1 2 3 4 5 6 7 8 9 10 11 12 13 14 15 16 17 18 19 20 21 22 23 24 25 26 27 28 29 30 31 32 33 34 35 36 37 38 39 |
| Pathway ID | Tissue | Disease Stage | Description | Gene Ratio | Bg Ratio | pvalue | p.adjust | qvalue | Count |
| hsa0421022 | Breast | IDC | Apoptosis | 31/867 | 136/8465 | 1.34e-05 | 1.61e-04 | 1.20e-04 | 31 |
| hsa0421032 | Breast | IDC | Apoptosis | 31/867 | 136/8465 | 1.34e-05 | 1.61e-04 | 1.20e-04 | 31 |
| hsa0421041 | Breast | DCIS | Apoptosis | 29/846 | 136/8465 | 5.92e-05 | 5.97e-04 | 4.40e-04 | 29 |
| hsa0421051 | Breast | DCIS | Apoptosis | 29/846 | 136/8465 | 5.92e-05 | 5.97e-04 | 4.40e-04 | 29 |
| hsa042109 | Cervix | CC | Apoptosis | 36/1267 | 136/8465 | 3.21e-04 | 1.68e-03 | 9.91e-04 | 36 |
| hsa0421014 | Cervix | CC | Apoptosis | 36/1267 | 136/8465 | 3.21e-04 | 1.68e-03 | 9.91e-04 | 36 |
| hsa0421023 | Cervix | HSIL_HPV | Apoptosis | 16/459 | 136/8465 | 2.74e-03 | 1.78e-02 | 1.44e-02 | 16 |
| hsa0421033 | Cervix | HSIL_HPV | Apoptosis | 16/459 | 136/8465 | 2.74e-03 | 1.78e-02 | 1.44e-02 | 16 |
| hsa0421042 | Cervix | N_HPV | Apoptosis | 14/349 | 136/8465 | 1.40e-03 | 9.06e-03 | 7.08e-03 | 14 |
| hsa0421052 | Cervix | N_HPV | Apoptosis | 14/349 | 136/8465 | 1.40e-03 | 9.06e-03 | 7.08e-03 | 14 |
| hsa04142 | Colorectum | SER | Lysosome | 38/1580 | 132/8465 | 2.87e-03 | 2.03e-02 | 1.47e-02 | 38 |
| hsa041421 | Colorectum | SER | Lysosome | 38/1580 | 132/8465 | 2.87e-03 | 2.03e-02 | 1.47e-02 | 38 |
| hsa04210 | Colorectum | MSS | Apoptosis | 44/1875 | 136/8465 | 3.66e-03 | 1.66e-02 | 1.01e-02 | 44 |
| hsa042101 | Colorectum | MSS | Apoptosis | 44/1875 | 136/8465 | 3.66e-03 | 1.66e-02 | 1.01e-02 | 44 |
| hsa0421010 | Endometrium | AEH | Apoptosis | 30/1197 | 136/8465 | 7.72e-03 | 4.05e-02 | 2.96e-02 | 30 |
| hsa0421015 | Endometrium | AEH | Apoptosis | 30/1197 | 136/8465 | 7.72e-03 | 4.05e-02 | 2.96e-02 | 30 |
| hsa0421024 | Endometrium | EEC | Apoptosis | 31/1237 | 136/8465 | 6.72e-03 | 3.25e-02 | 2.42e-02 | 31 |
| hsa0421034 | Endometrium | EEC | Apoptosis | 31/1237 | 136/8465 | 6.72e-03 | 3.25e-02 | 2.42e-02 | 31 |
| hsa0414222 | Esophagus | ESCC | Lysosome | 102/4205 | 132/8465 | 5.11e-11 | 7.13e-10 | 3.65e-10 | 102 |
| hsa0421027 | Esophagus | ESCC | Apoptosis | 102/4205 | 136/8465 | 1.05e-09 | 1.21e-08 | 6.21e-09 | 102 |
| Page: 1 2 3 |
Top |
Cell-cell communication analysis |
| Identification of potential cell-cell interactions between two cell types and their ligand-receptor pairs for different disease states |
| Ligand | Receptor | LRpair | Pathway | Tissue | Disease Stage |
| Page: 1 |
Top |
Single-cell gene regulatory network inference analysis |
| Find out the significant the regulons (TFs) and the target genes of each regulon across cell types for different disease states |
| TF | Cell Type | Tissue | Disease Stage | Target Gene | RSS | Regulon Activity |
| ∗The dot plots of a searched regulon are shown for all cell subpopulations in each disease state of each tissue based on the regulon specific score inferred using pySCENIC and by calculating the average expression. |
| Page: 1 |
Top |
Somatic mutation of malignant transformation related genes |
| Annotation of somatic variants for genes involved in malignant transformation |
| Hugo Symbol | Variant Class | Variant Classification | dbSNP RS | HGVSc | HGVSp | HGVSp Short | SWISSPROT | BIOTYPE | SIFT | PolyPhen | Tumor Sample Barcode | Tissue | Histology | Sex | Age | Stage | Therapy Types | Drugs | Outcome |
| CTSH | SNV | Missense_Mutation | novel | c.361N>A | p.Asp121Asn | p.D121N | P09668 | protein_coding | tolerated(0.05) | probably_damaging(0.926) | TCGA-2W-A8YY-01 | Cervix | cervical & endocervical cancer | Female | <65 | I/II | Chemotherapy | cisplatin | CR |
| CTSH | SNV | Missense_Mutation | c.760N>C | p.Glu254Gln | p.E254Q | P09668 | protein_coding | tolerated(0.51) | possibly_damaging(0.714) | TCGA-C5-A1M6-01 | Cervix | cervical & endocervical cancer | Female | <65 | I/II | Chemotherapy | cisplatin | PD | |
| CTSH | SNV | Missense_Mutation | c.760N>C | p.Glu254Gln | p.E254Q | P09668 | protein_coding | tolerated(0.51) | possibly_damaging(0.714) | TCGA-IR-A3LK-01 | Cervix | cervical & endocervical cancer | Female | >=65 | I/II | Chemotherapy | cisplatin | PD | |
| CTSH | SNV | Missense_Mutation | novel | c.389C>T | p.Ser130Leu | p.S130L | P09668 | protein_coding | deleterious(0.01) | probably_damaging(0.979) | TCGA-VS-A959-01 | Cervix | cervical & endocervical cancer | Female | >=65 | I/II | Unknown | Unknown | SD |
| CTSH | SNV | Missense_Mutation | c.526T>C | p.Phe176Leu | p.F176L | P09668 | protein_coding | deleterious(0) | probably_damaging(0.999) | TCGA-AA-3672-01 | Colorectum | colon adenocarcinoma | Female | >=65 | III/IV | Unknown | Unknown | SD | |
| CTSH | SNV | Missense_Mutation | novel | c.723N>T | p.Glu241Asp | p.E241D | P09668 | protein_coding | tolerated(0.46) | benign(0.006) | TCGA-AA-3947-01 | Colorectum | colon adenocarcinoma | Female | <65 | I/II | Unknown | Unknown | SD |
| CTSH | SNV | Missense_Mutation | rs543936667 | c.34G>A | p.Ala12Thr | p.A12T | P09668 | protein_coding | tolerated_low_confidence(0.06) | benign(0) | TCGA-AA-A010-01 | Colorectum | colon adenocarcinoma | Female | <65 | I/II | Chemotherapy | folinic | CR |
| CTSH | SNV | Missense_Mutation | rs747510233 | c.706N>A | p.Glu236Lys | p.E236K | P09668 | protein_coding | deleterious(0) | probably_damaging(1) | TCGA-AZ-4315-01 | Colorectum | colon adenocarcinoma | Male | <65 | I/II | Unknown | Unknown | SD |
| CTSH | SNV | Missense_Mutation | novel | c.517N>A | p.Ala173Thr | p.A173T | P09668 | protein_coding | deleterious(0) | probably_damaging(0.983) | TCGA-AZ-4315-01 | Colorectum | colon adenocarcinoma | Male | <65 | I/II | Unknown | Unknown | SD |
| CTSH | SNV | Missense_Mutation | c.469N>A | p.Ala157Thr | p.A157T | P09668 | protein_coding | tolerated(0.2) | benign(0.039) | TCGA-G4-6320-01 | Colorectum | colon adenocarcinoma | Male | >=65 | III/IV | Chemotherapy | oxaliplatin | SD |
| Page: 1 2 3 4 |
Top |
Related drugs of malignant transformation related genes |
| Identification of chemicals and drugs interact with genes involved in malignant transfromation |
| (DGIdb 4.0) |
| Entrez ID | Symbol | Category | Interaction Types | Drug Claim Name | Drug Name | PMIDs |
| 1512 | CTSH | DRUGGABLE GENOME, ENZYME, PROTEASE | inhibitor | 336446936 | ||
| 1512 | CTSH | DRUGGABLE GENOME, ENZYME, PROTEASE | inhibitor | 252166814 |
| Page: 1 |

Copyright 2023-Present -The University of Texas Health Science Center at Houston |