| Tissue | Expression Dynamics | Abbreviation |
| Cervix |  | CC: Cervix cancer |
| HSIL_HPV: HPV-infected high-grade squamous intraepithelial lesions |
| N_HPV: HPV-infected normal cervix |
| Liver | 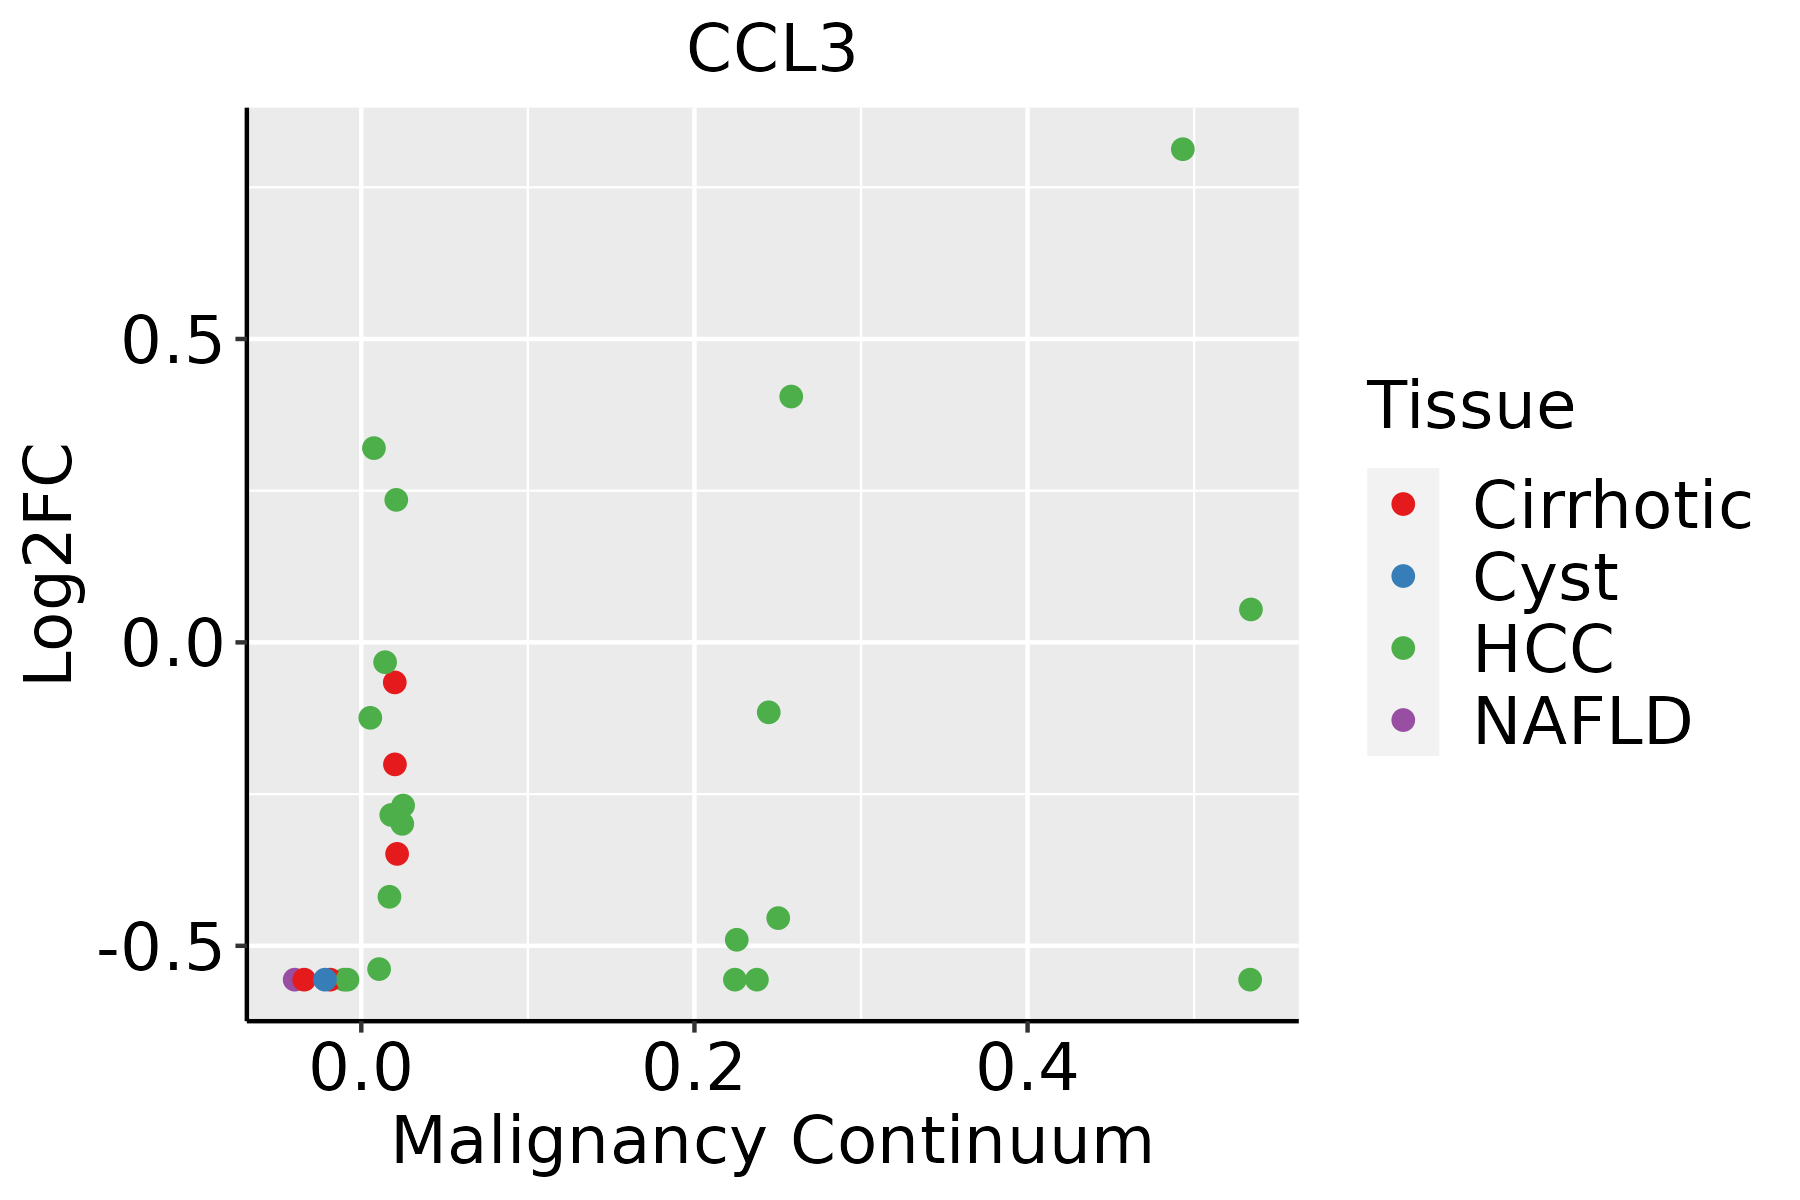 | HCC: Hepatocellular carcinoma |
| NAFLD: Non-alcoholic fatty liver disease |
| Oral Cavity | 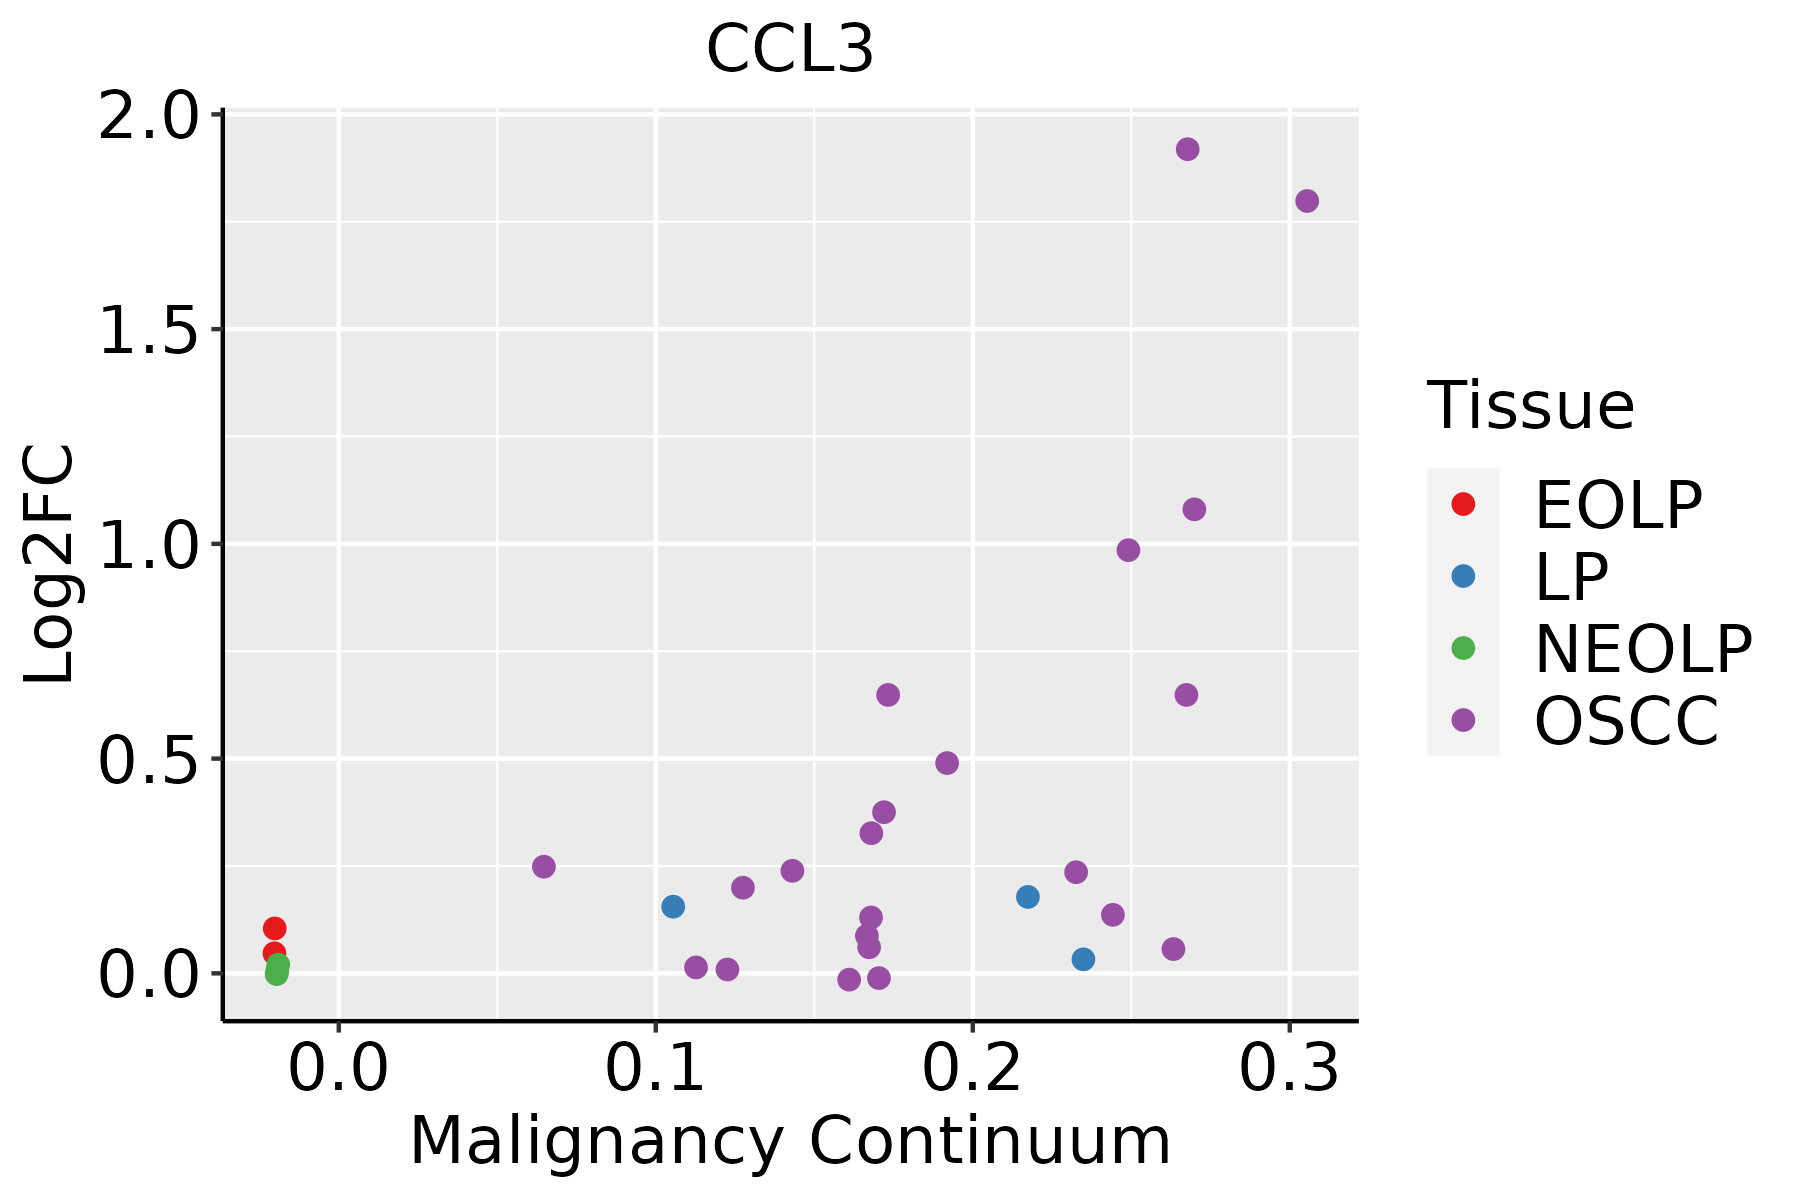 | EOLP: Erosive Oral lichen planus |
| LP: leukoplakia |
| NEOLP: Non-erosive oral lichen planus |
| OSCC: Oral squamous cell carcinoma |
| Skin |  | AK: Actinic keratosis |
| cSCC: Cutaneous squamous cell carcinoma |
| SCCIS:squamous cell carcinoma in situ |
| Thyroid |  | ATC: Anaplastic thyroid cancer |
| HT: Hashimoto's thyroiditis |
| PTC: Papillary thyroid cancer |
| GO ID | Tissue | Disease Stage | Description | Gene Ratio | Bg Ratio | pvalue | p.adjust | Count |
| GO:0043523110 | Thyroid | PTC | regulation of neuron apoptotic process | 102/5968 | 212/18723 | 5.45e-07 | 8.76e-06 | 102 |
| GO:0001503110 | Thyroid | PTC | ossification | 176/5968 | 408/18723 | 9.26e-07 | 1.40e-05 | 176 |
| GO:005185117 | Thyroid | PTC | modulation by host of symbiont process | 37/5968 | 60/18723 | 1.93e-06 | 2.64e-05 | 37 |
| GO:0051651113 | Thyroid | PTC | maintenance of location in cell | 100/5968 | 214/18723 | 3.65e-06 | 4.67e-05 | 100 |
| GO:0043525112 | Thyroid | PTC | positive regulation of neuron apoptotic process | 35/5968 | 58/18723 | 7.35e-06 | 8.60e-05 | 35 |
| GO:004308718 | Thyroid | PTC | regulation of GTPase activity | 148/5968 | 348/18723 | 1.63e-05 | 1.71e-04 | 148 |
| GO:0030099113 | Thyroid | PTC | myeloid cell differentiation | 160/5968 | 381/18723 | 1.75e-05 | 1.82e-04 | 160 |
| GO:0009636111 | Thyroid | PTC | response to toxic substance | 115/5968 | 262/18723 | 2.70e-05 | 2.63e-04 | 115 |
| GO:0001649111 | Thyroid | PTC | osteoblast differentiation | 102/5968 | 229/18723 | 3.66e-05 | 3.40e-04 | 102 |
| GO:003582117 | Thyroid | PTC | modulation of process of other organism | 53/5968 | 106/18723 | 7.63e-05 | 6.54e-04 | 53 |
| GO:0034612111 | Thyroid | PTC | response to tumor necrosis factor | 109/5968 | 253/18723 | 1.08e-04 | 8.69e-04 | 109 |
| GO:0097305113 | Thyroid | PTC | response to alcohol | 107/5968 | 253/18723 | 2.92e-04 | 2.07e-03 | 107 |
| GO:0071356111 | Thyroid | PTC | cellular response to tumor necrosis factor | 96/5968 | 229/18723 | 8.24e-04 | 5.10e-03 | 96 |
| GO:003210316 | Thyroid | PTC | positive regulation of response to external stimulus | 167/5968 | 427/18723 | 8.31e-04 | 5.13e-03 | 167 |
| GO:004206315 | Thyroid | PTC | gliogenesis | 121/5968 | 301/18723 | 1.30e-03 | 7.41e-03 | 121 |
| GO:00434918 | Thyroid | PTC | protein kinase B signaling | 88/5968 | 211/18723 | 1.59e-03 | 8.81e-03 | 88 |
| GO:005092115 | Thyroid | PTC | positive regulation of chemotaxis | 62/5968 | 141/18723 | 1.67e-03 | 9.16e-03 | 62 |
| GO:005170218 | Thyroid | PTC | biological process involved in interaction with symbiont | 44/5968 | 94/18723 | 1.72e-03 | 9.44e-03 | 44 |
| GO:004354714 | Thyroid | PTC | positive regulation of GTPase activity | 103/5968 | 255/18723 | 2.38e-03 | 1.25e-02 | 103 |
| GO:00439225 | Thyroid | PTC | negative regulation by host of viral transcription | 10/5968 | 14/18723 | 2.77e-03 | 1.38e-02 | 10 |
| Pathway ID | Tissue | Disease Stage | Description | Gene Ratio | Bg Ratio | pvalue | p.adjust | qvalue | Count |
| hsa0541720 | Cervix | CC | Lipid and atherosclerosis | 65/1267 | 215/8465 | 6.47e-09 | 1.10e-07 | 6.52e-08 | 65 |
| hsa0516318 | Cervix | CC | Human cytomegalovirus infection | 65/1267 | 225/8465 | 4.59e-08 | 6.47e-07 | 3.83e-07 | 65 |
| hsa0532314 | Cervix | CC | Rheumatoid arthritis | 27/1267 | 93/8465 | 3.64e-04 | 1.82e-03 | 1.07e-03 | 27 |
| hsa05417110 | Cervix | CC | Lipid and atherosclerosis | 65/1267 | 215/8465 | 6.47e-09 | 1.10e-07 | 6.52e-08 | 65 |
| hsa0516319 | Cervix | CC | Human cytomegalovirus infection | 65/1267 | 225/8465 | 4.59e-08 | 6.47e-07 | 3.83e-07 | 65 |
| hsa0532315 | Cervix | CC | Rheumatoid arthritis | 27/1267 | 93/8465 | 3.64e-04 | 1.82e-03 | 1.07e-03 | 27 |
| hsa0541745 | Cervix | N_HPV | Lipid and atherosclerosis | 22/349 | 215/8465 | 7.28e-05 | 7.92e-04 | 6.19e-04 | 22 |
| hsa0541755 | Cervix | N_HPV | Lipid and atherosclerosis | 22/349 | 215/8465 | 7.28e-05 | 7.92e-04 | 6.19e-04 | 22 |
| hsa0516312 | Liver | Cirrhotic | Human cytomegalovirus infection | 87/2530 | 225/8465 | 2.67e-03 | 1.10e-02 | 6.76e-03 | 87 |
| hsa0541722 | Liver | Cirrhotic | Lipid and atherosclerosis | 80/2530 | 215/8465 | 1.18e-02 | 3.81e-02 | 2.35e-02 | 80 |
| hsa0532310 | Liver | Cirrhotic | Rheumatoid arthritis | 38/2530 | 93/8465 | 1.52e-02 | 4.57e-02 | 2.82e-02 | 38 |
| hsa0516313 | Liver | Cirrhotic | Human cytomegalovirus infection | 87/2530 | 225/8465 | 2.67e-03 | 1.10e-02 | 6.76e-03 | 87 |
| hsa0541732 | Liver | Cirrhotic | Lipid and atherosclerosis | 80/2530 | 215/8465 | 1.18e-02 | 3.81e-02 | 2.35e-02 | 80 |
| hsa0532311 | Liver | Cirrhotic | Rheumatoid arthritis | 38/2530 | 93/8465 | 1.52e-02 | 4.57e-02 | 2.82e-02 | 38 |
| hsa0516322 | Liver | HCC | Human cytomegalovirus infection | 131/4020 | 225/8465 | 6.86e-04 | 2.77e-03 | 1.54e-03 | 131 |
| hsa05142 | Liver | HCC | Chagas disease | 61/4020 | 102/8465 | 8.04e-03 | 2.17e-02 | 1.21e-02 | 61 |
| hsa0541742 | Liver | HCC | Lipid and atherosclerosis | 118/4020 | 215/8465 | 1.66e-02 | 3.92e-02 | 2.18e-02 | 118 |
| hsa0516332 | Liver | HCC | Human cytomegalovirus infection | 131/4020 | 225/8465 | 6.86e-04 | 2.77e-03 | 1.54e-03 | 131 |
| hsa051421 | Liver | HCC | Chagas disease | 61/4020 | 102/8465 | 8.04e-03 | 2.17e-02 | 1.21e-02 | 61 |
| hsa0541752 | Liver | HCC | Lipid and atherosclerosis | 118/4020 | 215/8465 | 1.66e-02 | 3.92e-02 | 2.18e-02 | 118 |
| Hugo Symbol | Variant Class | Variant Classification | dbSNP RS | HGVSc | HGVSp | HGVSp Short | SWISSPROT | BIOTYPE | SIFT | PolyPhen | Tumor Sample Barcode | Tissue | Histology | Sex | Age | Stage | Therapy Types | Drugs | Outcome |
| CCL3 | SNV | Missense_Mutation | novel | c.123N>T | p.Gln41His | p.Q41H | P10147 | protein_coding | deleterious(0.01) | benign(0.049) | TCGA-A5-A0G2-01 | Endometrium | uterine corpus endometrioid carcinoma | Female | <65 | III/IV | Unknown | Unknown | SD |
| CCL3 | SNV | Missense_Mutation | novel | c.131N>G | p.Gln44Arg | p.Q44R | P10147 | protein_coding | tolerated(1) | benign(0.001) | TCGA-AP-A1DK-01 | Endometrium | uterine corpus endometrioid carcinoma | Female | <65 | I/II | Unknown | Unknown | SD |
| CCL3 | SNV | Missense_Mutation | novel | c.73C>T | p.Leu25Phe | p.L25F | P10147 | protein_coding | tolerated(1) | benign(0.005) | TCGA-B5-A3FA-01 | Endometrium | uterine corpus endometrioid carcinoma | Female | >=65 | I/II | Unknown | Unknown | SD |
| CCL3 | SNV | Missense_Mutation | novel | c.178C>T | p.Pro60Ser | p.P60S | P10147 | protein_coding | deleterious(0.02) | possibly_damaging(0.764) | TCGA-EO-A3AV-01 | Endometrium | uterine corpus endometrioid carcinoma | Female | <65 | III/IV | Chemotherapy | carboplatin | CR |
| CCL3 | SNV | Missense_Mutation | rs773703371 | c.203G>A | p.Arg68Gln | p.R68Q | P10147 | protein_coding | deleterious(0) | possibly_damaging(0.842) | TCGA-EO-A3AY-01 | Endometrium | uterine corpus endometrioid carcinoma | Female | <65 | I/II | Unknown | Unknown | PD |
| CCL3 | SNV | Missense_Mutation | novel | c.232N>A | p.Glu78Lys | p.E78K | P10147 | protein_coding | deleterious(0.03) | benign(0.021) | TCGA-DD-A73A-01 | Liver | liver hepatocellular carcinoma | Male | >=65 | I/II | Unknown | Unknown | SD |
| CCL3 | SNV | Missense_Mutation | novel | c.273N>A | p.Ser91Arg | p.S91R | P10147 | protein_coding | deleterious(0) | benign(0.104) | TCGA-18-3414-01 | Lung | lung squamous cell carcinoma | Male | >=65 | III/IV | Unknown | Unknown | SD |
| CCL3 | SNV | Missense_Mutation | rs190805628 | c.101G>C | p.Cys34Ser | p.C34S | P10147 | protein_coding | deleterious(0) | probably_damaging(1) | TCGA-60-2698-01 | Lung | lung squamous cell carcinoma | Male | <65 | I/II | Chemotherapy | mithramycin | PD |
| CCL3 | SNV | Missense_Mutation | novel | c.106A>T | p.Ser36Cys | p.S36C | P10147 | protein_coding | deleterious(0) | probably_damaging(0.971) | TCGA-85-7843-01 | Lung | lung squamous cell carcinoma | Male | <65 | I/II | Unknown | Unknown | SD |
| CCL3 | SNV | Missense_Mutation | rs368462880 | c.89N>T | p.Pro30Leu | p.P30L | P10147 | protein_coding | deleterious(0.02) | possibly_damaging(0.751) | TCGA-CQ-6229-01 | Oral cavity | head & neck squamous cell carcinoma | Male | <65 | I/II | Unknown | Unknown | SD |


