
|
|||||
|
 | |
| |
| |
| |
| |
| |
|
Gene: TG |
Gene summary for TG |
| Gene information | Species | Human | Gene symbol | TG | Gene ID | 7038 |
| Gene name | thyroglobulin | |
| Gene Alias | AITD3 | |
| Cytomap | 8q24.22 | |
| Gene Type | protein-coding | GO ID | GO:0006575 | UniProtAcc | P01266 |
Top |
Malignant transformation analysis |
| Identification of the aberrant gene expression in precancerous and cancerous lesions by comparing the gene expression of stem-like cells in diseased tissues with normal stem cells |
| Entrez ID | Symbol | Replicates | Species | Organ | Tissue | Adj P-value | Log2FC | Malignancy |
| 7038 | TG | Adj_PTCwithHT_6 | Human | Thyroid | HT | 7.30e-105 | -2.11e+00 | 0.02 |
| 7038 | TG | Adj_PTCwithHT_8 | Human | Thyroid | HT | 6.03e-06 | -2.18e-01 | 0.0267 |
| 7038 | TG | PTCwithHT_1 | Human | Thyroid | HT | 1.56e-31 | -1.52e+00 | 0.0238 |
| 7038 | TG | PTCwithHT_6 | Human | Thyroid | HT | 1.38e-104 | -2.12e+00 | 0.02 |
| 7038 | TG | PTCwithHT_8 | Human | Thyroid | HT | 2.54e-58 | -1.07e+00 | 0.0351 |
| 7038 | TG | PTCwithoutHT_2 | Human | Thyroid | PTC | 3.80e-11 | -3.56e-01 | 0.0419 |
| 7038 | TG | PTCwithoutHT_7 | Human | Thyroid | PTC | 4.95e-19 | -8.43e-01 | 0.0381 |
| 7038 | TG | male-WTA | Human | Thyroid | PTC | 1.56e-05 | 1.85e-01 | 0.1037 |
| 7038 | TG | nodule-WTA | Human | Thyroid | goiters | 1.11e-15 | 2.90e-01 | 0.0534 |
| 7038 | TG | PTC01 | Human | Thyroid | PTC | 1.01e-25 | 2.49e+00 | 0.1899 |
| 7038 | TG | PTC03 | Human | Thyroid | PTC | 2.57e-11 | 1.84e+00 | 0.1784 |
| 7038 | TG | PTC04 | Human | Thyroid | PTC | 7.44e-08 | 1.70e+00 | 0.1927 |
| 7038 | TG | PTC05 | Human | Thyroid | PTC | 7.32e-32 | 2.88e+00 | 0.2065 |
| 7038 | TG | PTC06 | Human | Thyroid | PTC | 8.06e-54 | 4.16e+00 | 0.2057 |
| 7038 | TG | PTC07 | Human | Thyroid | PTC | 5.54e-48 | 2.79e+00 | 0.2044 |
| 7038 | TG | ATC08 | Human | Thyroid | ATC | 1.04e-55 | -1.49e+00 | 0.0541 |
| 7038 | TG | ATC09 | Human | Thyroid | ATC | 2.30e-54 | -2.31e+00 | 0.2871 |
| 7038 | TG | ATC11 | Human | Thyroid | ATC | 5.27e-20 | -2.31e+00 | 0.3386 |
| 7038 | TG | ATC12 | Human | Thyroid | ATC | 2.29e-129 | -2.31e+00 | 0.34 |
| 7038 | TG | ATC13 | Human | Thyroid | ATC | 7.68e-130 | -2.30e+00 | 0.34 |
| Page: 1 2 |
| Tissue | Expression Dynamics | Abbreviation |
| Thyroid | 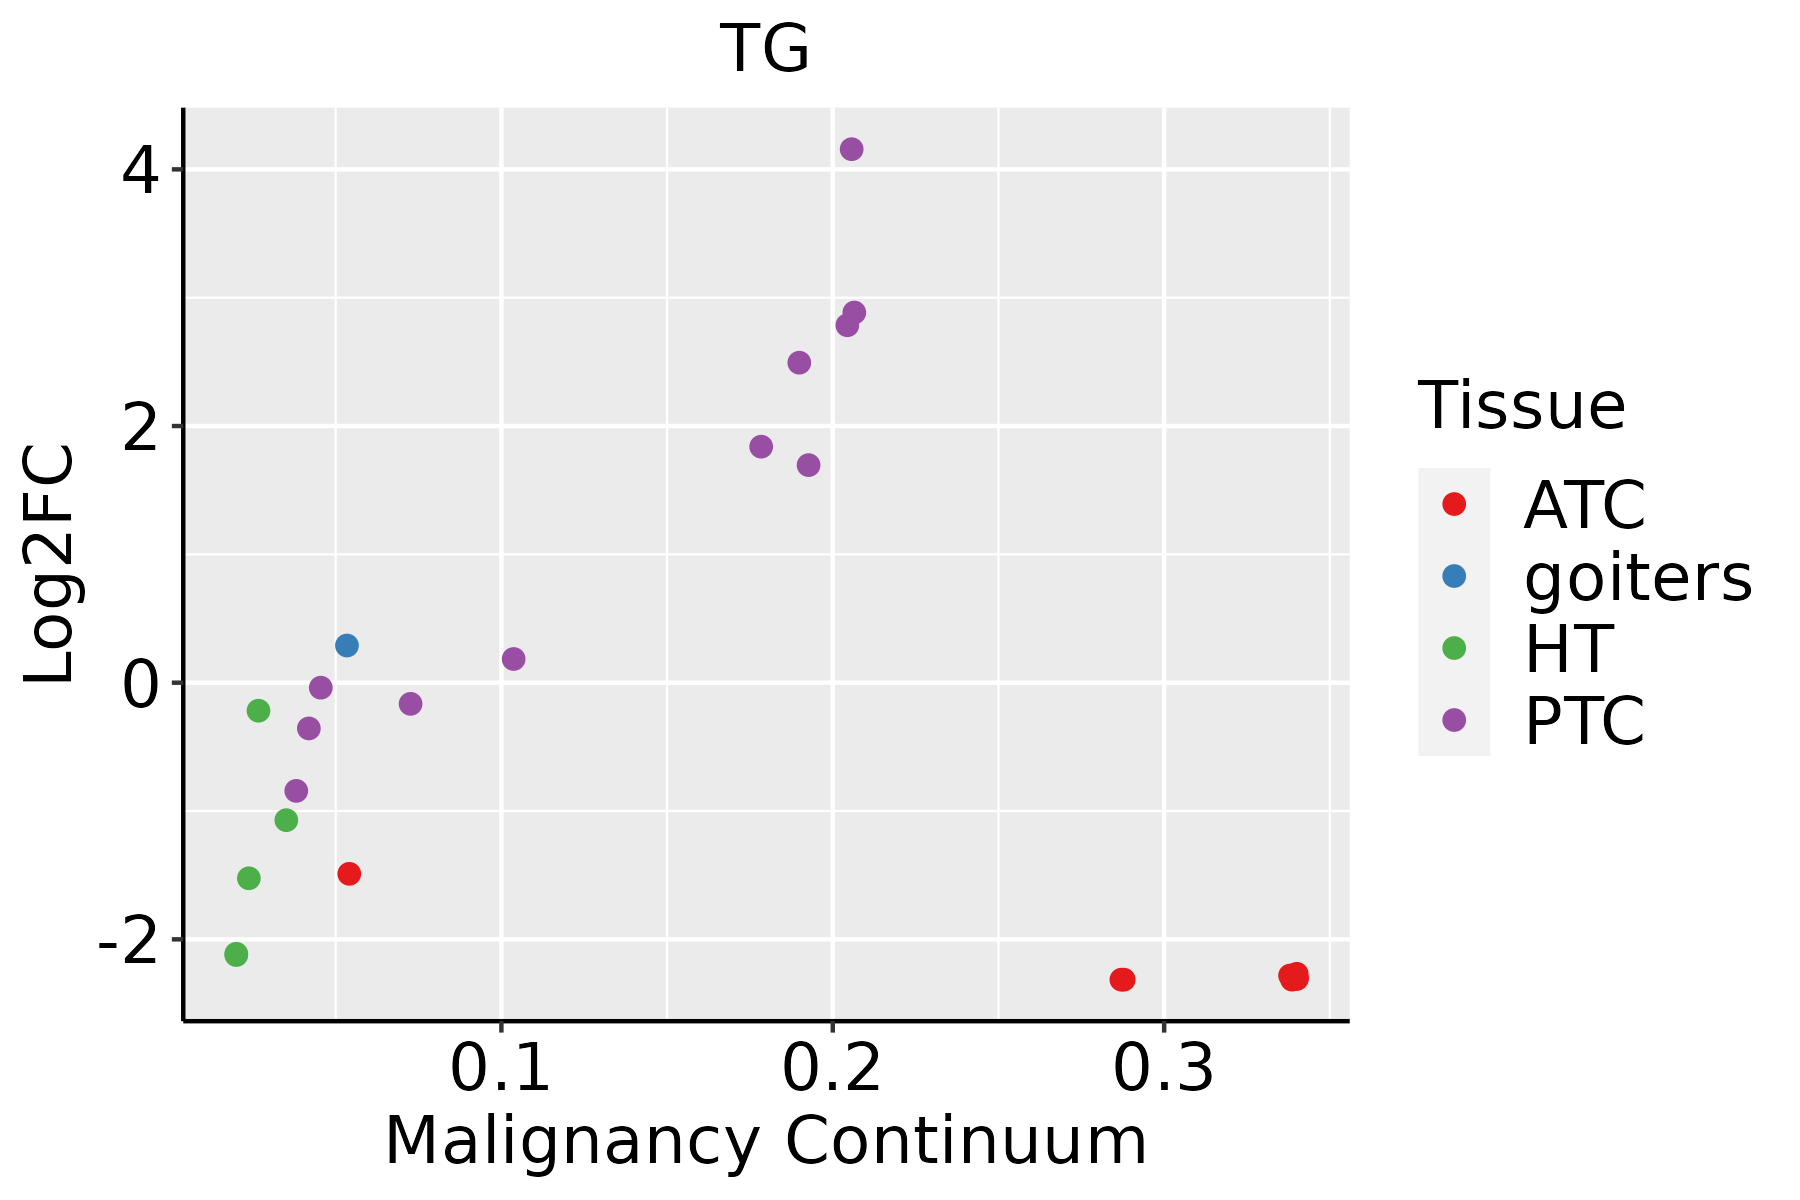 | ATC: Anaplastic thyroid cancer |
| HT: Hashimoto's thyroiditis | ||
| PTC: Papillary thyroid cancer |
| ∗log2FC in expression of this searched gene in stem-like cells from each diseased tissue sample relative to stem-like cells in normal samples in each tissue plotted against the malignancy continuum. Samples are colored based on if they are from different disease stage. |
Top |
Malignant transformation related pathway analysis |
| Find out the enriched GO biological processes and KEGG pathways involved in transition from healthy to precancer to cancer |
| Tissue | Disease Stage | Enriched GO biological Processes |
| Colorectum | AD |  |
| Colorectum | SER |  |
| Colorectum | MSS |  |
| Colorectum | MSI-H |  |
| Colorectum | FAP |  |
| ∗Top 15 enriched GO BP terms are showed in the bar plot of each disease state in each tissue. Each row represents a significant GO biological process which is colored according to the -log10(p.adjust). |
| Page: 1 2 3 4 5 6 7 8 9 |
| GO ID | Tissue | Disease Stage | Description | Gene Ratio | Bg Ratio | pvalue | p.adjust | Count |
| GO:000697923 | Lung | MIAC | response to oxidative stress | 43/967 | 446/18723 | 6.39e-05 | 3.12e-03 | 43 |
| GO:004206023 | Lung | MIAC | wound healing | 41/967 | 422/18723 | 7.92e-05 | 3.66e-03 | 41 |
| GO:004477221 | Lung | MIAC | mitotic cell cycle phase transition | 41/967 | 424/18723 | 8.79e-05 | 3.92e-03 | 41 |
| GO:003223132 | Lung | MIAC | regulation of actin filament bundle assembly | 16/967 | 105/18723 | 9.36e-05 | 4.10e-03 | 16 |
| GO:00720013 | Lung | MIAC | renal system development | 32/967 | 302/18723 | 9.64e-05 | 4.19e-03 | 32 |
| GO:000182221 | Lung | MIAC | kidney development | 31/967 | 293/18723 | 1.27e-04 | 5.13e-03 | 31 |
| GO:007155922 | Lung | MIAC | response to transforming growth factor beta | 28/967 | 256/18723 | 1.51e-04 | 5.95e-03 | 28 |
| GO:004671823 | Lung | MIAC | viral entry into host cell | 19/967 | 144/18723 | 1.58e-04 | 6.13e-03 | 19 |
| GO:000165521 | Lung | MIAC | urogenital system development | 34/967 | 338/18723 | 1.63e-04 | 6.25e-03 | 34 |
| GO:007265922 | Lung | MIAC | protein localization to plasma membrane | 30/967 | 284/18723 | 1.66e-04 | 6.31e-03 | 30 |
| GO:011002032 | Lung | MIAC | regulation of actomyosin structure organization | 15/967 | 100/18723 | 1.84e-04 | 6.73e-03 | 15 |
| GO:001081123 | Lung | MIAC | positive regulation of cell-substrate adhesion | 17/967 | 123/18723 | 1.96e-04 | 7.07e-03 | 17 |
| GO:006056021 | Lung | MIAC | developmental growth involved in morphogenesis | 26/967 | 234/18723 | 1.99e-04 | 7.15e-03 | 26 |
| GO:000931431 | Lung | MIAC | response to radiation | 42/967 | 456/18723 | 2.11e-04 | 7.47e-03 | 42 |
| GO:199013821 | Lung | MIAC | neuron projection extension | 21/967 | 172/18723 | 2.21e-04 | 7.66e-03 | 21 |
| GO:005149222 | Lung | MIAC | regulation of stress fiber assembly | 14/967 | 91/18723 | 2.27e-04 | 7.78e-03 | 14 |
| GO:001603223 | Lung | MIAC | viral process | 39/967 | 415/18723 | 2.34e-04 | 7.89e-03 | 39 |
| GO:199077822 | Lung | MIAC | protein localization to cell periphery | 33/967 | 333/18723 | 2.67e-04 | 8.61e-03 | 33 |
| GO:004440923 | Lung | MIAC | entry into host | 19/967 | 151/18723 | 2.94e-04 | 9.14e-03 | 19 |
| GO:005170123 | Lung | MIAC | biological process involved in interaction with host | 23/967 | 203/18723 | 3.43e-04 | 1.03e-02 | 23 |
| Pathway ID | Tissue | Disease Stage | Description | Gene Ratio | Bg Ratio | pvalue | p.adjust | qvalue | Count |
| Page: 1 |
Top |
Cell-cell communication analysis |
| Identification of potential cell-cell interactions between two cell types and their ligand-receptor pairs for different disease states |
| Ligand | Receptor | LRpair | Pathway | Tissue | Disease Stage |
| COL1A1 | ITGA1_ITGB1 | COL1A1_ITGA1_ITGB1 | COLLAGEN | Breast | ADJ |
| COL1A2 | ITGA1_ITGB1 | COL1A2_ITGA1_ITGB1 | COLLAGEN | Breast | ADJ |
| COL4A1 | ITGA1_ITGB1 | COL4A1_ITGA1_ITGB1 | COLLAGEN | Breast | ADJ |
| COL4A2 | ITGA1_ITGB1 | COL4A2_ITGA1_ITGB1 | COLLAGEN | Breast | ADJ |
| COL6A1 | ITGA1_ITGB1 | COL6A1_ITGA1_ITGB1 | COLLAGEN | Breast | ADJ |
| COL6A2 | ITGA1_ITGB1 | COL6A2_ITGA1_ITGB1 | COLLAGEN | Breast | ADJ |
| COL6A3 | ITGA1_ITGB1 | COL6A3_ITGA1_ITGB1 | COLLAGEN | Breast | ADJ |
| COL1A1 | ITGA2_ITGB1 | COL1A1_ITGA2_ITGB1 | COLLAGEN | Breast | ADJ |
| COL1A2 | ITGA2_ITGB1 | COL1A2_ITGA2_ITGB1 | COLLAGEN | Breast | ADJ |
| COL4A1 | ITGA2_ITGB1 | COL4A1_ITGA2_ITGB1 | COLLAGEN | Breast | ADJ |
| COL4A2 | ITGA2_ITGB1 | COL4A2_ITGA2_ITGB1 | COLLAGEN | Breast | ADJ |
| COL6A1 | ITGA2_ITGB1 | COL6A1_ITGA2_ITGB1 | COLLAGEN | Breast | ADJ |
| COL6A2 | ITGA2_ITGB1 | COL6A2_ITGA2_ITGB1 | COLLAGEN | Breast | ADJ |
| COL6A3 | ITGA2_ITGB1 | COL6A3_ITGA2_ITGB1 | COLLAGEN | Breast | ADJ |
| LAMA2 | ITGA1_ITGB1 | LAMA2_ITGA1_ITGB1 | LAMININ | Breast | ADJ |
| LAMA4 | ITGA1_ITGB1 | LAMA4_ITGA1_ITGB1 | LAMININ | Breast | ADJ |
| LAMB2 | ITGA1_ITGB1 | LAMB2_ITGA1_ITGB1 | LAMININ | Breast | ADJ |
| LAMB3 | ITGA1_ITGB1 | LAMB3_ITGA1_ITGB1 | LAMININ | Breast | ADJ |
| LAMC1 | ITGA1_ITGB1 | LAMC1_ITGA1_ITGB1 | LAMININ | Breast | ADJ |
| LAMC2 | ITGA1_ITGB1 | LAMC2_ITGA1_ITGB1 | LAMININ | Breast | ADJ |
| Page: 1 |
Top |
Single-cell gene regulatory network inference analysis |
| Find out the significant the regulons (TFs) and the target genes of each regulon across cell types for different disease states |
| TF | Cell Type | Tissue | Disease Stage | Target Gene | RSS | Regulon Activity |
| ∗The dot plots of a searched regulon are shown for all cell subpopulations in each disease state of each tissue based on the regulon specific score inferred using pySCENIC and by calculating the average expression. |
| Page: 1 |
Top |
Somatic mutation of malignant transformation related genes |
| Annotation of somatic variants for genes involved in malignant transformation |
| Hugo Symbol | Variant Class | Variant Classification | dbSNP RS | HGVSc | HGVSp | HGVSp Short | SWISSPROT | BIOTYPE | SIFT | PolyPhen | Tumor Sample Barcode | Tissue | Histology | Sex | Age | Stage | Therapy Types | Drugs | Outcome |
| TG | SNV | Missense_Mutation | rs201480815 | c.3416N>T | p.Ser1139Leu | p.S1139L | P01266 | protein_coding | tolerated(0.14) | benign(0) | TCGA-A1-A0SK-01 | Breast | breast invasive carcinoma | Female | <65 | I/II | Unknown | Unknown | PD |
| TG | SNV | Missense_Mutation | c.4662G>T | p.Trp1554Cys | p.W1554C | P01266 | protein_coding | deleterious(0.01) | benign(0.123) | TCGA-A1-A0SP-01 | Breast | breast invasive carcinoma | Female | <65 | I/II | Chemotherapy | SD | ||
| TG | SNV | Missense_Mutation | c.4882N>T | p.Asp1628Tyr | p.D1628Y | P01266 | protein_coding | deleterious(0) | possibly_damaging(0.861) | TCGA-A2-A04W-01 | Breast | breast invasive carcinoma | Female | <65 | I/II | Chemotherapy | cytoxan | SD | |
| TG | SNV | Missense_Mutation | c.3133N>A | p.Gly1045Arg | p.G1045R | P01266 | protein_coding | tolerated(0.13) | benign(0.007) | TCGA-A2-A25B-01 | Breast | breast invasive carcinoma | Female | <65 | I/II | Chemotherapy | taxotere | PD | |
| TG | SNV | Missense_Mutation | c.5223N>C | p.Gln1741His | p.Q1741H | P01266 | protein_coding | deleterious(0.02) | probably_damaging(0.994) | TCGA-A2-A25B-01 | Breast | breast invasive carcinoma | Female | <65 | I/II | Chemotherapy | taxotere | PD | |
| TG | SNV | Missense_Mutation | rs773795717 | c.4645C>T | p.Arg1549Trp | p.R1549W | P01266 | protein_coding | deleterious(0.05) | benign(0.232) | TCGA-A7-A13E-01 | Breast | breast invasive carcinoma | Female | <65 | I/II | Targeted Molecular therapy | bevacizumab | PD |
| TG | SNV | Missense_Mutation | novel | c.1093N>A | p.Ala365Thr | p.A365T | P01266 | protein_coding | tolerated(0.44) | benign(0) | TCGA-A7-A26I-01 | Breast | breast invasive carcinoma | Female | >=65 | I/II | Chemotherapy | cytoxan | SD |
| TG | SNV | Missense_Mutation | rs146594373 | c.4268N>A | p.Arg1423His | p.R1423H | P01266 | protein_coding | tolerated(0.55) | benign(0.001) | TCGA-A8-A06O-01 | Breast | breast invasive carcinoma | Female | <65 | I/II | Hormone Therapy | letrozole | SD |
| TG | SNV | Missense_Mutation | c.746G>A | p.Gly249Asp | p.G249D | P01266 | protein_coding | deleterious(0) | probably_damaging(0.999) | TCGA-A8-A07L-01 | Breast | breast invasive carcinoma | Female | <65 | III/IV | Chemotherapy | CR | ||
| TG | SNV | Missense_Mutation | c.3746N>T | p.Cys1249Phe | p.C1249F | P01266 | protein_coding | deleterious(0) | probably_damaging(0.998) | TCGA-A8-A08F-01 | Breast | breast invasive carcinoma | Female | <65 | III/IV | Chemotherapy | 5-fluorouracil | CR |
| Page: 1 2 3 4 5 6 7 8 9 10 11 12 13 14 15 16 17 18 19 20 21 22 23 24 25 26 27 28 29 30 31 32 33 34 35 36 37 38 39 40 41 42 43 44 45 46 47 48 |
Top |
Related drugs of malignant transformation related genes |
| Identification of chemicals and drugs interact with genes involved in malignant transfromation |
| (DGIdb 4.0) |
| Entrez ID | Symbol | Category | Interaction Types | Drug Claim Name | Drug Name | PMIDs |
| 7038 | TG | DRUGGABLE GENOME, HORMONE ACTIVITY | RETINOIDS | 12182039 | ||
| 7038 | TG | DRUGGABLE GENOME, HORMONE ACTIVITY | FDG | FLUDEOXYGLUCOSE-F18 | 10452315 | |
| 7038 | TG | DRUGGABLE GENOME, HORMONE ACTIVITY | BISPECIFIC ANTIBODY | 10433080 | ||
| 7038 | TG | DRUGGABLE GENOME, HORMONE ACTIVITY | PHENYTOIN | PHENYTOIN | 3935423 | |
| 7038 | TG | DRUGGABLE GENOME, HORMONE ACTIVITY | PREDNISONE | PREDNISONE | 2745931 | |
| 7038 | TG | DRUGGABLE GENOME, HORMONE ACTIVITY | ALL-TRANS-RETINOIC ACID | 10946899 | ||
| 7038 | TG | DRUGGABLE GENOME, HORMONE ACTIVITY | TGFBETA1 | 10770487,10194419 | ||
| 7038 | TG | DRUGGABLE GENOME, HORMONE ACTIVITY | RETINOIC ACID | 11563543 | ||
| 7038 | TG | DRUGGABLE GENOME, HORMONE ACTIVITY | PREDNISOLONE | PREDNISOLONE | 3427792,8636270 | |
| 7038 | TG | DRUGGABLE GENOME, HORMONE ACTIVITY | AMIODARONE | AMIODARONE | 8778159 |
| Page: 1 2 3 4 |

Copyright 2023-Present -The University of Texas Health Science Center at Houston |