Schematic overview of the cellular and molecular mechanisms involved in the cancer progression, including the proposed cellular and molecular mechanisms in cancer cells trajectory. AT1: alveolar type 1 cells; AT2: alveolar type 2 cells; AAH: atypical adenomatous hyperplasia; AIS: adenocarcinoma in situ; MIA: minimally invasive adenocarcinoma; IA: invasive adenocarcinoma; EMT: epithelial-mesenchymal transition

Home

Download

Statistics

Help

Contact

Center for Computational Systems Medicine
leaf

Gene summary

leaf

Malignant transformation analysis

leaf

Malignant transformation related pathway analysis

leaf

Cell-cell communication analysis

leaf

Single-cell gene regulatory network inference analysis

leaf

Somatic mutation of malignant transformation related genes

leaf

Related drugs of malignant transformation related genes

Gene: THRAP3

Gene summary for THRAP3

check button Gene summary.

Gene informationSpeciesHuman
Gene symbol

THRAP3

Gene ID

9967

Gene namethyroid hormone receptor associated protein 3
Gene AliasBCLAF2
Cytomap1p34.3
Gene Typeprotein-coding
GO ID

GO:0000375

UniProtAcc

Q9Y2W1


Top

Malignant transformation analysis

check button Identification of the aberrant gene expression in precancerous and cancerous lesions by comparing the gene expression of stem-like cells in diseased tissues with normal stem cells
check button Malignant transformation involving gene list.
Entrez IDSymbolReplicatesSpeciesOrganTissueAdj P-valueLog2FCMalignancy
9967THRAP3HTA11_347_2000001011HumanColorectumAD1.63e-085.73e-01-0.1954
9967THRAP3HTA11_411_2000001011HumanColorectumSER5.63e-037.64e-01-0.2602
9967THRAP3HTA11_1391_2000001011HumanColorectumAD2.00e-025.13e-01-0.059
9967THRAP3HTA11_99999965062_69753HumanColorectumMSI-H1.56e-051.12e+000.3487
9967THRAP3HTA11_99999965104_69814HumanColorectumMSS4.84e-035.39e-010.281
9967THRAP3A002-C-010HumanColorectumFAP1.92e-03-1.85e-010.242
9967THRAP3A015-C-203HumanColorectumFAP1.45e-23-3.12e-01-0.1294
9967THRAP3A015-C-204HumanColorectumFAP5.84e-04-1.95e-01-0.0228
9967THRAP3A014-C-040HumanColorectumFAP6.58e-04-3.19e-01-0.1184
9967THRAP3A002-C-201HumanColorectumFAP9.63e-11-3.15e-010.0324
9967THRAP3A002-C-203HumanColorectumFAP5.96e-07-1.87e-010.2786
9967THRAP3A001-C-119HumanColorectumFAP2.12e-03-4.78e-02-0.1557
9967THRAP3A001-C-108HumanColorectumFAP8.24e-14-1.66e-01-0.0272
9967THRAP3A002-C-205HumanColorectumFAP5.34e-18-2.18e-01-0.1236
9967THRAP3A001-C-104HumanColorectumFAP9.88e-03-8.36e-020.0184
9967THRAP3A015-C-005HumanColorectumFAP1.39e-02-2.04e-01-0.0336
9967THRAP3A015-C-006HumanColorectumFAP1.40e-12-7.38e-03-0.0994
9967THRAP3A015-C-106HumanColorectumFAP4.26e-11-1.84e-01-0.0511
9967THRAP3A002-C-114HumanColorectumFAP4.02e-14-2.71e-01-0.1561
9967THRAP3A015-C-104HumanColorectumFAP3.21e-22-1.45e-01-0.1899
Page: 1 2 3 4 5 6 7 8 9 10 11 

check button Transcriptomic changes along malignancy continuum.
TissueExpression DynamicsAbbreviation
Colorectum (GSE201348)The image shows the transcriptomic changes along malignancy continuum.log2FC in expression of this searched gene in stem-like cells from each diseased tissue sample relative to stem-like cells in normal samples in each tissue plotted against the malignancy continuum. Samples are colored based on if they are from different disease stage.FAP: Familial adenomatous polyposis
CRC: Colorectal cancer
Colorectum (HTA11)The image shows the transcriptomic changes along malignancy continuum.log2FC in expression of this searched gene in stem-like cells from each diseased tissue sample relative to stem-like cells in normal samples in each tissue plotted against the malignancy continuum. Samples are colored based on if they are from different disease stage.AD: Adenomas
SER: Sessile serrated lesions
MSI-H: Microsatellite-high colorectal cancer
MSS: Microsatellite stable colorectal cancer
EsophagusThe image shows the transcriptomic changes along malignancy continuum.log2FC in expression of this searched gene in stem-like cells from each diseased tissue sample relative to stem-like cells in normal samples in each tissue plotted against the malignancy continuum. Samples are colored based on if they are from different disease stage.
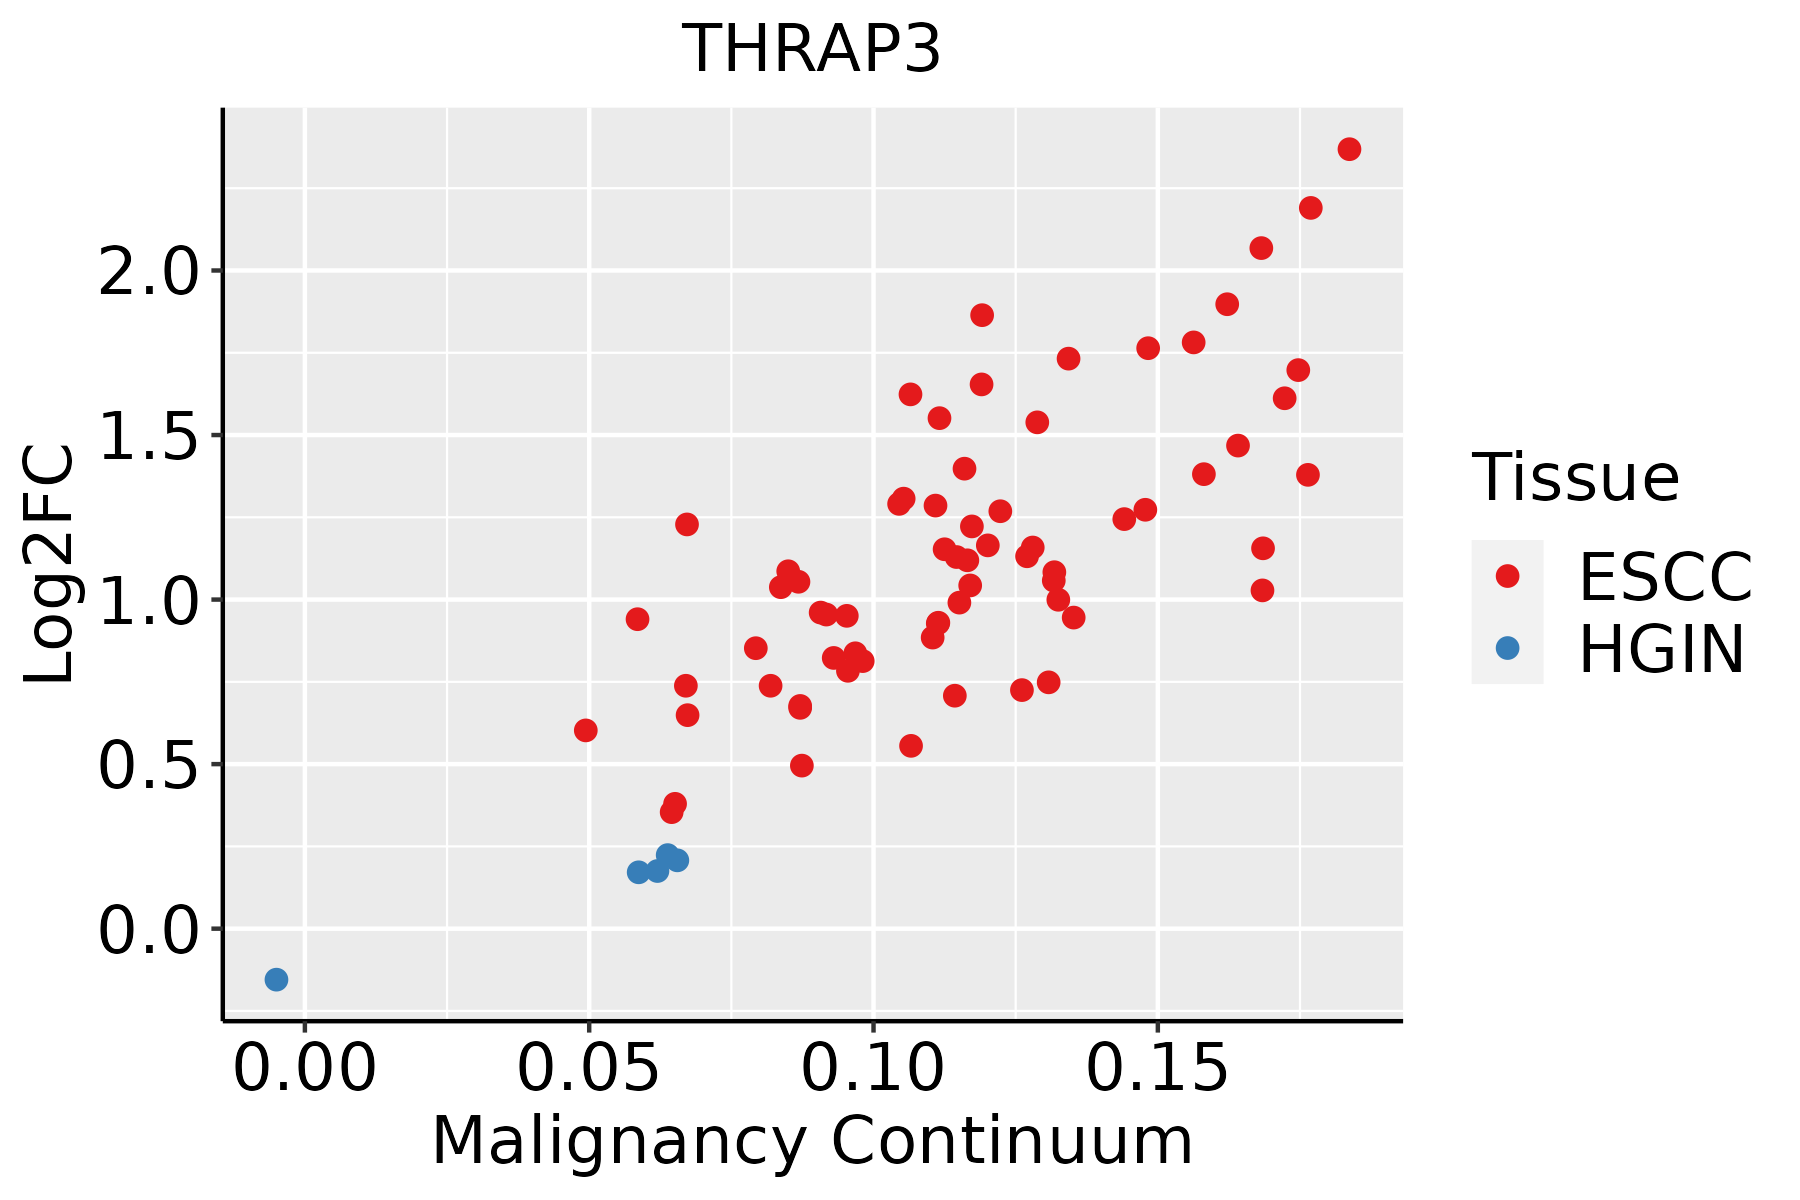
ESCC: Esophageal squamous cell carcinoma
HGIN: High-grade intraepithelial neoplasias
LGIN: Low-grade intraepithelial neoplasias
LiverThe image shows the transcriptomic changes along malignancy continuum.log2FC in expression of this searched gene in stem-like cells from each diseased tissue sample relative to stem-like cells in normal samples in each tissue plotted against the malignancy continuum. Samples are colored based on if they are from different disease stage.
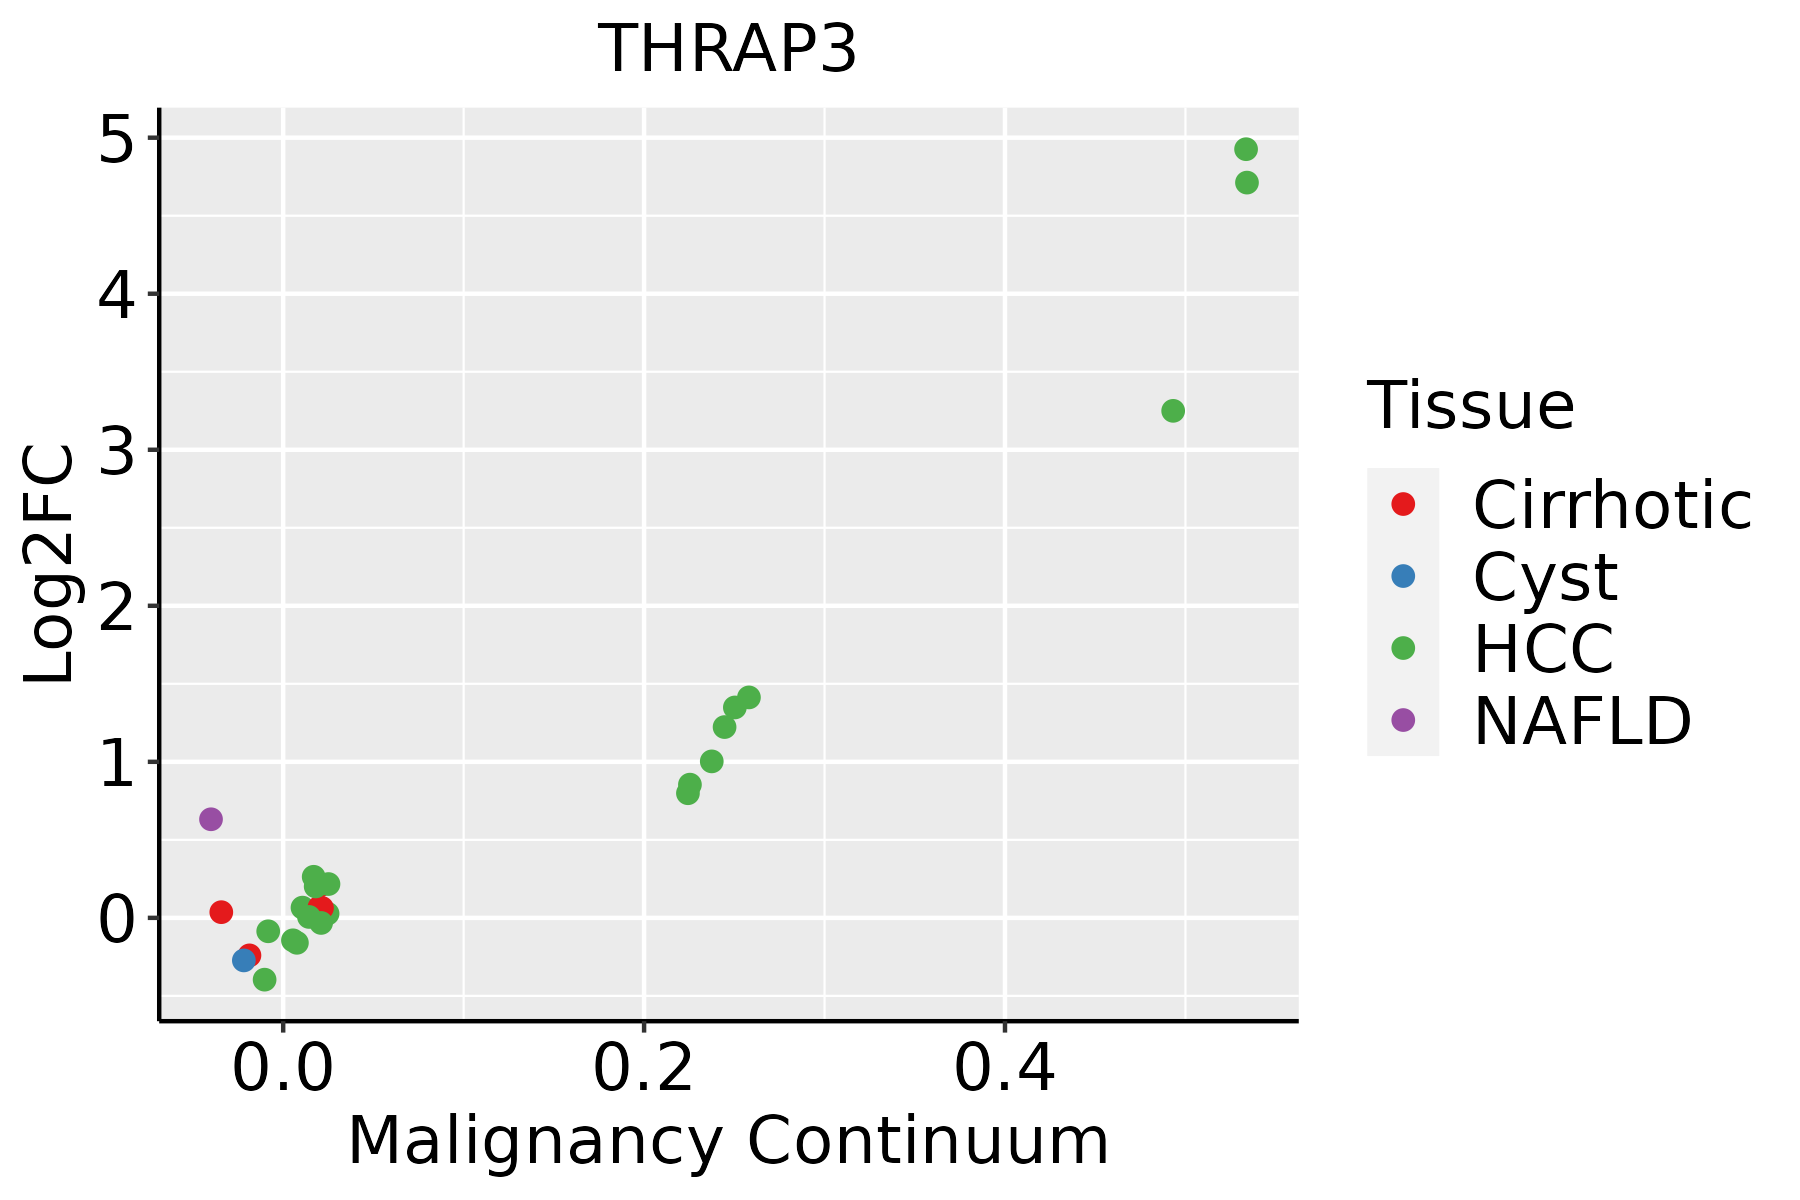
HCC: Hepatocellular carcinoma
NAFLD: Non-alcoholic fatty liver disease
LungThe image shows the transcriptomic changes along malignancy continuum.log2FC in expression of this searched gene in stem-like cells from each diseased tissue sample relative to stem-like cells in normal samples in each tissue plotted against the malignancy continuum. Samples are colored based on if they are from different disease stage.AAH: Atypical adenomatous hyperplasia
AIS: Adenocarcinoma in situ
IAC: Invasive lung adenocarcinoma
MIA: Minimally invasive adenocarcinoma
Oral CavityThe image shows the transcriptomic changes along malignancy continuum.log2FC in expression of this searched gene in stem-like cells from each diseased tissue sample relative to stem-like cells in normal samples in each tissue plotted against the malignancy continuum. Samples are colored based on if they are from different disease stage.EOLP: Erosive Oral lichen planus
LP: leukoplakia
NEOLP: Non-erosive oral lichen planus
OSCC: Oral squamous cell carcinoma
ProstateThe image shows the transcriptomic changes along malignancy continuum.log2FC in expression of this searched gene in stem-like cells from each diseased tissue sample relative to stem-like cells in normal samples in each tissue plotted against the malignancy continuum. Samples are colored based on if they are from different disease stage.BPH: Benign Prostatic Hyperplasia
SkinThe image shows the transcriptomic changes along malignancy continuum.log2FC in expression of this searched gene in stem-like cells from each diseased tissue sample relative to stem-like cells in normal samples in each tissue plotted against the malignancy continuum. Samples are colored based on if they are from different disease stage.AK: Actinic keratosis
cSCC: Cutaneous squamous cell carcinoma
SCCIS:squamous cell carcinoma in situ
ThyroidThe image shows the transcriptomic changes along malignancy continuum.log2FC in expression of this searched gene in stem-like cells from each diseased tissue sample relative to stem-like cells in normal samples in each tissue plotted against the malignancy continuum. Samples are colored based on if they are from different disease stage.
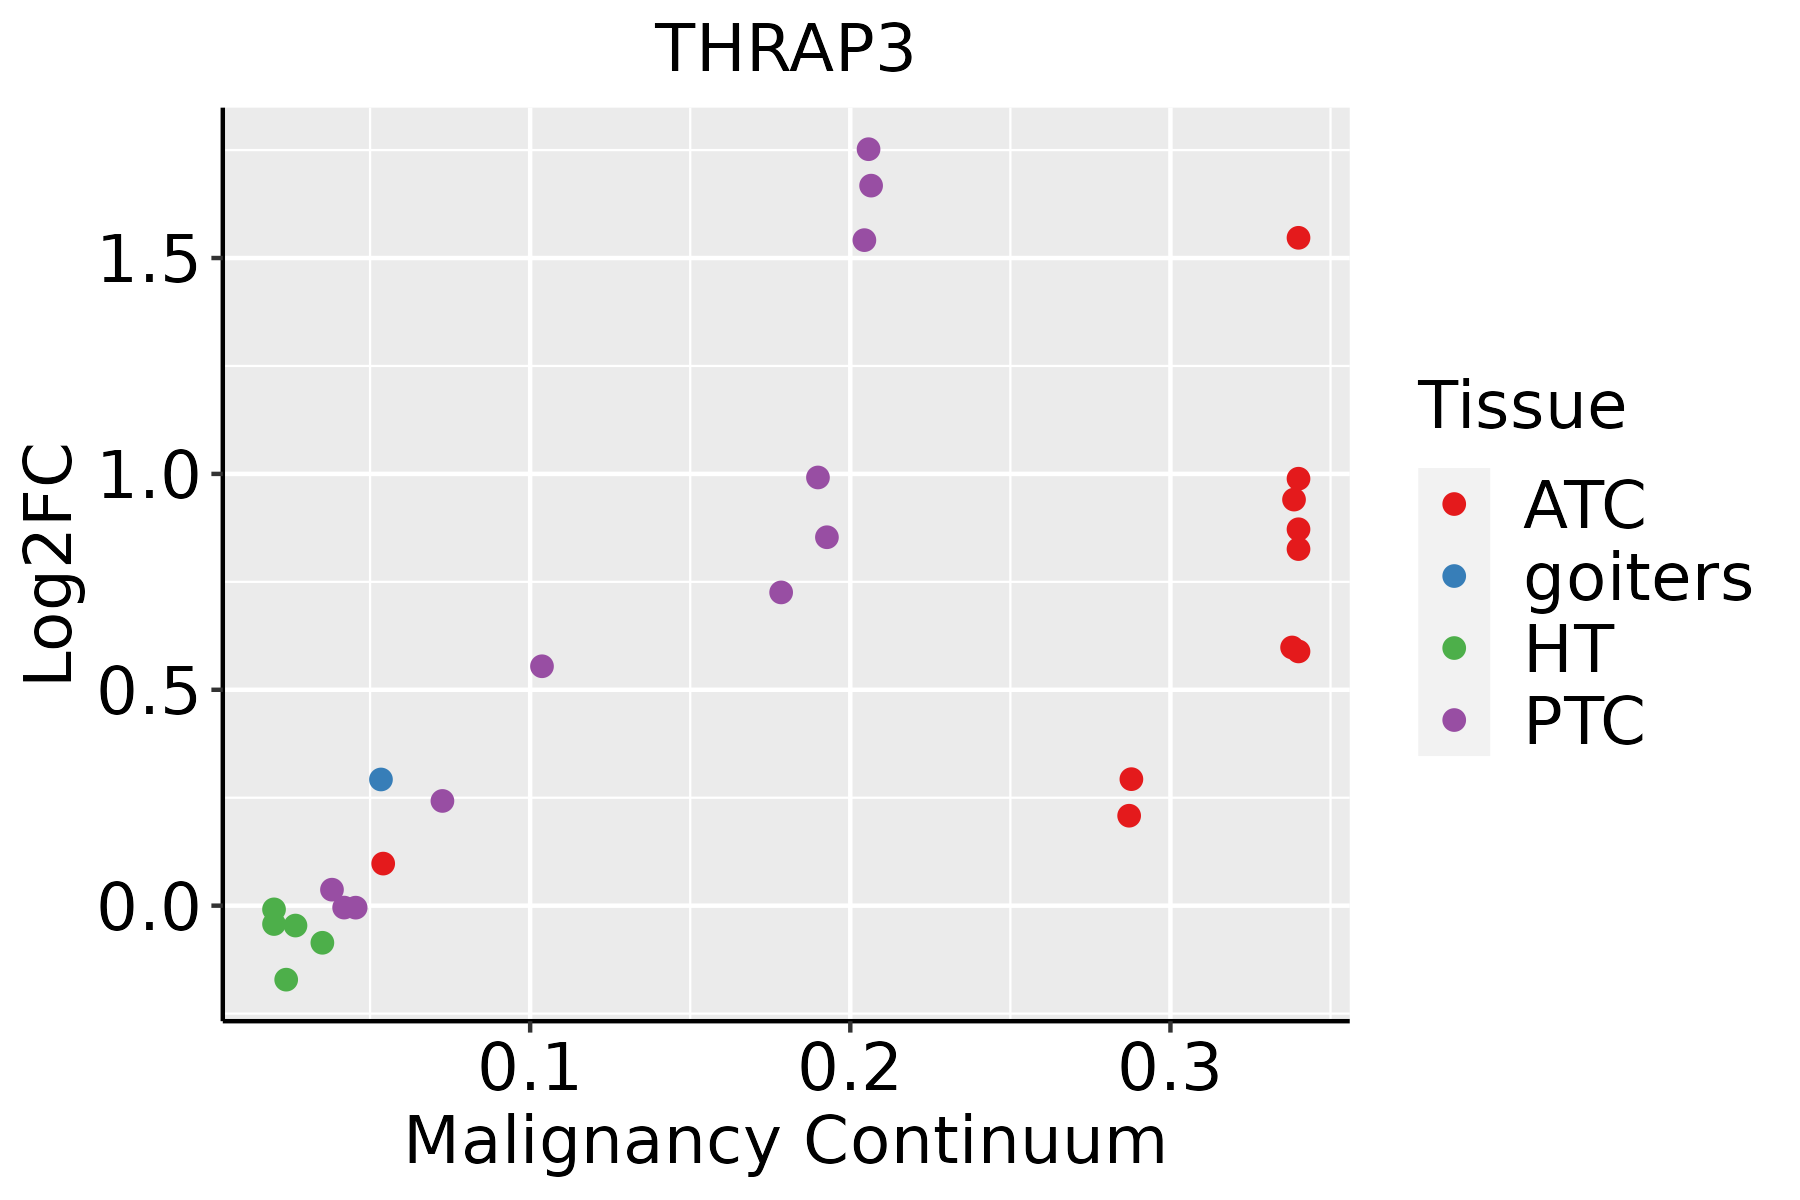
ATC: Anaplastic thyroid cancer
HT: Hashimoto's thyroiditis
PTC: Papillary thyroid cancer
∗log2FC in expression of this searched gene in stem-like cells from each diseased tissue sample relative to stem-like cells in normal samples in each tissue plotted against the malignancy continuum. Samples are colored based on if they are from different disease stage.

Top

Malignant transformation related pathway analysis

check buttonFind out the enriched GO biological processes and KEGG pathways involved in transition from healthy to precancer to cancer
check button Figure of enriched GO biological processes.
TissueDisease StageEnriched GO biological Processes
ColorectumADGO analysis - Figure of enriched GO biological processes: Top 15 enriched GO BP terms are showed in the bar plot of each disease state in each tissue. Each row represents a significant GO biological process which is colored according to the -log10(p.adjust).
ColorectumSERGO analysis - Figure of enriched GO biological processes: Top 15 enriched GO BP terms are showed in the bar plot of each disease state in each tissue. Each row represents a significant GO biological process which is colored according to the -log10(p.adjust).
ColorectumMSSGO analysis - Figure of enriched GO biological processes: Top 15 enriched GO BP terms are showed in the bar plot of each disease state in each tissue. Each row represents a significant GO biological process which is colored according to the -log10(p.adjust).
ColorectumMSI-HGO analysis - Figure of enriched GO biological processes: Top 15 enriched GO BP terms are showed in the bar plot of each disease state in each tissue. Each row represents a significant GO biological process which is colored according to the -log10(p.adjust).
ColorectumFAPGO analysis - Figure of enriched GO biological processes: Top 15 enriched GO BP terms are showed in the bar plot of each disease state in each tissue. Each row represents a significant GO biological process which is colored according to the -log10(p.adjust).
∗Top 15 enriched GO BP terms are showed in the bar plot of each disease state in each tissue. Each row represents a significant GO biological process which is colored according to the -log10(p.adjust).
Page: 1 2 3 4 5 6 7 8 9 

check button Enriched GO biological processes.
GO IDTissueDisease StageDescriptionGene RatioBg Ratiopvaluep.adjustCount
GO:004802632Oral cavityNEOLPpositive regulation of mRNA splicing, via spliceosome11/200522/187234.74e-061.01e-0411
GO:003465531Oral cavityNEOLPnucleobase-containing compound catabolic process73/2005407/187236.69e-061.34e-0473
GO:003133034Oral cavityNEOLPnegative regulation of cellular catabolic process52/2005262/187238.04e-061.57e-0452
GO:005068531Oral cavityNEOLPpositive regulation of mRNA processing13/200532/187231.14e-052.10e-0413
GO:000989533Oral cavityNEOLPnegative regulation of catabolic process59/2005320/187232.16e-053.57e-0459
GO:004670031Oral cavityNEOLPheterocycle catabolic process75/2005445/187234.61e-056.38e-0475
GO:000762322Oral cavityNEOLPcircadian rhythm42/2005210/187234.77e-056.58e-0442
GO:190237313Oral cavityNEOLPnegative regulation of mRNA catabolic process18/200563/187237.26e-059.41e-0418
GO:190236931Oral cavityNEOLPnegative regulation of RNA catabolic process20/200575/187238.63e-051.07e-0320
GO:000095631Oral cavityNEOLPnuclear-transcribed mRNA catabolic process26/2005112/187231.06e-041.28e-0326
GO:004427031Oral cavityNEOLPcellular nitrogen compound catabolic process74/2005451/187231.24e-041.47e-0374
GO:001943931Oral cavityNEOLParomatic compound catabolic process75/2005467/187232.22e-042.34e-0375
GO:004348914Oral cavityNEOLPRNA stabilization17/200565/187233.68e-043.49e-0317
GO:190136131Oral cavityNEOLPorganic cyclic compound catabolic process77/2005495/187234.96e-044.40e-0377
GO:004825514Oral cavityNEOLPmRNA stabilization15/200556/187236.08e-045.23e-0315
GO:190331116ProstateBPHregulation of mRNA metabolic process111/3107288/187232.28e-191.17e-16111
GO:000838018ProstateBPHRNA splicing147/3107434/187235.17e-192.29e-16147
GO:004348418ProstateBPHregulation of RNA splicing71/3107148/187236.14e-192.53e-1671
GO:005068415ProstateBPHregulation of mRNA processing64/3107137/187231.73e-163.82e-1464
GO:000037517ProstateBPHRNA splicing, via transesterification reactions114/3107324/187232.19e-164.53e-14114
Page: 1 2 3 4 5 6 7 8 9 10 11 12 13 14 15 16 17 18 19 20 21 22 23 24 25 26 27 28 29 30 31 32 33 34 35 36 37 38 

check button Enriched KEGG pathways.
Pathway IDTissueDisease StageDescriptionGene RatioBg Ratiopvaluep.adjustqvalueCount
Page: 1 

Top

Cell-cell communication analysis

check buttonIdentification of potential cell-cell interactions between two cell types and their ligand-receptor pairs for different disease states
LigandReceptorLRpairPathwayTissueDisease Stage
Page: 1 

Top

Single-cell gene regulatory network inference analysis

check buttonFind out the significant the regulons (TFs) and the target genes of each regulon across cell types for different disease states
TFCell TypeTissueDisease StageTarget GeneRSSRegulon Activity
∗The dot plots of a searched regulon are shown for all cell subpopulations in each disease state of each tissue based on the regulon specific score inferred using pySCENIC and by calculating the average expression.
Page: 1 

Top

Somatic mutation of malignant transformation related genes

check buttonAnnotation of somatic variants for genes involved in malignant transformation
Hugo SymbolVariant ClassVariant ClassificationdbSNP RSHGVScHGVSpHGVSp ShortSWISSPROTBIOTYPESIFTPolyPhenTumor Sample BarcodeTissueHistologySexAgeStageTherapy TypesDrugsOutcome
THRAP3SNVMissense_Mutationnovelc.953N>Ap.Gly318Aspp.G318DQ9Y2W1protein_codingtolerated(0.22)benign(0.215)TCGA-A7-A6VX-01Breastbreast invasive carcinomaFemale>=65I/IIChemotherapydocetaxelCR
THRAP3SNVMissense_Mutationc.2428N>Ap.Asp810Asnp.D810NQ9Y2W1protein_codingtolerated(0.69)possibly_damaging(0.873)TCGA-A8-A07B-01Breastbreast invasive carcinomaFemale>=65I/IIUnknownUnknownSD
THRAP3SNVMissense_Mutationc.869N>Ap.Gly290Aspp.G290DQ9Y2W1protein_codingtolerated(0.07)possibly_damaging(0.726)TCGA-BH-A0HF-01Breastbreast invasive carcinomaFemale>=65I/IIHormone TherapyarimidexSD
THRAP3SNVMissense_Mutationc.880N>Gp.Gln294Glup.Q294EQ9Y2W1protein_codingtolerated(0.12)possibly_damaging(0.79)TCGA-BH-A1EV-01Breastbreast invasive carcinomaFemale<65III/IVUnknownUnknownPD
THRAP3SNVMissense_Mutationc.144N>Cp.Arg48Serp.R48SQ9Y2W1protein_codingdeleterious_low_confidence(0)probably_damaging(0.994)TCGA-BH-A1FU-01Breastbreast invasive carcinomaFemale<65I/IIUnknownUnknownPD
THRAP3SNVMissense_Mutationrs749716914c.2080G>Ap.Asp694Asnp.D694NQ9Y2W1protein_codingdeleterious(0.02)possibly_damaging(0.709)TCGA-C8-A131-01Breastbreast invasive carcinomaFemale>=65III/IVChemotherapy5-fluorouracilCR
THRAP3SNVMissense_Mutationc.2081A>Tp.Asp694Valp.D694VQ9Y2W1protein_codingdeleterious(0)possibly_damaging(0.848)TCGA-C8-A131-01Breastbreast invasive carcinomaFemale>=65III/IVChemotherapy5-fluorouracilCR
THRAP3SNVMissense_Mutationc.302N>Cp.Arg101Prop.R101PQ9Y2W1protein_codingdeleterious(0.01)probably_damaging(0.998)TCGA-D8-A1XK-01Breastbreast invasive carcinomaFemale<65I/IIChemotherapydoxorubicine+cyclophosphamideSD
THRAP3SNVMissense_Mutationc.1403N>Tp.Ser468Leup.S468LQ9Y2W1protein_codingtolerated(0.67)benign(0.15)TCGA-E2-A9RU-01Breastbreast invasive carcinomaFemale>=65III/IVHormone TherapyarimidexSD
THRAP3SNVMissense_Mutationc.320A>Cp.Tyr107Serp.Y107SQ9Y2W1protein_codingdeleterious(0.01)probably_damaging(0.918)TCGA-E9-A1N8-01Breastbreast invasive carcinomaFemale<65I/IIChemotherapydoxorubicinSD
Page: 1 2 3 4 5 6 7 8 9 10 11 12 

Top

Related drugs of malignant transformation related genes

check buttonIdentification of chemicals and drugs interact with genes involved in malignant transfromation
(DGIdb 4.0)
Entrez IDSymbolCategoryInteraction TypesDrug Claim NameDrug NamePMIDs
Page: 1