
|
|||||
|
 | |
| |
| |
| |
| |
| |
|
Gene: RORA |
Gene summary for RORA |
| Gene information | Species | Human | Gene symbol | RORA | Gene ID | 6095 |
| Gene name | RAR related orphan receptor A | |
| Gene Alias | IDDECA | |
| Cytomap | 15q22.2 | |
| Gene Type | protein-coding | GO ID | GO:0001525 | UniProtAcc | A0A0C4DFP5 |
Top |
Malignant transformation analysis |
| Identification of the aberrant gene expression in precancerous and cancerous lesions by comparing the gene expression of stem-like cells in diseased tissues with normal stem cells |
| Entrez ID | Symbol | Replicates | Species | Organ | Tissue | Adj P-value | Log2FC | Malignancy |
| 6095 | RORA | CCI_2 | Human | Cervix | CC | 2.10e-10 | 9.47e-01 | 0.5249 |
| 6095 | RORA | CCI_3 | Human | Cervix | CC | 3.59e-17 | 1.06e+00 | 0.516 |
| 6095 | RORA | HTA11_3410_2000001011 | Human | Colorectum | AD | 6.57e-08 | -4.59e-01 | 0.0155 |
| 6095 | RORA | HTA11_2487_2000001011 | Human | Colorectum | SER | 1.14e-02 | -4.31e-01 | -0.1808 |
| 6095 | RORA | HTA11_3361_2000001011 | Human | Colorectum | AD | 2.29e-04 | -4.13e-01 | -0.1207 |
| 6095 | RORA | HTA11_1391_2000001011 | Human | Colorectum | AD | 1.40e-07 | -4.37e-01 | -0.059 |
| 6095 | RORA | HTA11_866_3004761011 | Human | Colorectum | AD | 8.56e-12 | -5.68e-01 | 0.096 |
| 6095 | RORA | HTA11_7663_2000001011 | Human | Colorectum | SER | 1.42e-02 | 9.58e-01 | 0.0131 |
| 6095 | RORA | HTA11_7696_3000711011 | Human | Colorectum | AD | 8.51e-13 | -5.62e-01 | 0.0674 |
| 6095 | RORA | HTA11_6818_2000001021 | Human | Colorectum | AD | 1.43e-03 | -5.05e-01 | 0.0588 |
| 6095 | RORA | HTA11_99999970781_79442 | Human | Colorectum | MSS | 8.77e-17 | -5.84e-01 | 0.294 |
| 6095 | RORA | HTA11_99999971662_82457 | Human | Colorectum | MSS | 3.75e-03 | -2.39e-01 | 0.3859 |
| 6095 | RORA | HTA11_99999974143_84620 | Human | Colorectum | MSS | 6.01e-09 | -6.17e-02 | 0.3005 |
| 6095 | RORA | F007 | Human | Colorectum | FAP | 3.44e-02 | -4.44e-01 | 0.1176 |
| 6095 | RORA | A015-C-203 | Human | Colorectum | FAP | 3.53e-02 | -1.30e-01 | -0.1294 |
| 6095 | RORA | A002-C-201 | Human | Colorectum | FAP | 2.14e-10 | -5.12e-01 | 0.0324 |
| 6095 | RORA | A002-C-203 | Human | Colorectum | FAP | 1.27e-03 | -3.39e-01 | 0.2786 |
| 6095 | RORA | A002-C-205 | Human | Colorectum | FAP | 4.66e-08 | -4.46e-01 | -0.1236 |
| 6095 | RORA | A015-C-006 | Human | Colorectum | FAP | 1.70e-05 | -4.51e-01 | -0.0994 |
| 6095 | RORA | A015-C-202 | Human | Colorectum | FAP | 1.53e-03 | 4.01e-01 | -0.0849 |
| Page: 1 2 3 4 5 6 7 8 9 |
| Tissue | Expression Dynamics | Abbreviation |
| Cervix |  | CC: Cervix cancer |
| HSIL_HPV: HPV-infected high-grade squamous intraepithelial lesions | ||
| N_HPV: HPV-infected normal cervix | ||
| Colorectum (GSE201348) |  | FAP: Familial adenomatous polyposis |
| CRC: Colorectal cancer | ||
| Colorectum (HTA11) |  | AD: Adenomas |
| SER: Sessile serrated lesions | ||
| MSI-H: Microsatellite-high colorectal cancer | ||
| MSS: Microsatellite stable colorectal cancer | ||
| Endometrium | 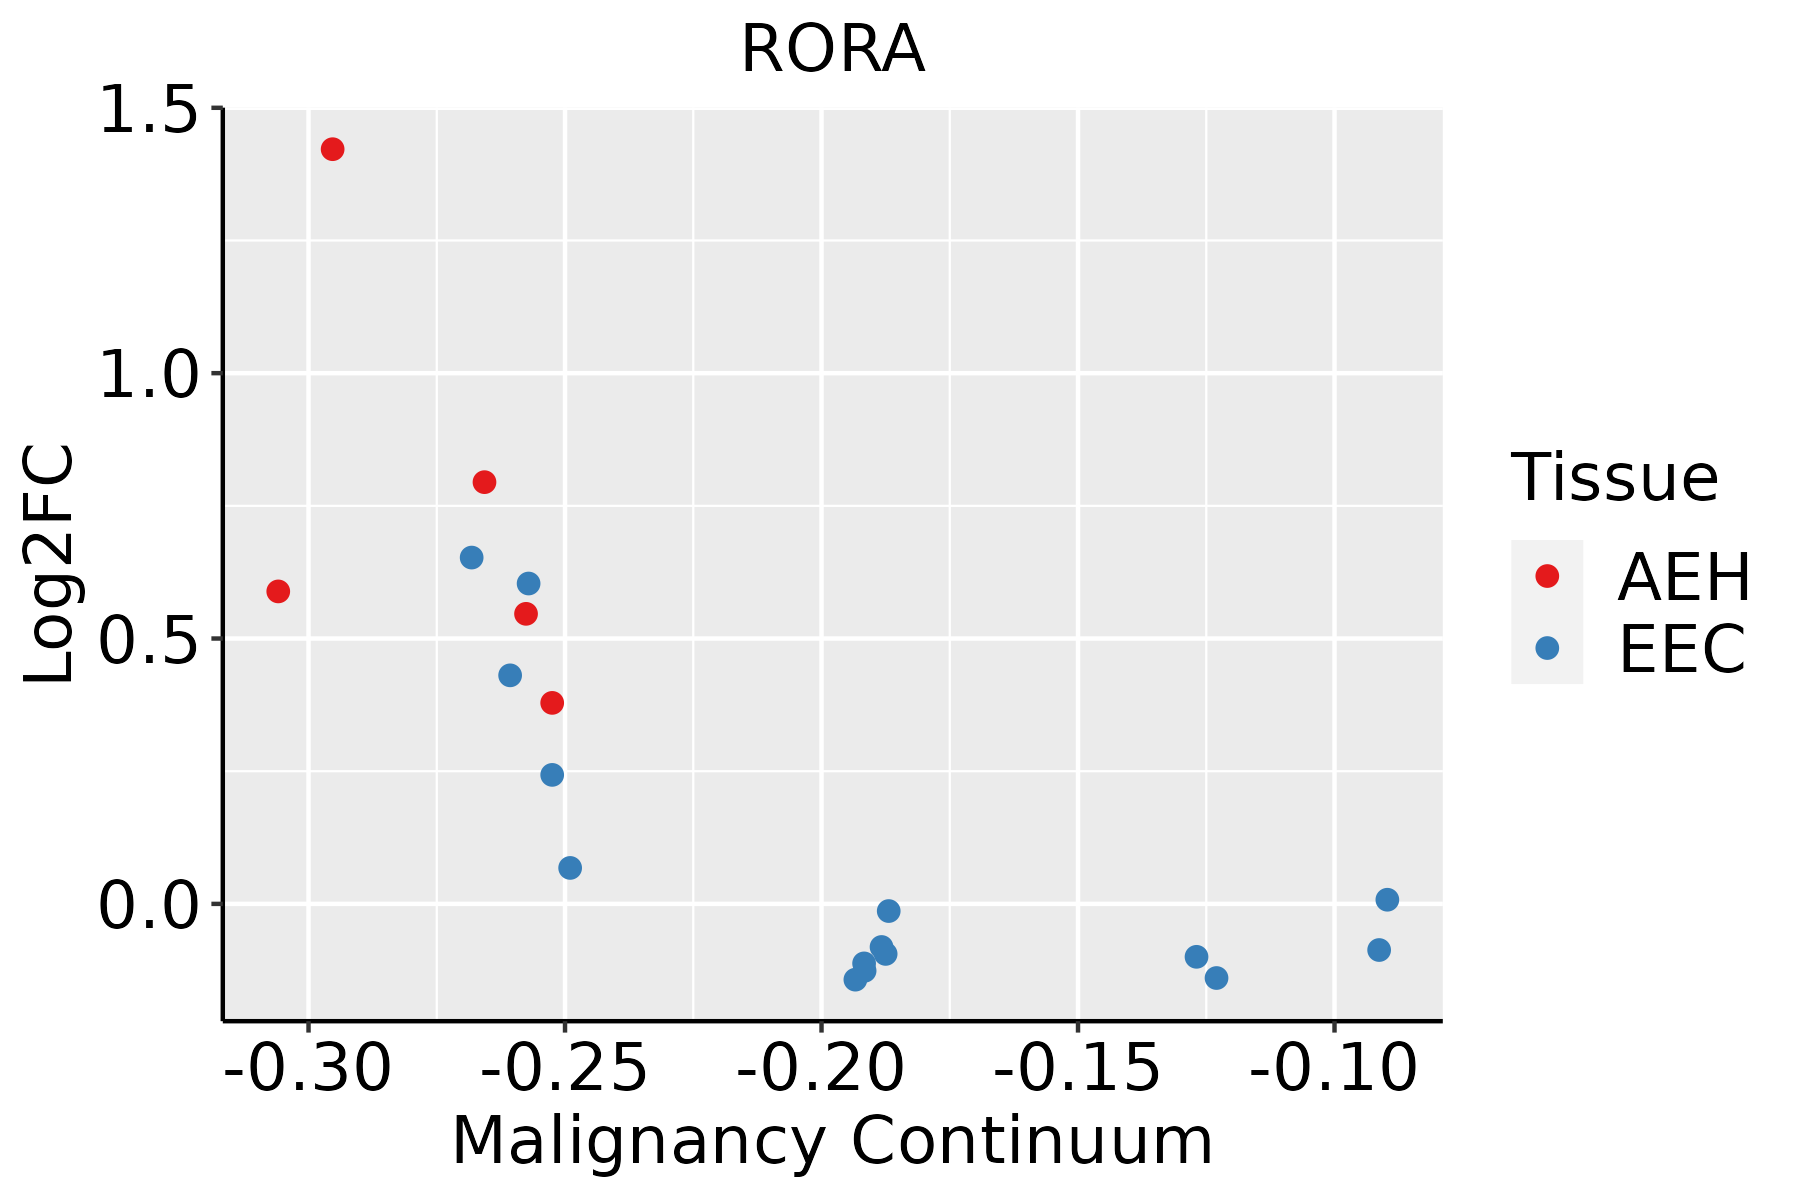 | AEH: Atypical endometrial hyperplasia |
| EEC: Endometrioid Cancer | ||
| Esophagus | 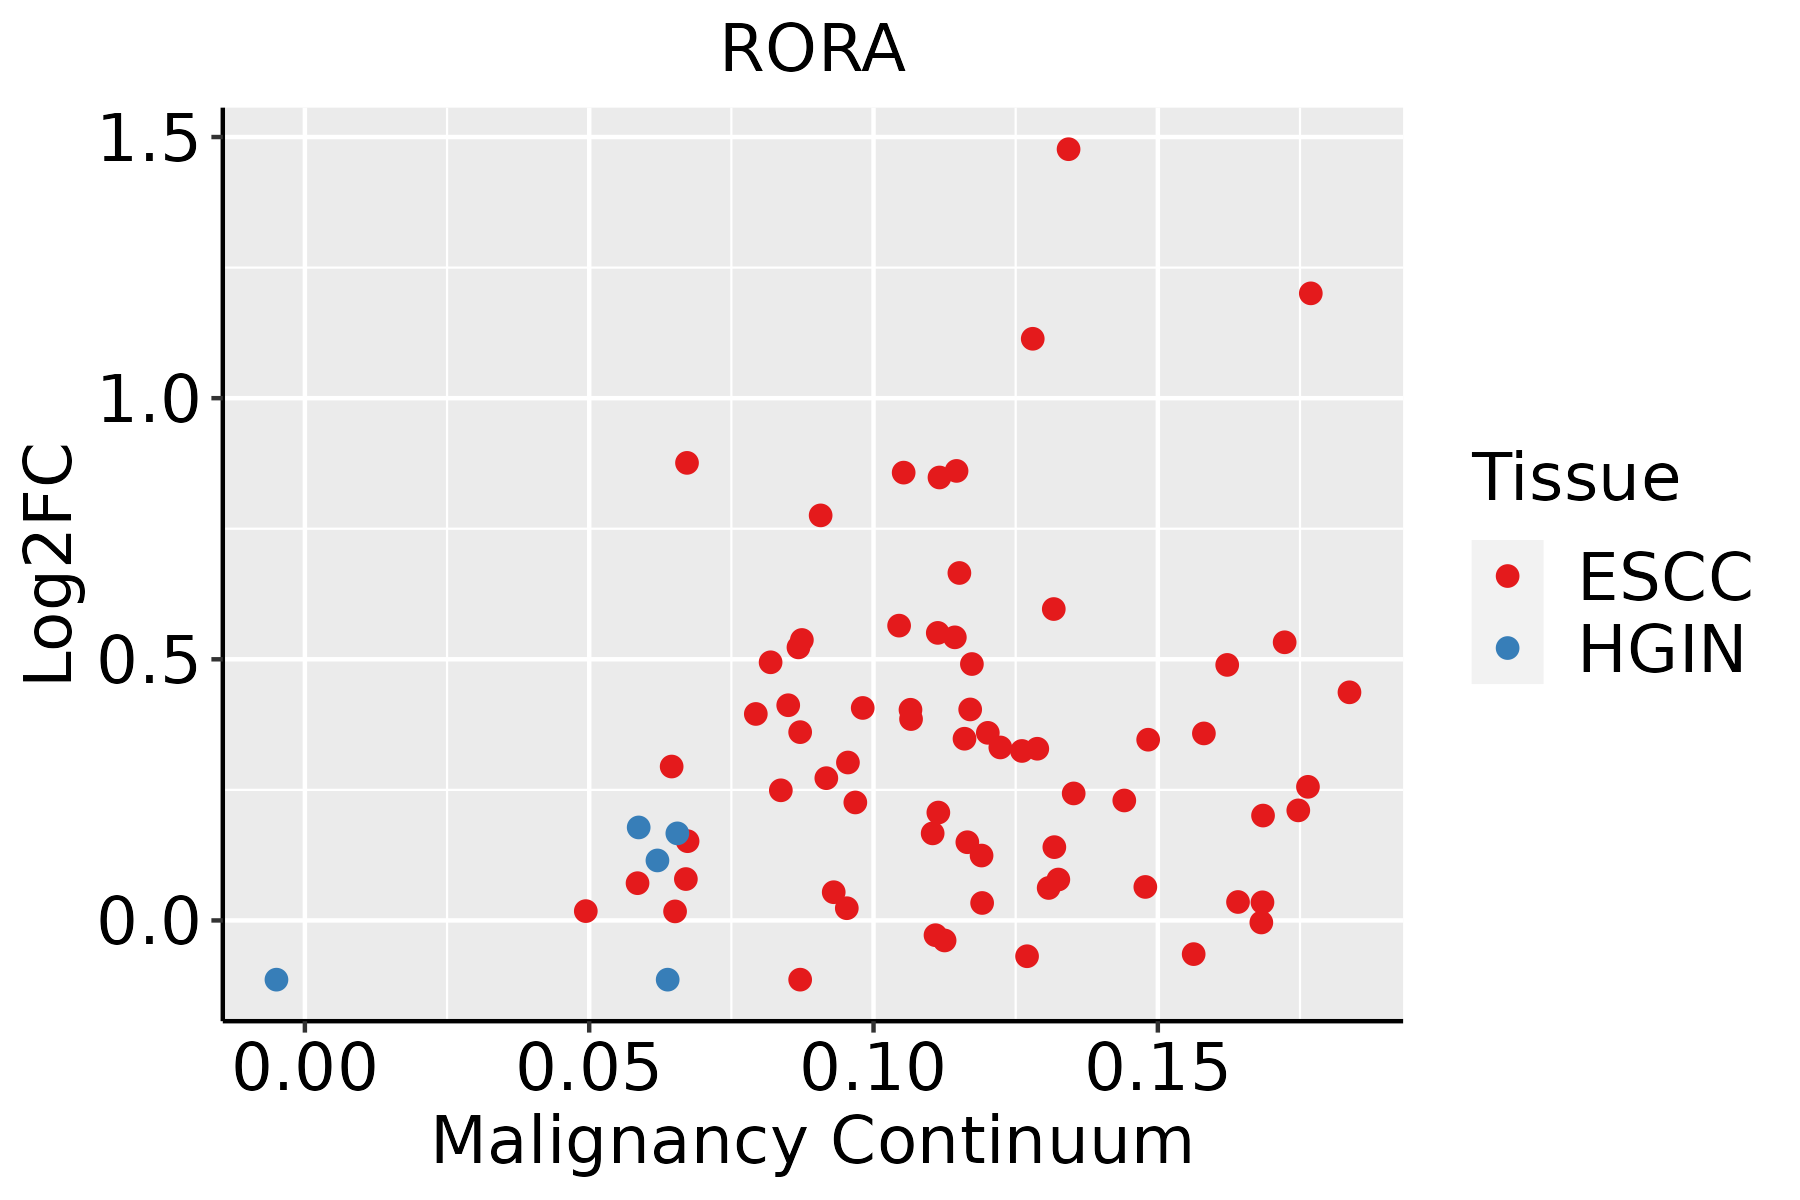 | ESCC: Esophageal squamous cell carcinoma |
| HGIN: High-grade intraepithelial neoplasias | ||
| LGIN: Low-grade intraepithelial neoplasias | ||
| Liver | 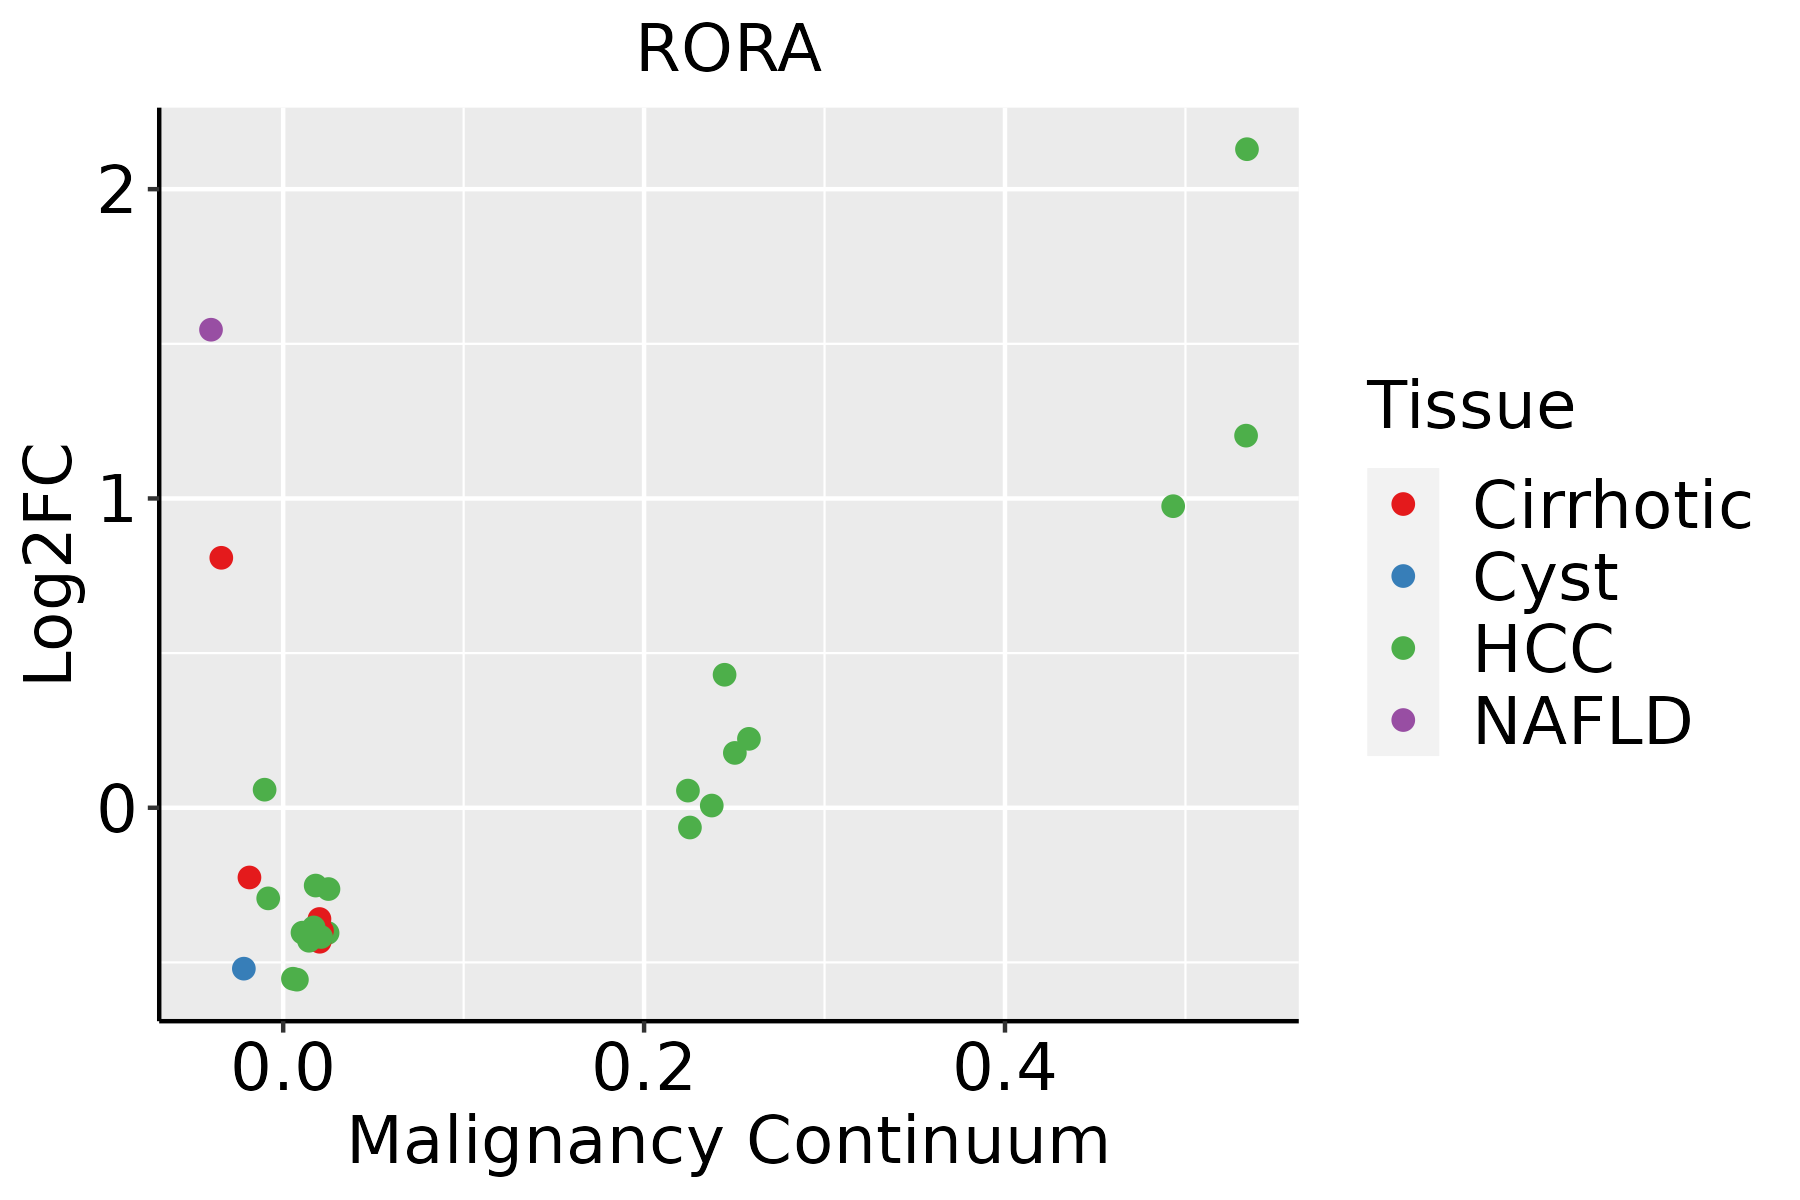 | HCC: Hepatocellular carcinoma |
| NAFLD: Non-alcoholic fatty liver disease | ||
| Lung | 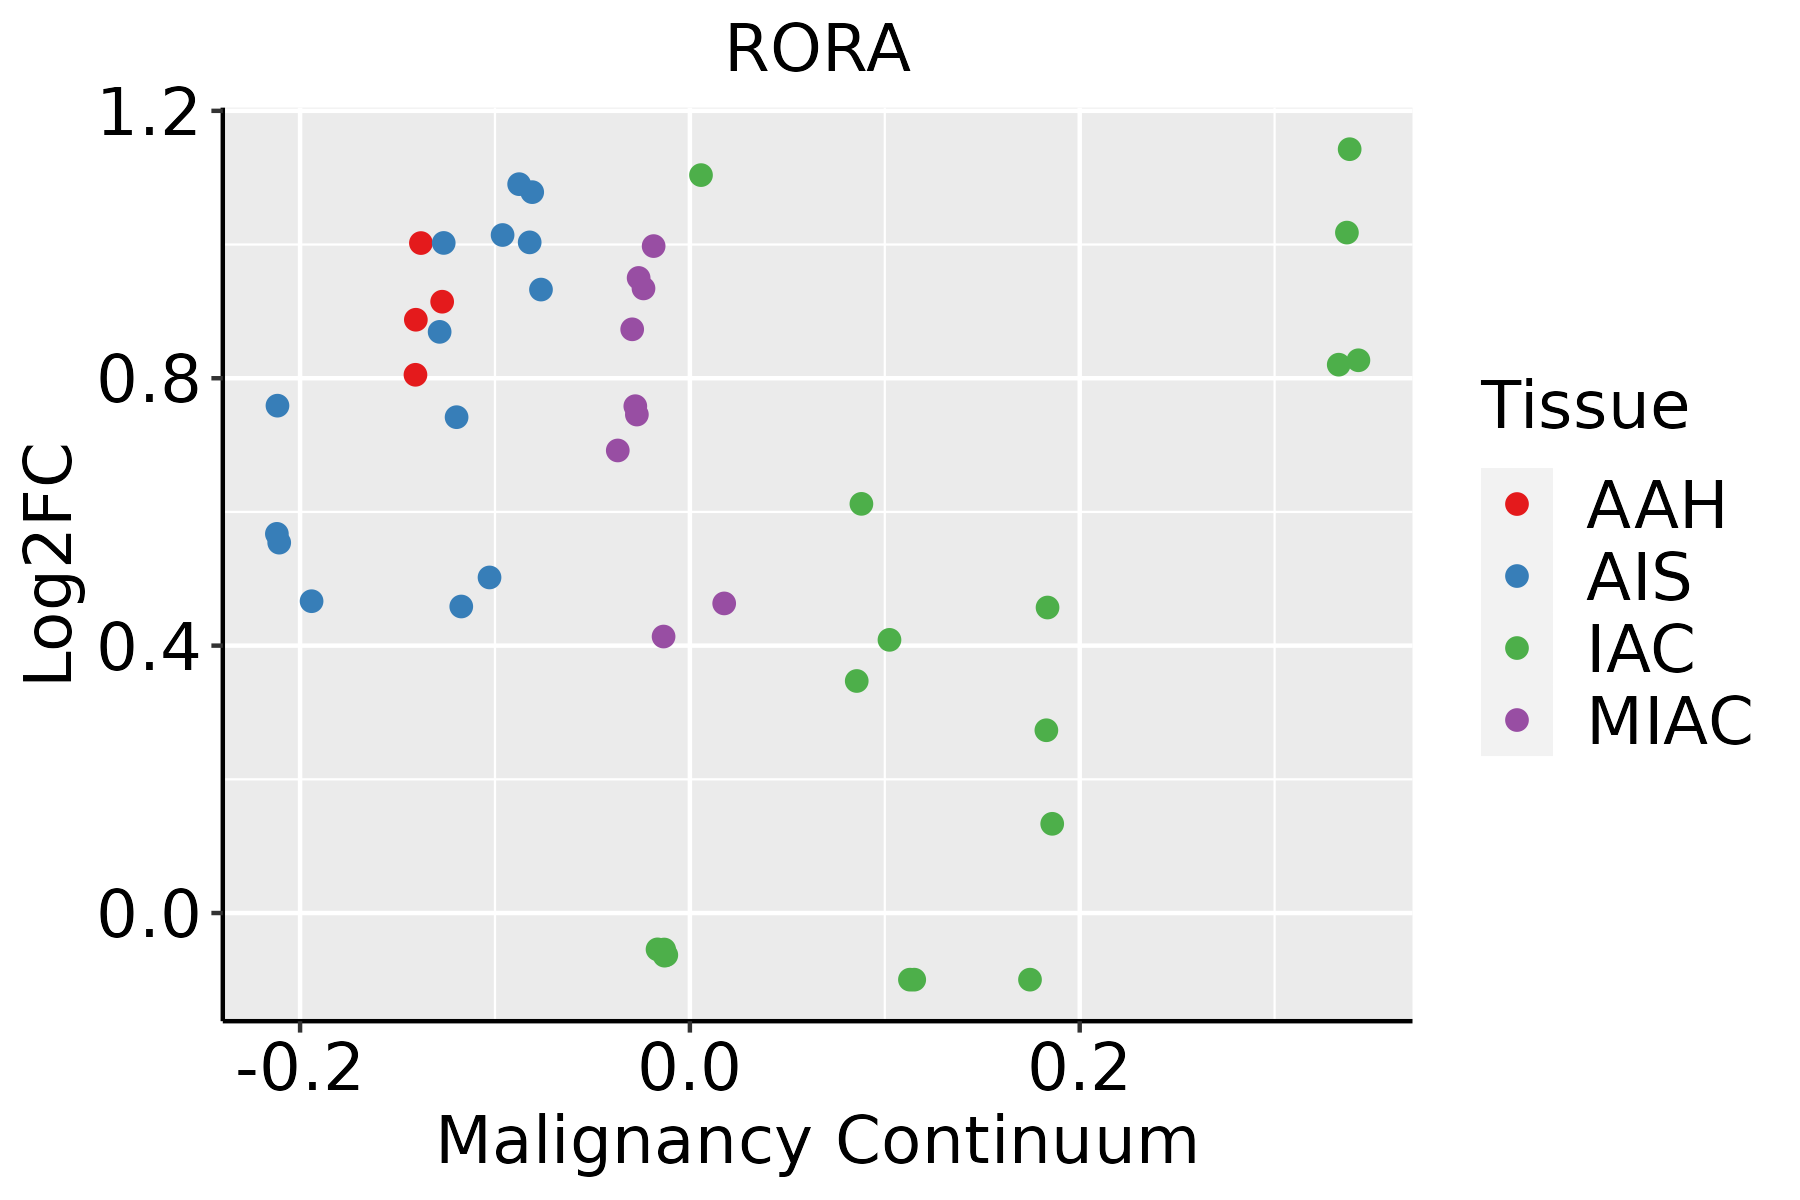 | AAH: Atypical adenomatous hyperplasia |
| AIS: Adenocarcinoma in situ | ||
| IAC: Invasive lung adenocarcinoma | ||
| MIA: Minimally invasive adenocarcinoma | ||
| Oral Cavity | 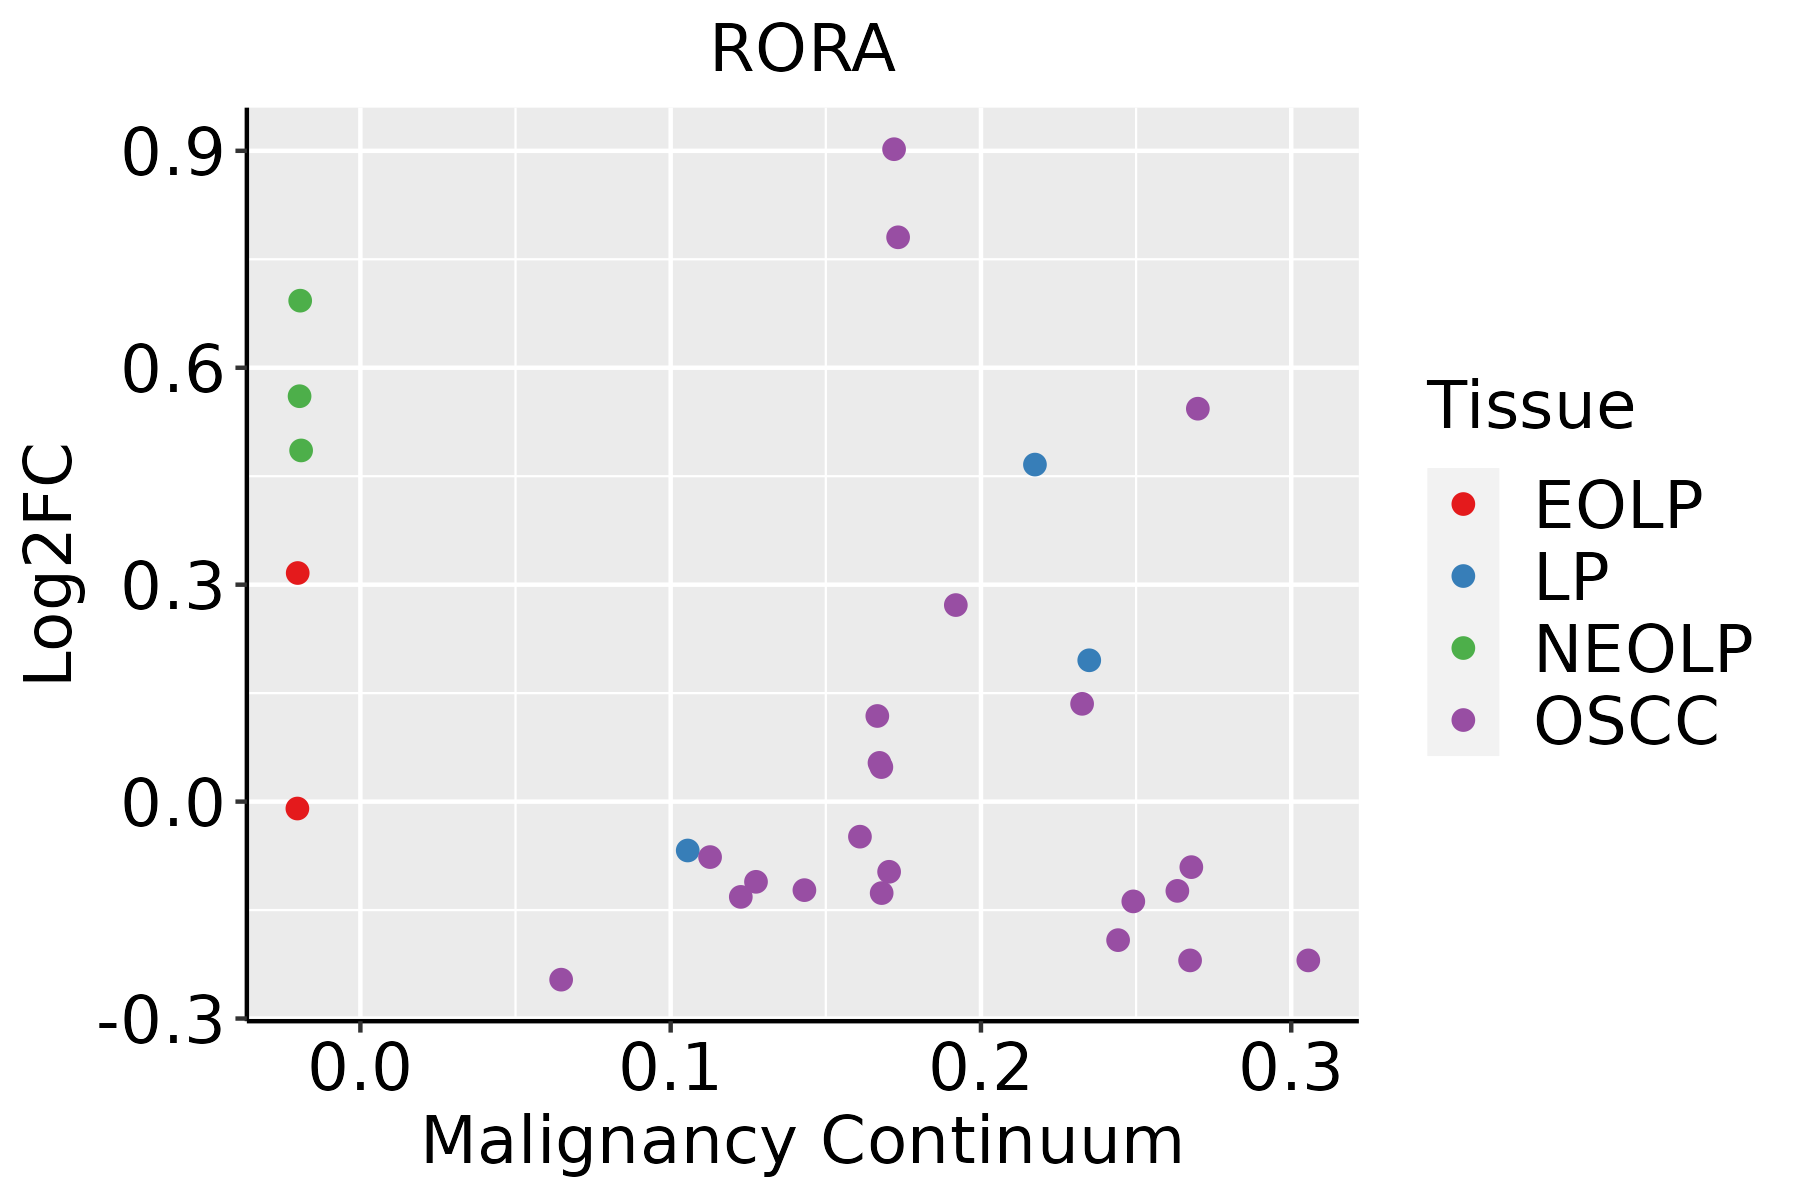 | EOLP: Erosive Oral lichen planus |
| LP: leukoplakia | ||
| NEOLP: Non-erosive oral lichen planus | ||
| OSCC: Oral squamous cell carcinoma | ||
| Prostate |  | BPH: Benign Prostatic Hyperplasia |
| Skin |  | AK: Actinic keratosis |
| cSCC: Cutaneous squamous cell carcinoma | ||
| SCCIS:squamous cell carcinoma in situ | ||
| Thyroid | 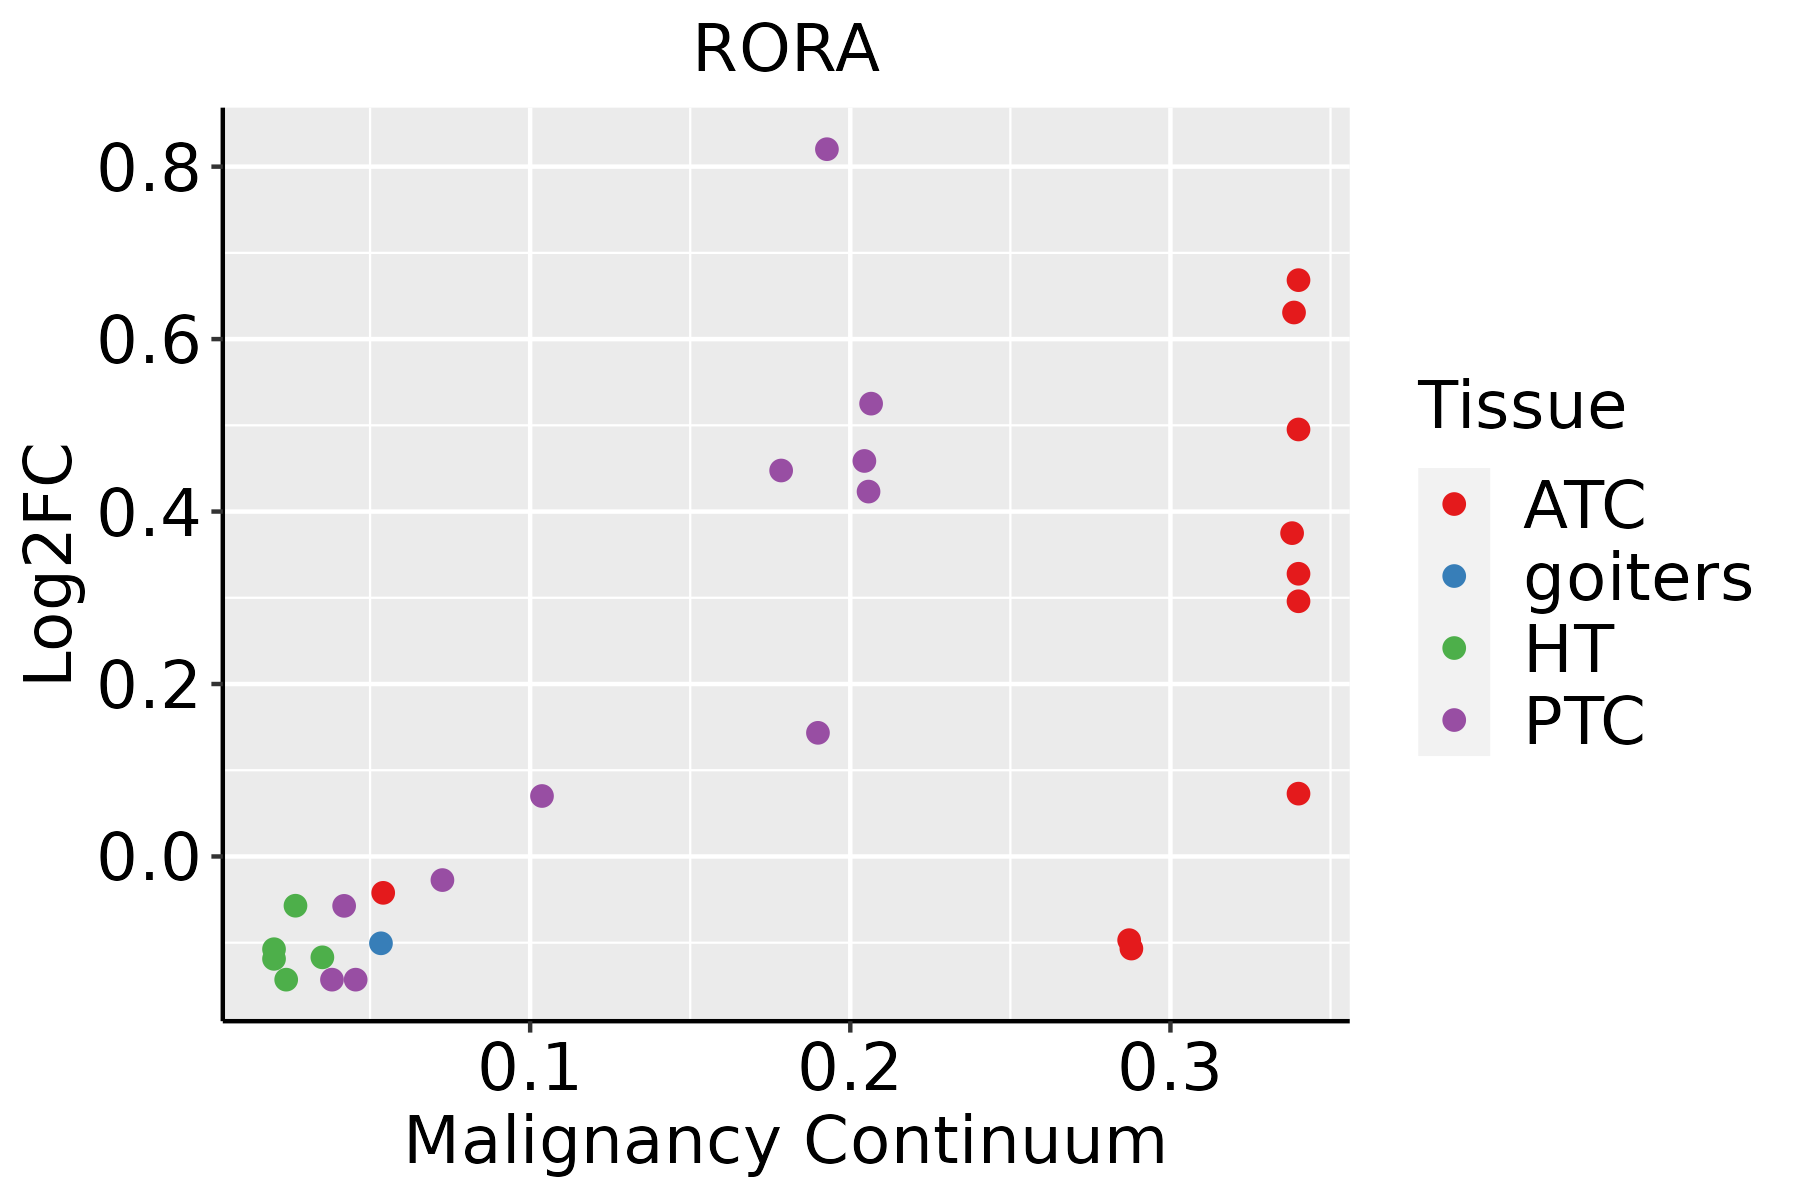 | ATC: Anaplastic thyroid cancer |
| HT: Hashimoto's thyroiditis | ||
| PTC: Papillary thyroid cancer |
| ∗log2FC in expression of this searched gene in stem-like cells from each diseased tissue sample relative to stem-like cells in normal samples in each tissue plotted against the malignancy continuum. Samples are colored based on if they are from different disease stage. |
Top |
Malignant transformation related pathway analysis |
| Find out the enriched GO biological processes and KEGG pathways involved in transition from healthy to precancer to cancer |
| Tissue | Disease Stage | Enriched GO biological Processes |
| Colorectum | AD |  |
| Colorectum | SER |  |
| Colorectum | MSS |  |
| Colorectum | MSI-H |  |
| Colorectum | FAP |  |
| ∗Top 15 enriched GO BP terms are showed in the bar plot of each disease state in each tissue. Each row represents a significant GO biological process which is colored according to the -log10(p.adjust). |
| Page: 1 2 3 4 5 6 7 8 9 |
| GO ID | Tissue | Disease Stage | Description | Gene Ratio | Bg Ratio | pvalue | p.adjust | Count |
| GO:007048224 | Oral cavity | EOLP | response to oxygen levels | 70/2218 | 347/18723 | 5.00e-06 | 1.02e-04 | 70 |
| GO:003629324 | Oral cavity | EOLP | response to decreased oxygen levels | 66/2218 | 322/18723 | 5.31e-06 | 1.07e-04 | 66 |
| GO:003021712 | Oral cavity | EOLP | T cell differentiation | 55/2218 | 257/18723 | 8.55e-06 | 1.62e-04 | 55 |
| GO:000181915 | Oral cavity | EOLP | positive regulation of cytokine production | 87/2218 | 467/18723 | 1.08e-05 | 1.92e-04 | 87 |
| GO:0043367 | Oral cavity | EOLP | CD4-positive, alpha-beta T cell differentiation | 24/2218 | 83/18723 | 2.17e-05 | 3.35e-04 | 24 |
| GO:00313482 | Oral cavity | EOLP | negative regulation of defense response | 53/2218 | 258/18723 | 4.05e-05 | 5.54e-04 | 53 |
| GO:00022633 | Oral cavity | EOLP | cell activation involved in immune response | 56/2218 | 279/18723 | 4.91e-05 | 6.47e-04 | 56 |
| GO:000762317 | Oral cavity | EOLP | circadian rhythm | 45/2218 | 210/18723 | 5.24e-05 | 6.79e-04 | 45 |
| GO:00023662 | Oral cavity | EOLP | leukocyte activation involved in immune response | 55/2218 | 275/18723 | 6.32e-05 | 7.90e-04 | 55 |
| GO:00022852 | Oral cavity | EOLP | lymphocyte activation involved in immune response | 42/2218 | 194/18723 | 7.17e-05 | 8.82e-04 | 42 |
| GO:003292221 | Oral cavity | EOLP | circadian regulation of gene expression | 20/2218 | 68/18723 | 7.88e-05 | 9.51e-04 | 20 |
| GO:00321023 | Oral cavity | EOLP | negative regulation of response to external stimulus | 75/2218 | 420/18723 | 1.74e-04 | 1.80e-03 | 75 |
| GO:0042093 | Oral cavity | EOLP | T-helper cell differentiation | 18/2218 | 66/18723 | 4.94e-04 | 4.31e-03 | 18 |
| GO:003629418 | Oral cavity | EOLP | cellular response to decreased oxygen levels | 34/2218 | 161/18723 | 5.40e-04 | 4.63e-03 | 34 |
| GO:00022864 | Oral cavity | EOLP | T cell activation involved in immune response | 26/2218 | 114/18723 | 7.06e-04 | 5.78e-03 | 26 |
| GO:007145615 | Oral cavity | EOLP | cellular response to hypoxia | 32/2218 | 151/18723 | 7.27e-04 | 5.93e-03 | 32 |
| GO:0002294 | Oral cavity | EOLP | CD4-positive, alpha-beta T cell differentiation involved in immune response | 18/2218 | 68/18723 | 7.29e-04 | 5.94e-03 | 18 |
| GO:007145318 | Oral cavity | EOLP | cellular response to oxygen levels | 36/2218 | 177/18723 | 7.88e-04 | 6.25e-03 | 36 |
| GO:0002287 | Oral cavity | EOLP | alpha-beta T cell activation involved in immune response | 18/2218 | 69/18723 | 8.79e-04 | 6.75e-03 | 18 |
| GO:0002293 | Oral cavity | EOLP | alpha-beta T cell differentiation involved in immune response | 18/2218 | 69/18723 | 8.79e-04 | 6.75e-03 | 18 |
| Page: 1 2 3 4 5 6 7 8 9 10 11 12 13 14 15 16 17 18 19 20 21 22 23 24 25 26 27 28 29 30 31 32 33 34 35 36 37 38 39 40 41 |
| Pathway ID | Tissue | Disease Stage | Description | Gene Ratio | Bg Ratio | pvalue | p.adjust | qvalue | Count |
| hsa0501716 | Cervix | CC | Spinocerebellar ataxia | 35/1267 | 143/8465 | 1.77e-03 | 7.21e-03 | 4.26e-03 | 35 |
| hsa046596 | Cervix | CC | Th17 cell differentiation | 28/1267 | 108/8465 | 1.99e-03 | 7.98e-03 | 4.72e-03 | 28 |
| hsa0501717 | Cervix | CC | Spinocerebellar ataxia | 35/1267 | 143/8465 | 1.77e-03 | 7.21e-03 | 4.26e-03 | 35 |
| hsa0465911 | Cervix | CC | Th17 cell differentiation | 28/1267 | 108/8465 | 1.99e-03 | 7.98e-03 | 4.72e-03 | 28 |
| hsa05017 | Colorectum | AD | Spinocerebellar ataxia | 60/2092 | 143/8465 | 3.78e-06 | 4.35e-05 | 2.78e-05 | 60 |
| hsa050171 | Colorectum | AD | Spinocerebellar ataxia | 60/2092 | 143/8465 | 3.78e-06 | 4.35e-05 | 2.78e-05 | 60 |
| hsa050172 | Colorectum | SER | Spinocerebellar ataxia | 46/1580 | 143/8465 | 6.78e-05 | 7.51e-04 | 5.45e-04 | 46 |
| hsa050173 | Colorectum | SER | Spinocerebellar ataxia | 46/1580 | 143/8465 | 6.78e-05 | 7.51e-04 | 5.45e-04 | 46 |
| hsa050174 | Colorectum | MSS | Spinocerebellar ataxia | 60/1875 | 143/8465 | 7.14e-08 | 1.26e-06 | 7.71e-07 | 60 |
| hsa050175 | Colorectum | MSS | Spinocerebellar ataxia | 60/1875 | 143/8465 | 7.14e-08 | 1.26e-06 | 7.71e-07 | 60 |
| hsa050178 | Colorectum | FAP | Spinocerebellar ataxia | 37/1404 | 143/8465 | 2.94e-03 | 1.29e-02 | 7.86e-03 | 37 |
| hsa050179 | Colorectum | FAP | Spinocerebellar ataxia | 37/1404 | 143/8465 | 2.94e-03 | 1.29e-02 | 7.86e-03 | 37 |
| hsa0501718 | Endometrium | AEH | Spinocerebellar ataxia | 43/1197 | 143/8465 | 5.92e-07 | 7.69e-06 | 5.63e-06 | 43 |
| hsa0501719 | Endometrium | AEH | Spinocerebellar ataxia | 43/1197 | 143/8465 | 5.92e-07 | 7.69e-06 | 5.63e-06 | 43 |
| hsa0501723 | Endometrium | EEC | Spinocerebellar ataxia | 43/1237 | 143/8465 | 1.46e-06 | 2.01e-05 | 1.50e-05 | 43 |
| hsa0501733 | Endometrium | EEC | Spinocerebellar ataxia | 43/1237 | 143/8465 | 1.46e-06 | 2.01e-05 | 1.50e-05 | 43 |
| hsa0501727 | Esophagus | HGIN | Spinocerebellar ataxia | 43/1383 | 143/8465 | 2.68e-05 | 3.64e-04 | 2.89e-04 | 43 |
| hsa05017112 | Esophagus | HGIN | Spinocerebellar ataxia | 43/1383 | 143/8465 | 2.68e-05 | 3.64e-04 | 2.89e-04 | 43 |
| hsa0501728 | Esophagus | ESCC | Spinocerebellar ataxia | 94/4205 | 143/8465 | 6.77e-05 | 2.90e-04 | 1.48e-04 | 94 |
| hsa046599 | Esophagus | ESCC | Th17 cell differentiation | 68/4205 | 108/8465 | 3.53e-03 | 9.30e-03 | 4.76e-03 | 68 |
| Page: 1 2 3 |
Top |
Cell-cell communication analysis |
| Identification of potential cell-cell interactions between two cell types and their ligand-receptor pairs for different disease states |
| Ligand | Receptor | LRpair | Pathway | Tissue | Disease Stage |
| Page: 1 |
Top |
Single-cell gene regulatory network inference analysis |
| Find out the significant the regulons (TFs) and the target genes of each regulon across cell types for different disease states |
| TF | Cell Type | Tissue | Disease Stage | Target Gene | RSS | Regulon Activity |
| RORA | BAS | Breast | DCIS | PLIN2,SERPINE1,BNIP3L, etc. | 1.27e-01 |  |
| RORA | CD8TCM | Breast | ADJ | IL7R,KLRB1,SARAF, etc. | 5.13e-01 |  |
| RORA | CD8TEXINT | Breast | DCIS | IL7R,KLRB1,SARAF, etc. | 1.57e-01 | |
| RORA | CD4TN | Breast | DCIS | IL7R,KLRB1,SARAF, etc. | 2.50e-01 | |
| RORA | TREG | Breast | DCIS | IL7R,KLRB1,SARAF, etc. | 1.55e-01 | |
| RORA | TH17 | Breast | DCIS | IL7R,KLRB1,SARAF, etc. | 4.51e-02 | |
| RORA | CD8TEXINT | Breast | Healthy | IL7R,KLRB1,SARAF, etc. | 1.28e-01 |  |
| RORA | CD8TCM | Breast | Healthy | IL7R,KLRB1,SARAF, etc. | 1.72e-01 | |
| RORA | TREG | Breast | Healthy | IL7R,KLRB1,SARAF, etc. | 4.97e-02 | |
| RORA | TREG | Breast | IDC | IL7R,KLRB1,SARAF, etc. | 1.66e-01 |  |
| ∗The dot plots of a searched regulon are shown for all cell subpopulations in each disease state of each tissue based on the regulon specific score inferred using pySCENIC and by calculating the average expression. |
| Page: 1 2 3 4 5 6 7 8 9 10 11 |
Top |
Somatic mutation of malignant transformation related genes |
| Annotation of somatic variants for genes involved in malignant transformation |
| Hugo Symbol | Variant Class | Variant Classification | dbSNP RS | HGVSc | HGVSp | HGVSp Short | SWISSPROT | BIOTYPE | SIFT | PolyPhen | Tumor Sample Barcode | Tissue | Histology | Sex | Age | Stage | Therapy Types | Drugs | Outcome |
| RORA | SNV | Missense_Mutation | novel | c.1577N>G | p.Ala526Gly | p.A526G | P35398 | protein_coding | tolerated(0.48) | benign(0.365) | TCGA-A8-A06O-01 | Breast | breast invasive carcinoma | Female | <65 | I/II | Hormone Therapy | letrozole | SD |
| RORA | SNV | Missense_Mutation | c.1625A>C | p.Glu542Ala | p.E542A | P35398 | protein_coding | deleterious(0) | probably_damaging(0.999) | TCGA-BH-A1EN-01 | Breast | breast invasive carcinoma | Female | >=65 | I/II | Unknown | Unknown | SD | |
| RORA | insertion | Nonsense_Mutation | novel | c.530_531insGGGGTATGTCTGACTTTCCTCTAATGAGTTC | p.Phe178GlyfsTer4 | p.F178Gfs*4 | P35398 | protein_coding | TCGA-BH-A0HQ-01 | Breast | breast invasive carcinoma | Female | <65 | I/II | Hormone Therapy | arimidex | SD | ||
| RORA | deletion | Frame_Shift_Del | novel | c.570delN | p.Tyr190Ter | p.Y190* | P35398 | protein_coding | TCGA-EW-A2FV-01 | Breast | breast invasive carcinoma | Female | <65 | III/IV | Chemotherapy | docetaxel | SD | ||
| RORA | SNV | Missense_Mutation | c.691N>A | p.Asp231Asn | p.D231N | P35398 | protein_coding | tolerated(0.25) | benign(0.001) | TCGA-FU-A3HZ-01 | Cervix | cervical & endocervical cancer | Female | <65 | I/II | Chemotherapy | cisplatin | CR | |
| RORA | SNV | Missense_Mutation | c.618G>C | p.Gln206His | p.Q206H | P35398 | protein_coding | tolerated(0.06) | benign(0.015) | TCGA-A6-A565-01 | Colorectum | colon adenocarcinoma | Female | <65 | III/IV | Unspecific | 5FU | PD | |
| RORA | SNV | Missense_Mutation | c.1162C>A | p.Leu388Ile | p.L388I | P35398 | protein_coding | deleterious(0.02) | probably_damaging(0.997) | TCGA-AA-A010-01 | Colorectum | colon adenocarcinoma | Female | <65 | I/II | Chemotherapy | folinic | CR | |
| RORA | SNV | Missense_Mutation | novel | c.1567N>T | p.Ala523Ser | p.A523S | P35398 | protein_coding | tolerated(0.45) | benign(0.323) | TCGA-AA-A02W-01 | Colorectum | colon adenocarcinoma | Female | >=65 | I/II | Unknown | Unknown | PD |
| RORA | SNV | Missense_Mutation | c.467N>G | p.Asn156Ser | p.N156S | P35398 | protein_coding | deleterious(0) | probably_damaging(0.999) | TCGA-NH-A5IV-01 | Colorectum | colon adenocarcinoma | Female | >=65 | I/II | Unknown | Unknown | SD | |
| RORA | SNV | Missense_Mutation | novel | c.947C>T | p.Ser316Leu | p.S316L | P35398 | protein_coding | deleterious(0) | probably_damaging(0.979) | TCGA-EI-6917-01 | Colorectum | rectum adenocarcinoma | Male | <65 | III/IV | Chemotherapy | 5fluorouracil+oxaciplatina+l-folinian | SD |
| Page: 1 2 3 4 5 6 |
Top |
Related drugs of malignant transformation related genes |
| Identification of chemicals and drugs interact with genes involved in malignant transfromation |
| (DGIdb 4.0) |
| Entrez ID | Symbol | Category | Interaction Types | Drug Claim Name | Drug Name | PMIDs |
| 6095 | RORA | DRUGGABLE GENOME, NUCLEAR HORMONE RECEPTOR, KINASE | interferon beta-1a | 31649263 | ||
| 6095 | RORA | DRUGGABLE GENOME, NUCLEAR HORMONE RECEPTOR, KINASE | agonist | 381118853 | ||
| 6095 | RORA | DRUGGABLE GENOME, NUCLEAR HORMONE RECEPTOR, KINASE | agonist | 135651223 | T091317 | |
| 6095 | RORA | DRUGGABLE GENOME, NUCLEAR HORMONE RECEPTOR, KINASE | agonist | 135651457 | CHOLESTEROL | |
| 6095 | RORA | DRUGGABLE GENOME, NUCLEAR HORMONE RECEPTOR, KINASE | citalopram | CITALOPRAM | 19846067 | |
| 6095 | RORA | DRUGGABLE GENOME, NUCLEAR HORMONE RECEPTOR, KINASE | agonist | 135651458 | ||
| 6095 | RORA | DRUGGABLE GENOME, NUCLEAR HORMONE RECEPTOR, KINASE | agonist | 178100434 | ||
| 6095 | RORA | DRUGGABLE GENOME, NUCLEAR HORMONE RECEPTOR, KINASE | agonist | 310264687 | ||
| 6095 | RORA | DRUGGABLE GENOME, NUCLEAR HORMONE RECEPTOR, KINASE | T091317 | T091317 | ||
| 6095 | RORA | DRUGGABLE GENOME, NUCLEAR HORMONE RECEPTOR, KINASE | US9598431, 3 |
| Page: 1 2 |

Copyright 2023-Present -The University of Texas Health Science Center at Houston |