
|
|||||
|
 | |
| |
| |
| |
| |
| |
|
Gene: RCC2 |
Gene summary for RCC2 |
| Gene information | Species | Human | Gene symbol | RCC2 | Gene ID | 55920 |
| Gene name | regulator of chromosome condensation 2 | |
| Gene Alias | TD-60 | |
| Cytomap | 1p36.13 | |
| Gene Type | protein-coding | GO ID | GO:0000086 | UniProtAcc | A0A024RAC5 |
Top |
Malignant transformation analysis |
| Identification of the aberrant gene expression in precancerous and cancerous lesions by comparing the gene expression of stem-like cells in diseased tissues with normal stem cells |
| Entrez ID | Symbol | Replicates | Species | Organ | Tissue | Adj P-value | Log2FC | Malignancy |
| 55920 | RCC2 | AEH-subject4 | Human | Endometrium | AEH | 2.41e-02 | 1.99e-01 | -0.2657 |
| 55920 | RCC2 | EEC-subject1 | Human | Endometrium | EEC | 2.27e-02 | -4.14e-02 | -0.2682 |
| 55920 | RCC2 | EEC-subject3 | Human | Endometrium | EEC | 2.36e-04 | -1.58e-02 | -0.2525 |
| 55920 | RCC2 | EEC-subject4 | Human | Endometrium | EEC | 6.45e-03 | -8.16e-02 | -0.2571 |
| 55920 | RCC2 | GSM5276934 | Human | Endometrium | EEC | 4.59e-03 | -1.88e-01 | -0.0913 |
| 55920 | RCC2 | GSM5276935 | Human | Endometrium | EEC | 3.63e-12 | 3.44e-01 | -0.123 |
| 55920 | RCC2 | GSM6177620_NYU_UCEC1_lib1_lib1 | Human | Endometrium | EEC | 5.74e-17 | 2.46e-01 | -0.1869 |
| 55920 | RCC2 | GSM6177620_NYU_UCEC1_lib2_lib2 | Human | Endometrium | EEC | 2.49e-15 | 2.49e-01 | -0.1875 |
| 55920 | RCC2 | GSM6177620_NYU_UCEC1_lib3_lib3 | Human | Endometrium | EEC | 1.46e-15 | 1.84e-01 | -0.1883 |
| 55920 | RCC2 | GSM6177621_NYU_UCEC2_lib1_lib1 | Human | Endometrium | EEC | 3.69e-10 | 1.11e-01 | -0.1934 |
| 55920 | RCC2 | GSM6177622_NYU_UCEC3_lib1_lib1 | Human | Endometrium | EEC | 1.68e-33 | 5.21e-01 | -0.1917 |
| 55920 | RCC2 | GSM6177622_NYU_UCEC3_lib2_lib2 | Human | Endometrium | EEC | 3.32e-22 | 3.63e-01 | -0.1916 |
| 55920 | RCC2 | GSM6177623_NYU_UCEC3_Vis | Human | Endometrium | EEC | 9.51e-28 | 6.33e-01 | -0.1269 |
| 55920 | RCC2 | LZE4T | Human | Esophagus | ESCC | 8.35e-09 | 5.98e-02 | 0.0811 |
| 55920 | RCC2 | LZE5T | Human | Esophagus | ESCC | 2.42e-03 | 5.01e-01 | 0.0514 |
| 55920 | RCC2 | LZE7T | Human | Esophagus | ESCC | 3.02e-05 | 6.62e-01 | 0.0667 |
| 55920 | RCC2 | LZE8T | Human | Esophagus | ESCC | 6.51e-06 | 6.08e-02 | 0.067 |
| 55920 | RCC2 | LZE20T | Human | Esophagus | ESCC | 1.69e-02 | 1.69e-01 | 0.0662 |
| 55920 | RCC2 | LZE22T | Human | Esophagus | ESCC | 2.74e-05 | 2.43e-01 | 0.068 |
| 55920 | RCC2 | LZE24T | Human | Esophagus | ESCC | 1.60e-09 | 2.83e-01 | 0.0596 |
| Page: 1 2 3 4 5 6 7 |
| Tissue | Expression Dynamics | Abbreviation |
| Endometrium | 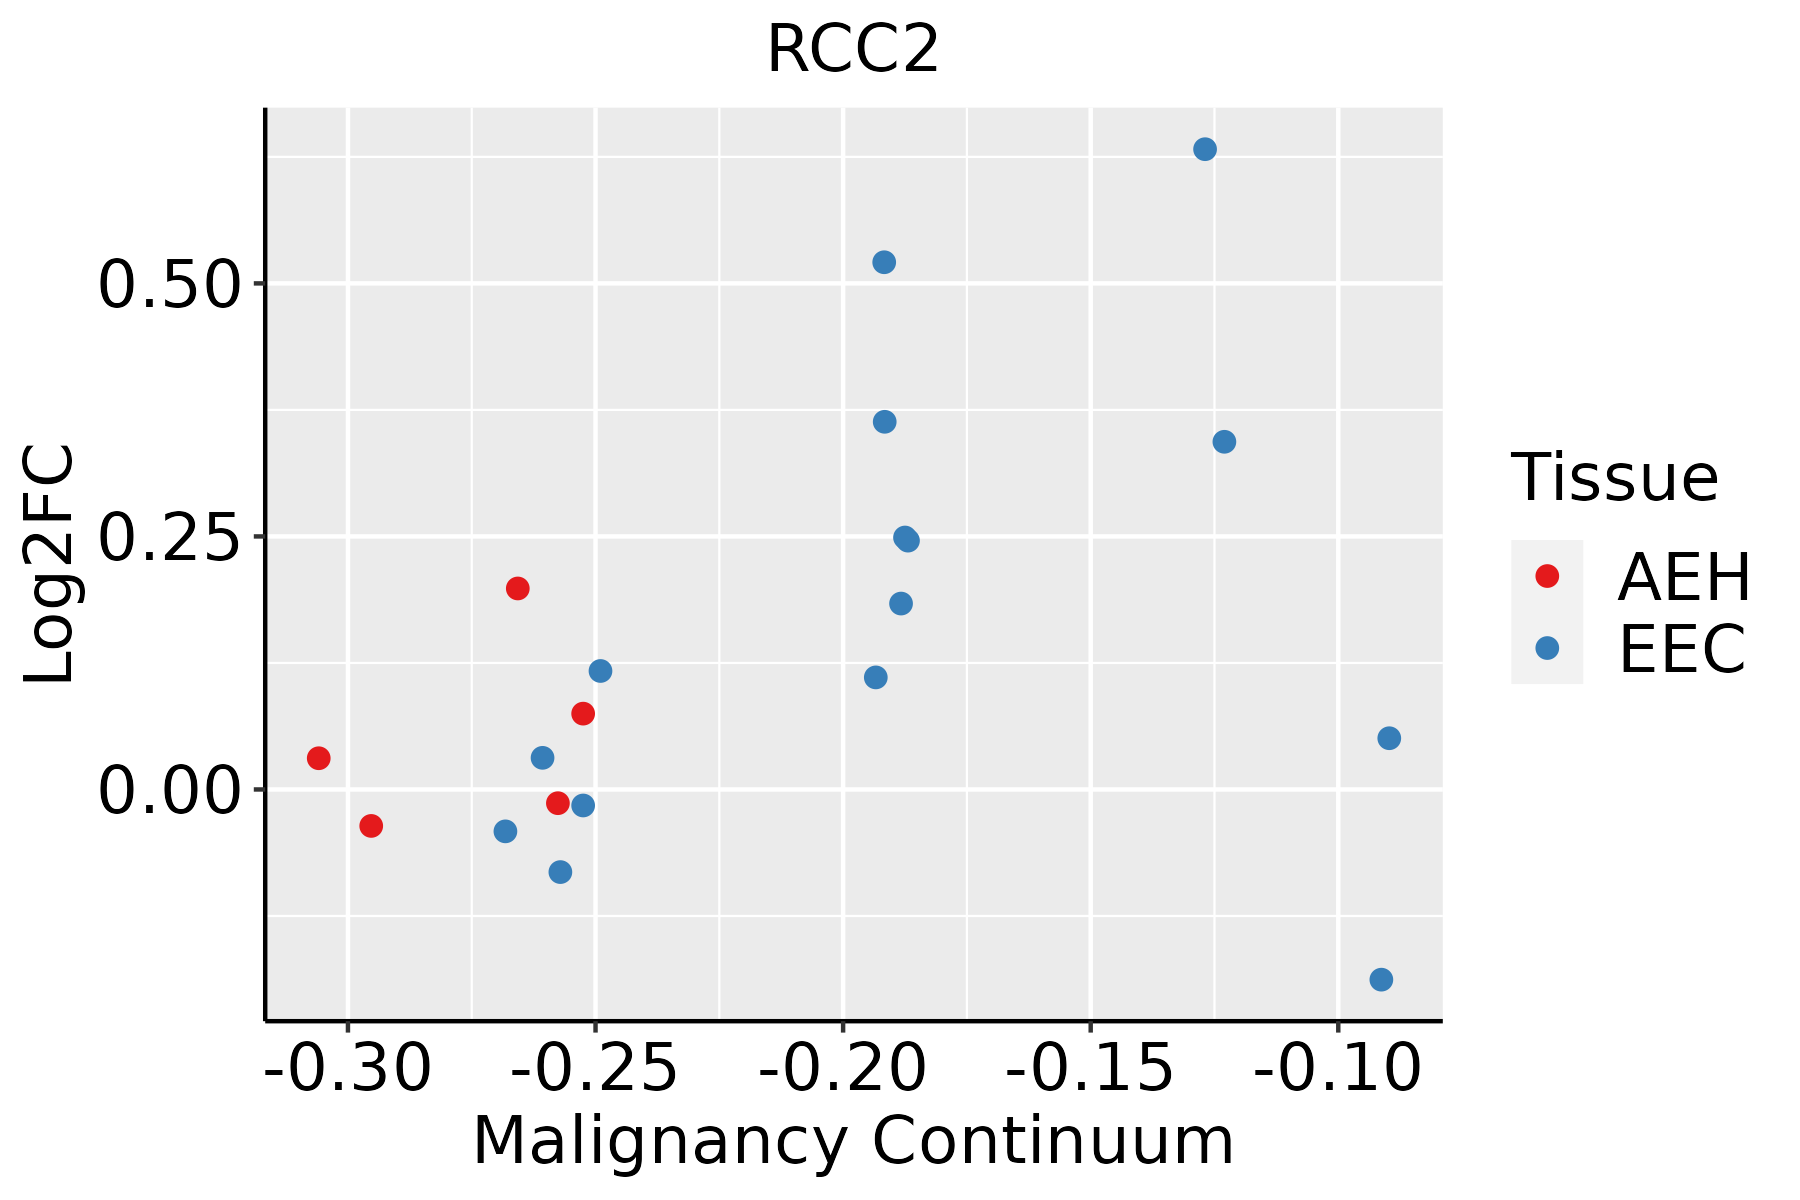 | AEH: Atypical endometrial hyperplasia |
| EEC: Endometrioid Cancer | ||
| Esophagus |  | ESCC: Esophageal squamous cell carcinoma |
| HGIN: High-grade intraepithelial neoplasias | ||
| LGIN: Low-grade intraepithelial neoplasias | ||
| Liver |  | HCC: Hepatocellular carcinoma |
| NAFLD: Non-alcoholic fatty liver disease | ||
| Oral Cavity |  | EOLP: Erosive Oral lichen planus |
| LP: leukoplakia | ||
| NEOLP: Non-erosive oral lichen planus | ||
| OSCC: Oral squamous cell carcinoma | ||
| Prostate | 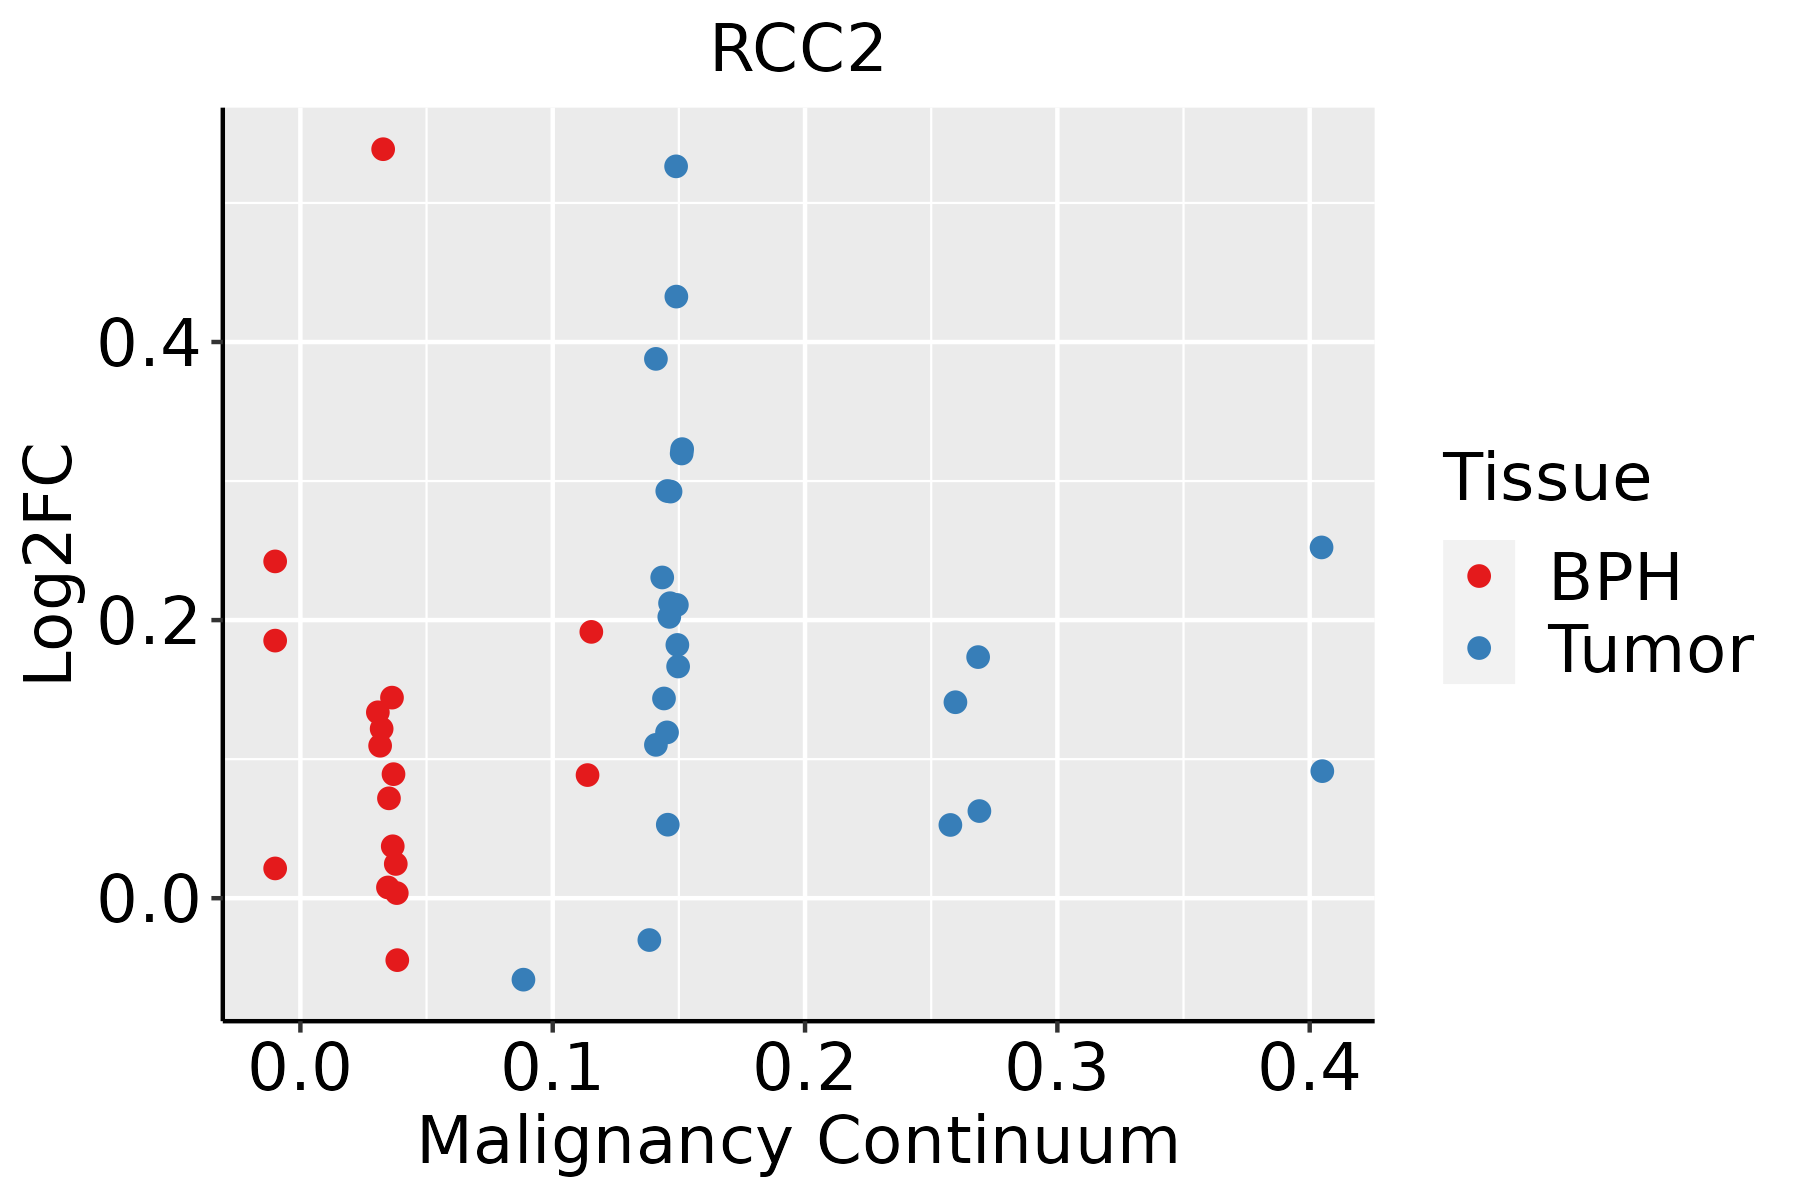 | BPH: Benign Prostatic Hyperplasia |
| Skin | 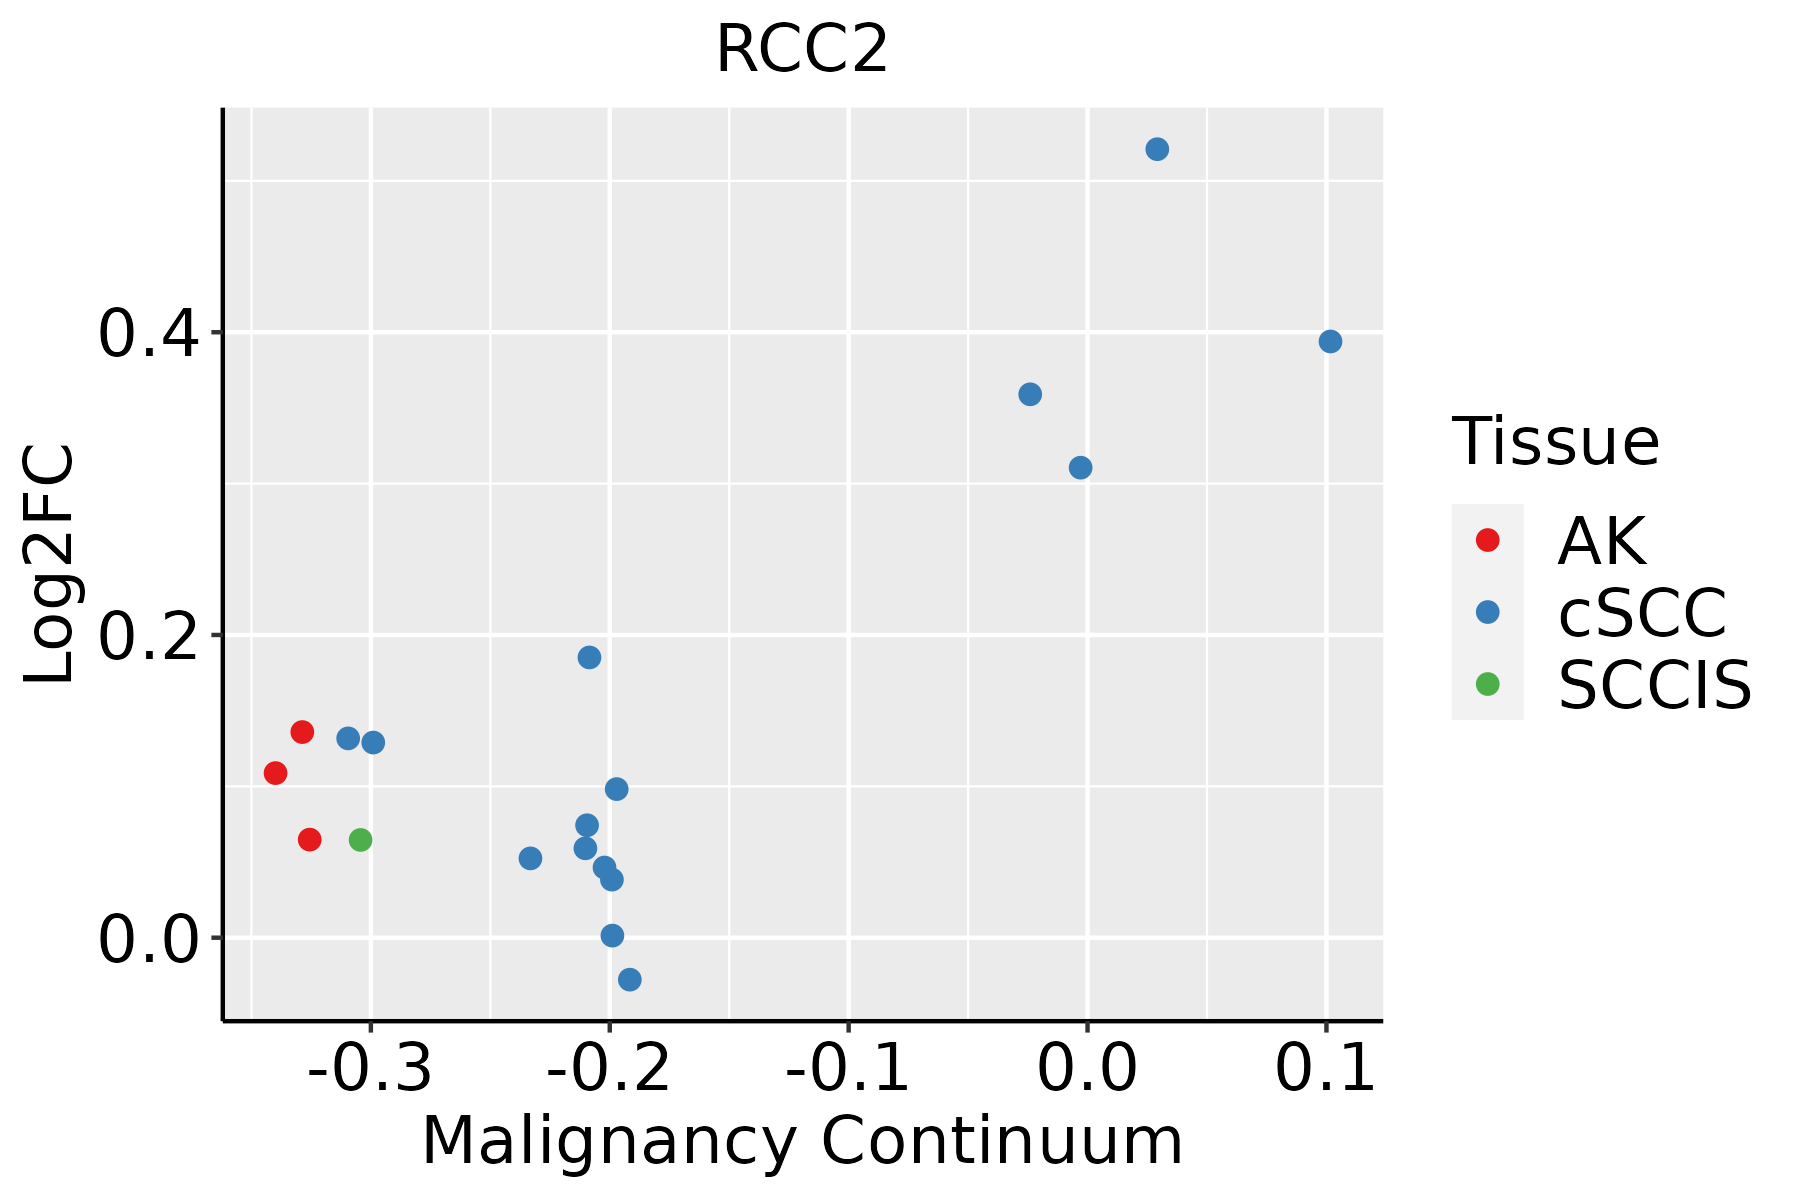 | AK: Actinic keratosis |
| cSCC: Cutaneous squamous cell carcinoma | ||
| SCCIS:squamous cell carcinoma in situ | ||
| Thyroid |  | ATC: Anaplastic thyroid cancer |
| HT: Hashimoto's thyroiditis | ||
| PTC: Papillary thyroid cancer |
| ∗log2FC in expression of this searched gene in stem-like cells from each diseased tissue sample relative to stem-like cells in normal samples in each tissue plotted against the malignancy continuum. Samples are colored based on if they are from different disease stage. |
Top |
Malignant transformation related pathway analysis |
| Find out the enriched GO biological processes and KEGG pathways involved in transition from healthy to precancer to cancer |
| Tissue | Disease Stage | Enriched GO biological Processes |
| Colorectum | AD |  |
| Colorectum | SER |  |
| Colorectum | MSS |  |
| Colorectum | MSI-H |  |
| Colorectum | FAP |  |
| ∗Top 15 enriched GO BP terms are showed in the bar plot of each disease state in each tissue. Each row represents a significant GO biological process which is colored according to the -log10(p.adjust). |
| Page: 1 2 3 4 5 6 7 8 9 |
| GO ID | Tissue | Disease Stage | Description | Gene Ratio | Bg Ratio | pvalue | p.adjust | Count |
| GO:003150315 | Skin | cSCC | protein-containing complex localization | 95/4864 | 220/18723 | 2.00e-08 | 5.82e-07 | 95 |
| GO:190198714 | Skin | cSCC | regulation of cell cycle phase transition | 150/4864 | 390/18723 | 3.21e-08 | 8.61e-07 | 150 |
| GO:015011525 | Skin | cSCC | cell-substrate junction organization | 51/4864 | 101/18723 | 1.13e-07 | 2.68e-06 | 51 |
| GO:00086082 | Skin | cSCC | attachment of spindle microtubules to kinetochore | 24/4864 | 35/18723 | 1.56e-07 | 3.51e-06 | 24 |
| GO:000704425 | Skin | cSCC | cell-substrate junction assembly | 48/4864 | 95/18723 | 2.57e-07 | 5.33e-06 | 48 |
| GO:004578717 | Skin | cSCC | positive regulation of cell cycle | 120/4864 | 313/18723 | 8.95e-07 | 1.64e-05 | 120 |
| GO:00519883 | Skin | cSCC | regulation of attachment of spindle microtubules to kinetochore | 12/4864 | 13/18723 | 9.25e-07 | 1.68e-05 | 12 |
| GO:004593118 | Skin | cSCC | positive regulation of mitotic cell cycle | 56/4864 | 121/18723 | 1.11e-06 | 1.96e-05 | 56 |
| GO:015011625 | Skin | cSCC | regulation of cell-substrate junction organization | 37/4864 | 71/18723 | 2.28e-06 | 3.70e-05 | 37 |
| GO:000195224 | Skin | cSCC | regulation of cell-matrix adhesion | 57/4864 | 128/18723 | 4.07e-06 | 6.07e-05 | 57 |
| GO:001081027 | Skin | cSCC | regulation of cell-substrate adhesion | 88/4864 | 221/18723 | 4.26e-06 | 6.32e-05 | 88 |
| GO:000632519 | Skin | cSCC | chromatin organization | 147/4864 | 409/18723 | 4.41e-06 | 6.52e-05 | 147 |
| GO:00345025 | Skin | cSCC | protein localization to chromosome | 44/4864 | 92/18723 | 5.27e-06 | 7.64e-05 | 44 |
| GO:003298617 | Skin | cSCC | protein-DNA complex disassembly | 15/4864 | 20/18723 | 6.31e-06 | 8.91e-05 | 15 |
| GO:009006815 | Skin | cSCC | positive regulation of cell cycle process | 92/4864 | 236/18723 | 7.33e-06 | 1.01e-04 | 92 |
| GO:005189324 | Skin | cSCC | regulation of focal adhesion assembly | 34/4864 | 66/18723 | 8.09e-06 | 1.09e-04 | 34 |
| GO:009010924 | Skin | cSCC | regulation of cell-substrate junction assembly | 34/4864 | 66/18723 | 8.09e-06 | 1.09e-04 | 34 |
| GO:002260427 | Skin | cSCC | regulation of cell morphogenesis | 114/4864 | 309/18723 | 1.34e-05 | 1.68e-04 | 114 |
| GO:004804124 | Skin | cSCC | focal adhesion assembly | 41/4864 | 87/18723 | 1.71e-05 | 2.07e-04 | 41 |
| GO:003158926 | Skin | cSCC | cell-substrate adhesion | 130/4864 | 363/18723 | 1.87e-05 | 2.23e-04 | 130 |
| Page: 1 2 3 4 5 6 7 8 9 10 11 12 13 14 15 16 17 18 19 20 21 22 23 24 25 26 27 28 29 30 31 32 33 34 35 36 37 |
| Pathway ID | Tissue | Disease Stage | Description | Gene Ratio | Bg Ratio | pvalue | p.adjust | qvalue | Count |
| Page: 1 |
Top |
Cell-cell communication analysis |
| Identification of potential cell-cell interactions between two cell types and their ligand-receptor pairs for different disease states |
| Ligand | Receptor | LRpair | Pathway | Tissue | Disease Stage |
| Page: 1 |
Top |
Single-cell gene regulatory network inference analysis |
| Find out the significant the regulons (TFs) and the target genes of each regulon across cell types for different disease states |
| TF | Cell Type | Tissue | Disease Stage | Target Gene | RSS | Regulon Activity |
| ∗The dot plots of a searched regulon are shown for all cell subpopulations in each disease state of each tissue based on the regulon specific score inferred using pySCENIC and by calculating the average expression. |
| Page: 1 |
Top |
Somatic mutation of malignant transformation related genes |
| Annotation of somatic variants for genes involved in malignant transformation |
| Hugo Symbol | Variant Class | Variant Classification | dbSNP RS | HGVSc | HGVSp | HGVSp Short | SWISSPROT | BIOTYPE | SIFT | PolyPhen | Tumor Sample Barcode | Tissue | Histology | Sex | Age | Stage | Therapy Types | Drugs | Outcome |
| RCC2 | SNV | Missense_Mutation | c.1455N>G | p.Phe485Leu | p.F485L | Q9P258 | protein_coding | tolerated(0.18) | benign(0.006) | TCGA-AR-A251-01 | Breast | breast invasive carcinoma | Female | <65 | III/IV | Chemotherapy | doxorubicin | SD | |
| RCC2 | SNV | Missense_Mutation | novel | c.416C>T | p.Pro139Leu | p.P139L | Q9P258 | protein_coding | deleterious(0) | probably_damaging(0.997) | TCGA-AR-A2LR-01 | Breast | breast invasive carcinoma | Female | <65 | I/II | Chemotherapy | adriamycin | SD |
| RCC2 | SNV | Missense_Mutation | novel | c.1559G>A | p.Arg520Gln | p.R520Q | Q9P258 | protein_coding | tolerated(0.08) | possibly_damaging(0.557) | TCGA-2W-A8YY-01 | Cervix | cervical & endocervical cancer | Female | <65 | I/II | Chemotherapy | cisplatin | CR |
| RCC2 | SNV | Missense_Mutation | c.631C>T | p.Arg211Trp | p.R211W | Q9P258 | protein_coding | deleterious(0.03) | probably_damaging(0.998) | TCGA-2W-A8YY-01 | Cervix | cervical & endocervical cancer | Female | <65 | I/II | Chemotherapy | cisplatin | CR | |
| RCC2 | SNV | Missense_Mutation | c.1543N>T | p.Pro515Ser | p.P515S | Q9P258 | protein_coding | deleterious(0.01) | benign(0.069) | TCGA-AA-3663-01 | Colorectum | colon adenocarcinoma | Male | <65 | I/II | Unknown | Unknown | SD | |
| RCC2 | SNV | Missense_Mutation | rs780378675 | c.1297C>T | p.Arg433Trp | p.R433W | Q9P258 | protein_coding | deleterious(0) | probably_damaging(0.988) | TCGA-AA-A022-01 | Colorectum | colon adenocarcinoma | Female | >=65 | I/II | Unknown | Unknown | SD |
| RCC2 | SNV | Missense_Mutation | c.898C>T | p.Arg300Trp | p.R300W | Q9P258 | protein_coding | deleterious(0) | probably_damaging(0.998) | TCGA-CM-6162-01 | Colorectum | colon adenocarcinoma | Female | <65 | III/IV | Chemotherapy | oxaliplatin | SD | |
| RCC2 | SNV | Missense_Mutation | c.1120C>T | p.Arg374Cys | p.R374C | Q9P258 | protein_coding | deleterious(0) | probably_damaging(0.998) | TCGA-CM-6168-01 | Colorectum | colon adenocarcinoma | Female | >=65 | I/II | Unknown | Unknown | SD | |
| RCC2 | SNV | Missense_Mutation | c.956N>T | p.Thr319Met | p.T319M | Q9P258 | protein_coding | deleterious(0.04) | probably_damaging(0.938) | TCGA-D5-6930-01 | Colorectum | colon adenocarcinoma | Male | >=65 | I/II | Unknown | Unknown | SD | |
| RCC2 | SNV | Missense_Mutation | novel | c.1150N>T | p.Arg384Cys | p.R384C | Q9P258 | protein_coding | deleterious(0) | probably_damaging(0.998) | TCGA-G4-6297-01 | Colorectum | colon adenocarcinoma | Female | <65 | III/IV | Chemotherapy | fluorouracil | PD |
| Page: 1 2 3 4 5 6 |
Top |
Related drugs of malignant transformation related genes |
| Identification of chemicals and drugs interact with genes involved in malignant transfromation |
| (DGIdb 4.0) |
| Entrez ID | Symbol | Category | Interaction Types | Drug Claim Name | Drug Name | PMIDs |
| Page: 1 |

Copyright 2023-Present -The University of Texas Health Science Center at Houston |