| Tissue | Expression Dynamics | Abbreviation |
| Cervix | 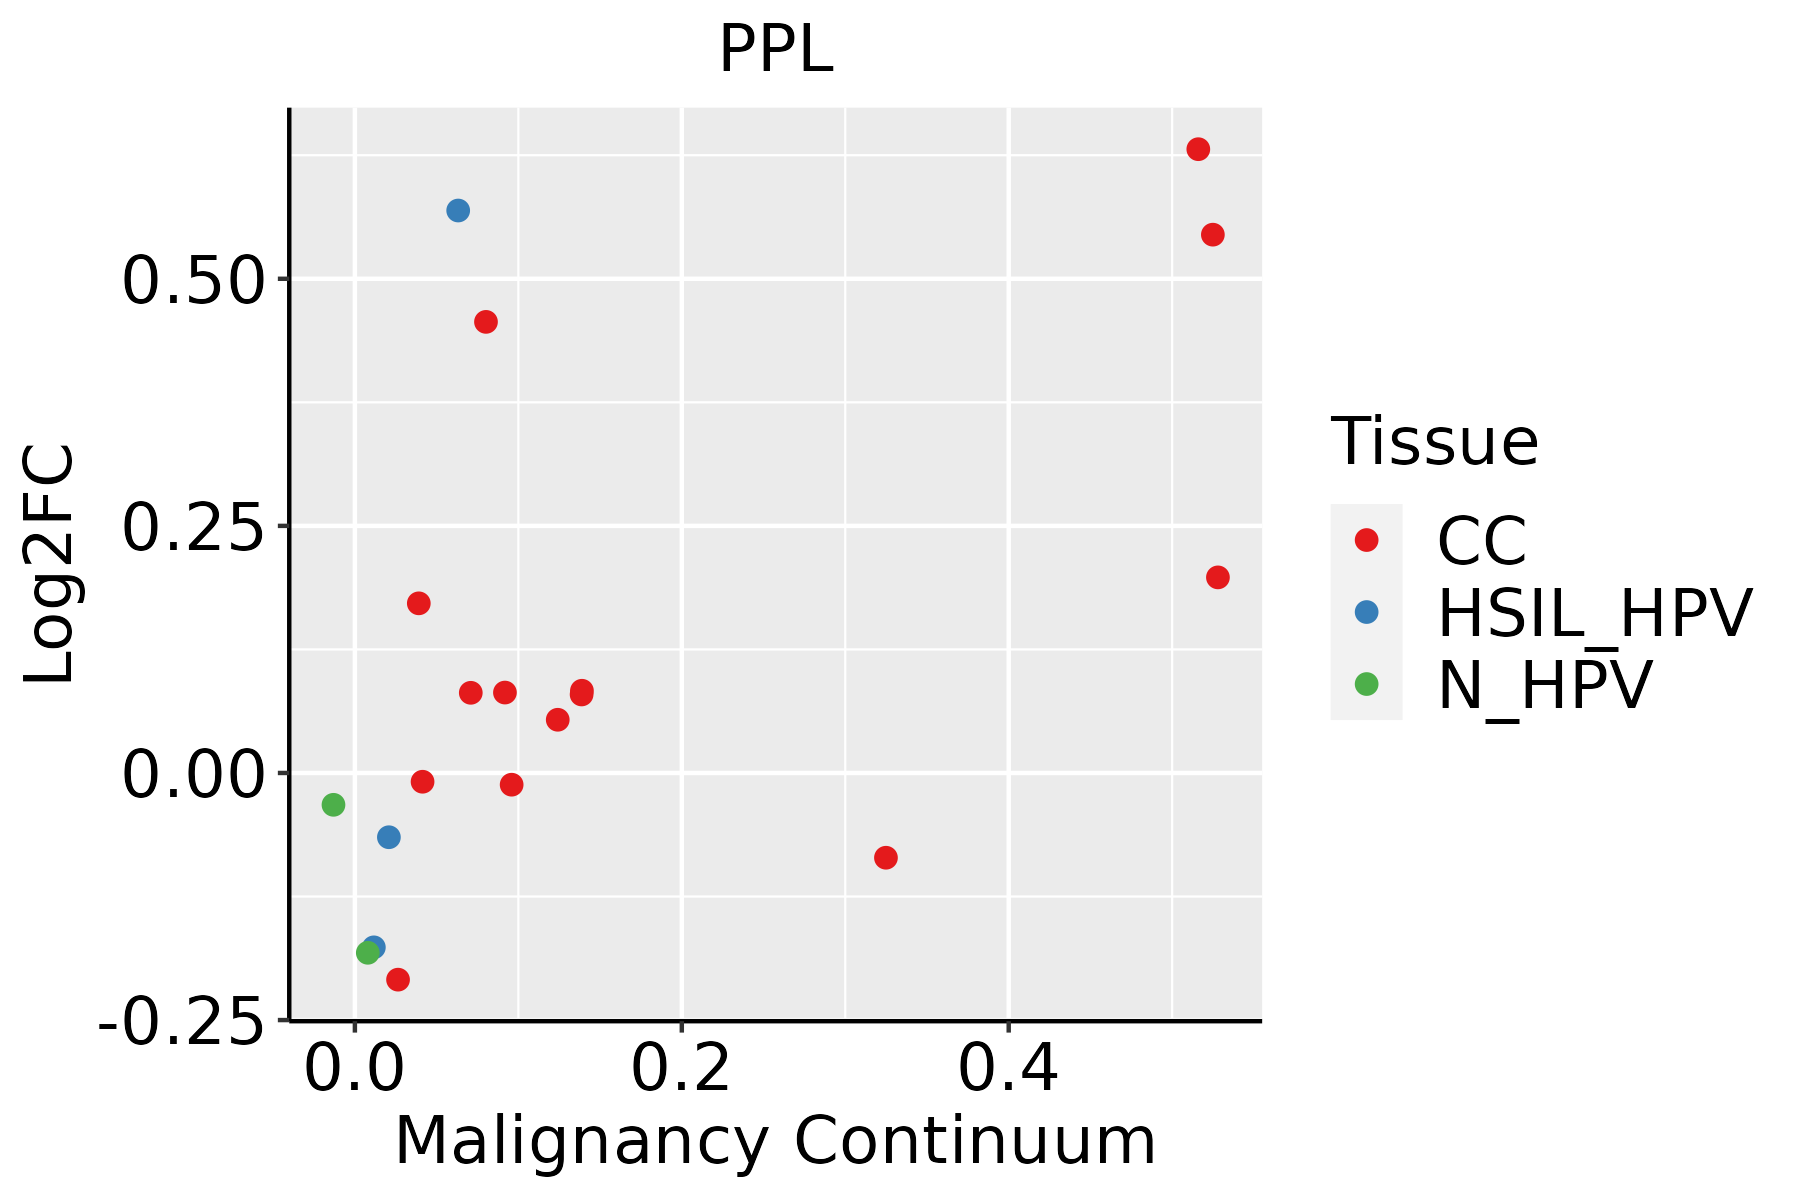 | CC: Cervix cancer |
| HSIL_HPV: HPV-infected high-grade squamous intraepithelial lesions |
| N_HPV: HPV-infected normal cervix |
| Esophagus | 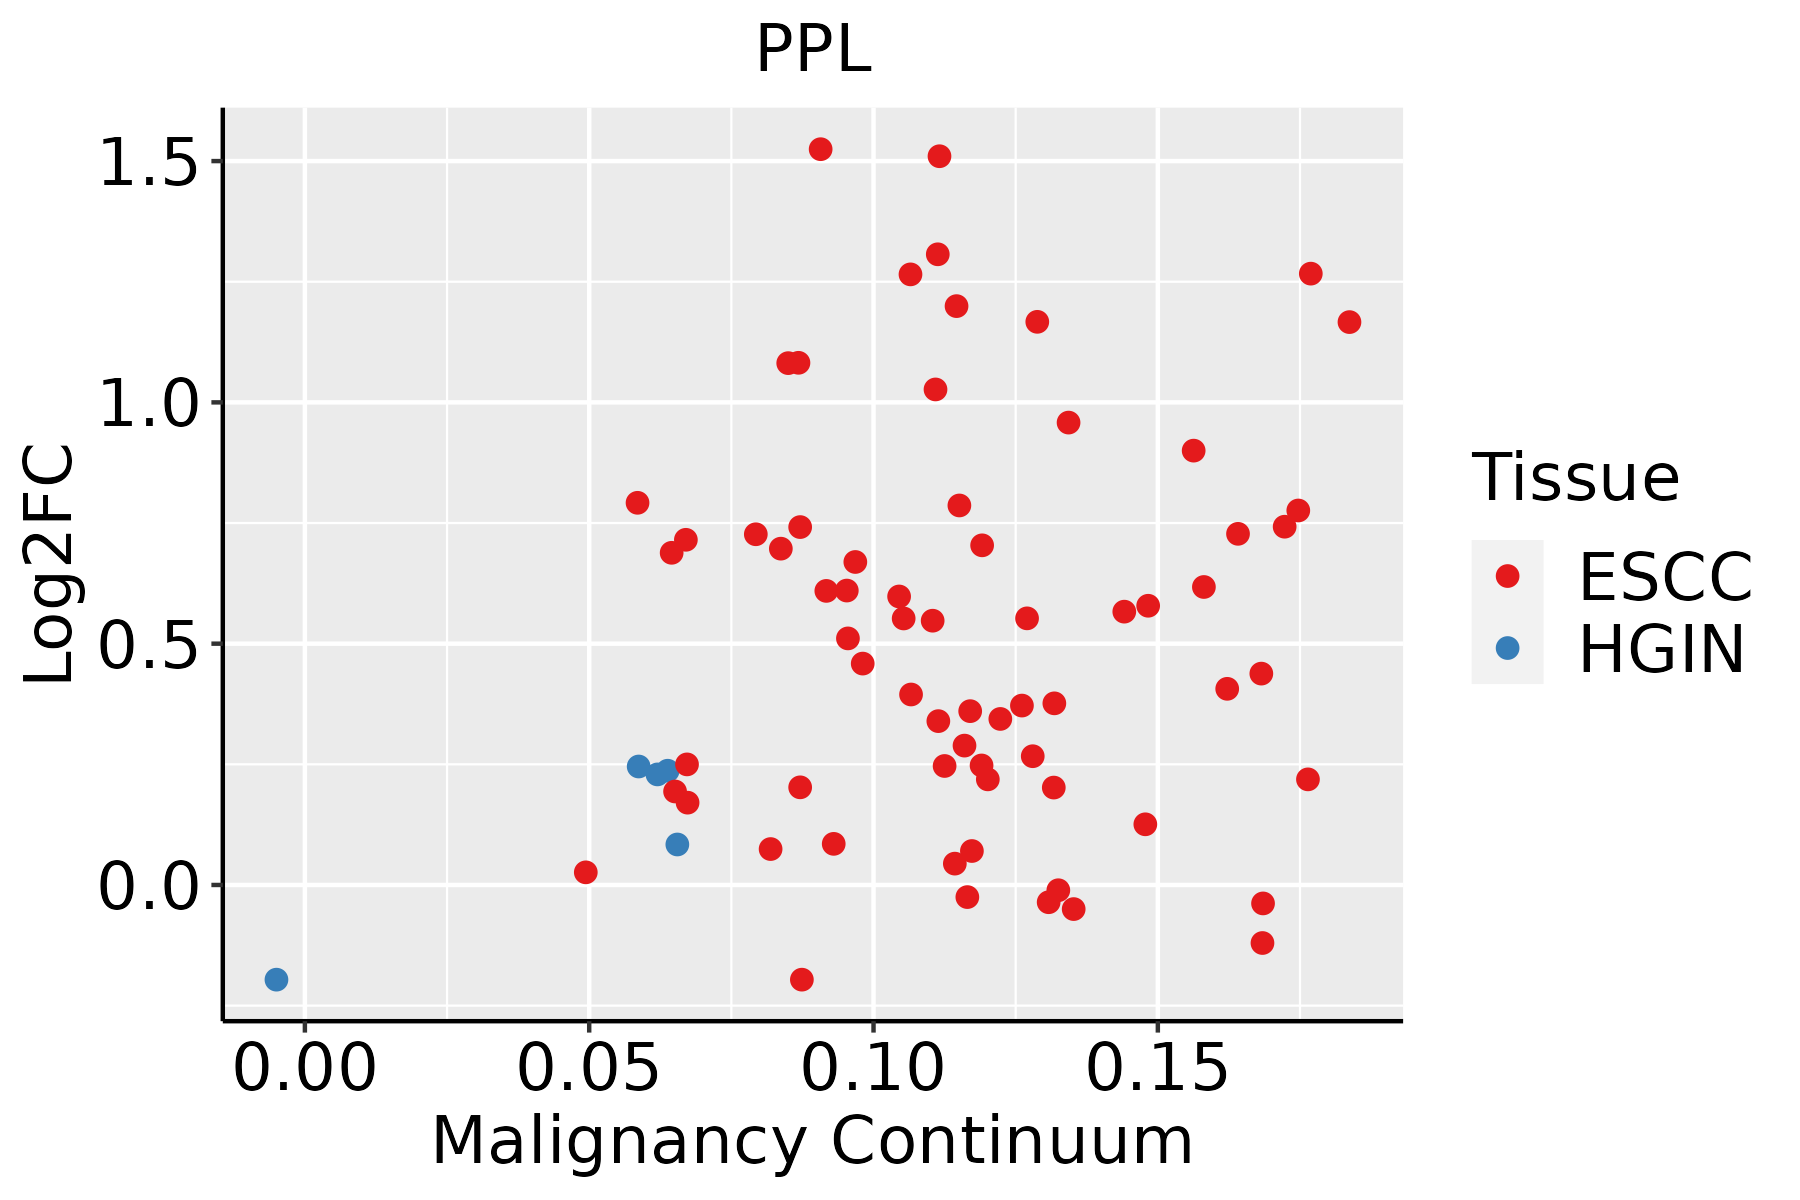 | ESCC: Esophageal squamous cell carcinoma |
| HGIN: High-grade intraepithelial neoplasias |
| LGIN: Low-grade intraepithelial neoplasias |
| Oral Cavity | 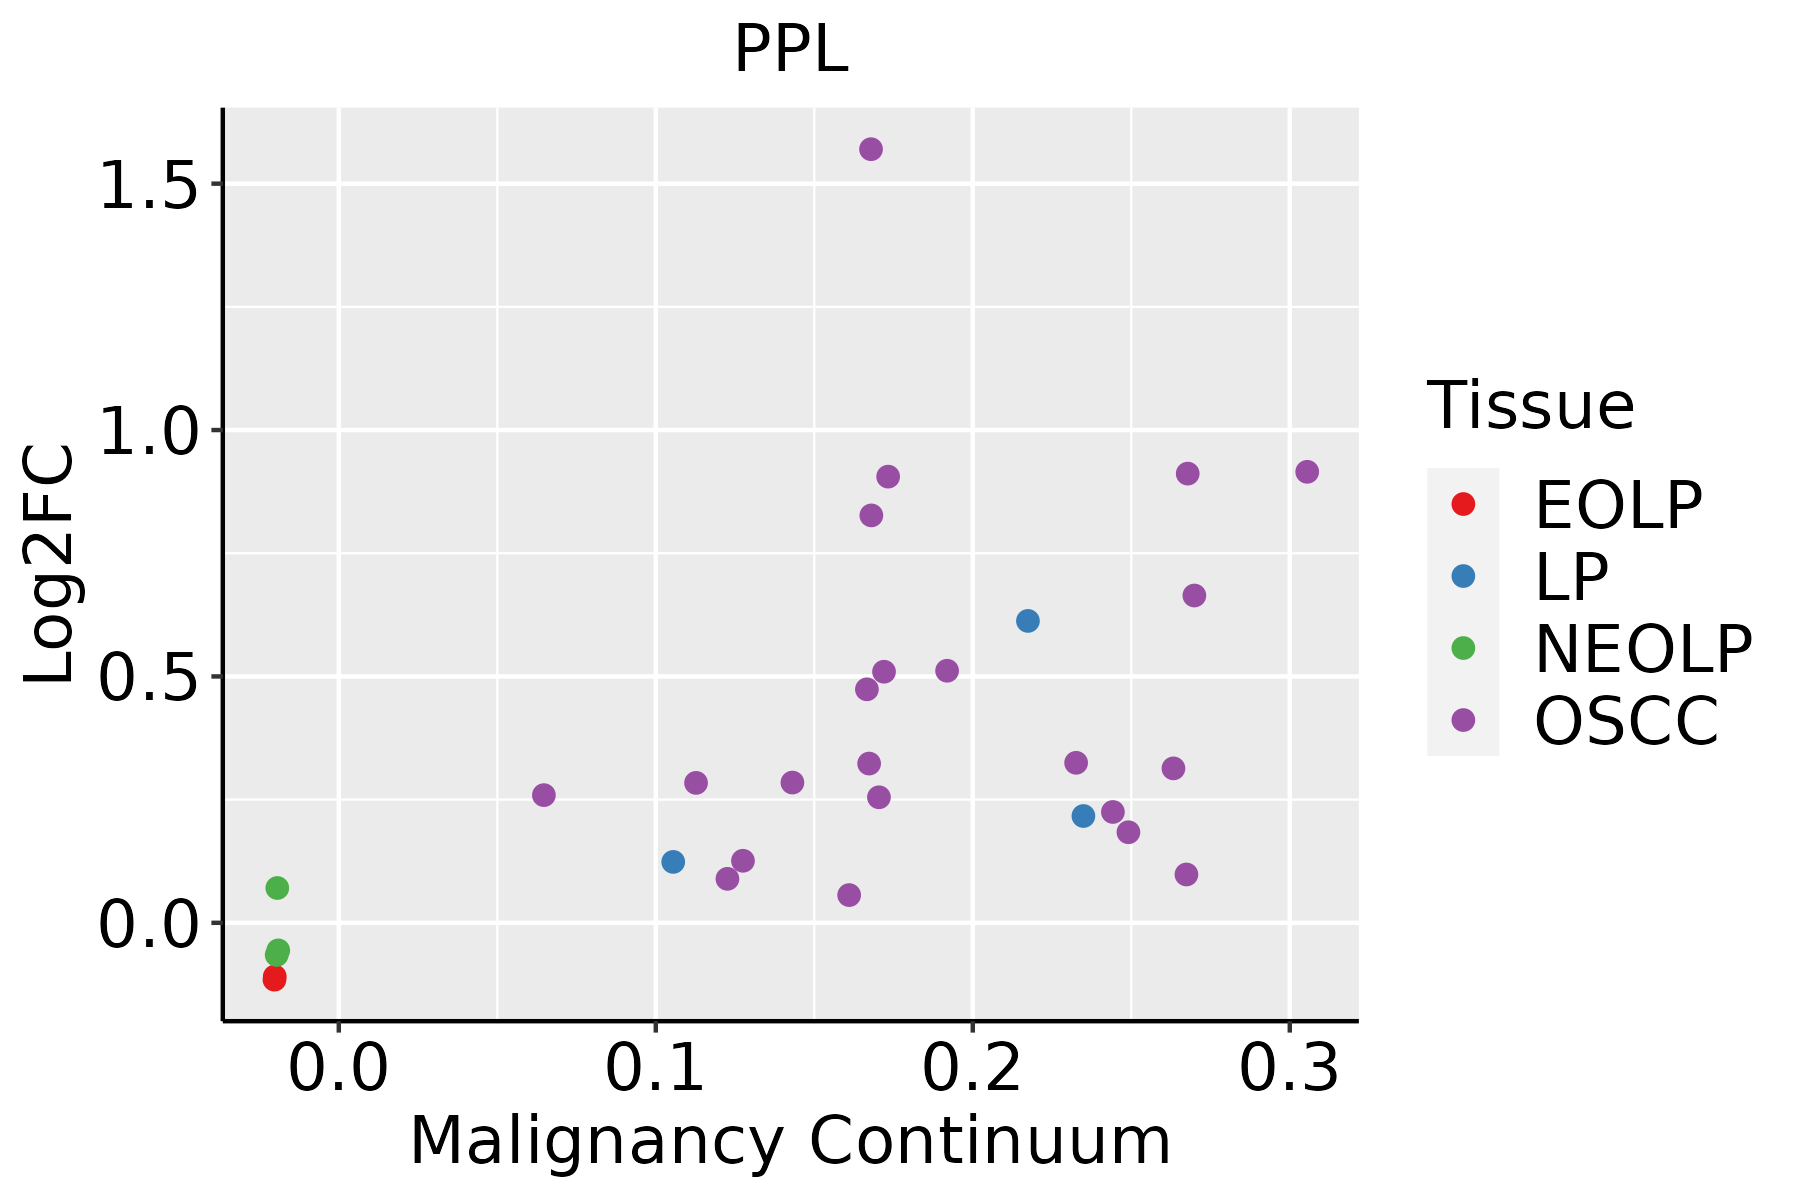 | EOLP: Erosive Oral lichen planus |
| LP: leukoplakia |
| NEOLP: Non-erosive oral lichen planus |
| OSCC: Oral squamous cell carcinoma |
| Prostate |  | BPH: Benign Prostatic Hyperplasia |
| Thyroid |  | ATC: Anaplastic thyroid cancer |
| HT: Hashimoto's thyroiditis |
| PTC: Papillary thyroid cancer |
| GO ID | Tissue | Disease Stage | Description | Gene Ratio | Bg Ratio | pvalue | p.adjust | Count |
| GO:000647011 | Liver | Cirrhotic | protein dephosphorylation | 96/4634 | 281/18723 | 2.32e-04 | 2.11e-03 | 96 |
| GO:00107611 | Liver | Cirrhotic | fibroblast migration | 23/4634 | 47/18723 | 2.84e-04 | 2.51e-03 | 23 |
| GO:000717911 | Liver | Cirrhotic | transforming growth factor beta receptor signaling pathway | 71/4634 | 198/18723 | 3.02e-04 | 2.65e-03 | 71 |
| GO:1901990 | Liver | Cirrhotic | regulation of mitotic cell cycle phase transition | 100/4634 | 299/18723 | 4.13e-04 | 3.41e-03 | 100 |
| GO:003010011 | Liver | Cirrhotic | regulation of endocytosis | 74/4634 | 211/18723 | 4.86e-04 | 3.90e-03 | 74 |
| GO:00713566 | Liver | Cirrhotic | cellular response to tumor necrosis factor | 79/4634 | 229/18723 | 5.68e-04 | 4.45e-03 | 79 |
| GO:19016171 | Liver | Cirrhotic | organic hydroxy compound biosynthetic process | 81/4634 | 237/18723 | 6.73e-04 | 5.06e-03 | 81 |
| GO:000828611 | Liver | Cirrhotic | insulin receptor signaling pathway | 44/4634 | 116/18723 | 1.09e-03 | 7.59e-03 | 44 |
| GO:001631111 | Liver | Cirrhotic | dephosphorylation | 130/4634 | 417/18723 | 1.58e-03 | 1.03e-02 | 130 |
| GO:2000045 | Liver | Cirrhotic | regulation of G1/S transition of mitotic cell cycle | 51/4634 | 142/18723 | 1.91e-03 | 1.20e-02 | 51 |
| GO:00064656 | Liver | Cirrhotic | signal peptide processing | 9/4634 | 14/18723 | 1.99e-03 | 1.23e-02 | 9 |
| GO:00000821 | Liver | Cirrhotic | G1/S transition of mitotic cell cycle | 72/4634 | 214/18723 | 2.07e-03 | 1.28e-02 | 72 |
| GO:004580711 | Liver | Cirrhotic | positive regulation of endocytosis | 38/4634 | 100/18723 | 2.22e-03 | 1.35e-02 | 38 |
| GO:000166712 | Liver | Cirrhotic | ameboidal-type cell migration | 145/4634 | 475/18723 | 2.23e-03 | 1.36e-02 | 145 |
| GO:000717811 | Liver | Cirrhotic | transmembrane receptor protein serine/threonine kinase signaling pathway | 111/4634 | 355/18723 | 2.98e-03 | 1.70e-02 | 111 |
| GO:00510514 | Liver | Cirrhotic | negative regulation of transport | 141/4634 | 470/18723 | 5.06e-03 | 2.62e-02 | 141 |
| GO:00511706 | Liver | Cirrhotic | import into nucleus | 54/4634 | 159/18723 | 5.59e-03 | 2.83e-02 | 54 |
| GO:00028311 | Liver | Cirrhotic | regulation of response to biotic stimulus | 101/4634 | 327/18723 | 6.58e-03 | 3.25e-02 | 101 |
| GO:00448431 | Liver | Cirrhotic | cell cycle G1/S phase transition | 77/4634 | 241/18723 | 6.68e-03 | 3.30e-02 | 77 |
| GO:00353037 | Liver | Cirrhotic | regulation of dephosphorylation | 44/4634 | 128/18723 | 9.13e-03 | 4.21e-02 | 44 |
| Hugo Symbol | Variant Class | Variant Classification | dbSNP RS | HGVSc | HGVSp | HGVSp Short | SWISSPROT | BIOTYPE | SIFT | PolyPhen | Tumor Sample Barcode | Tissue | Histology | Sex | Age | Stage | Therapy Types | Drugs | Outcome |
| PPL | SNV | Missense_Mutation | novel | c.3422N>A | p.Ala1141Asp | p.A1141D | O60437 | protein_coding | tolerated(0.27) | benign(0.075) | TCGA-A2-A0EX-01 | Breast | breast invasive carcinoma | Female | <65 | I/II | Hormone Therapy | tamoxiphen | SD |
| PPL | SNV | Missense_Mutation | rs371832541 | c.2354N>G | p.Gln785Arg | p.Q785R | O60437 | protein_coding | tolerated(0.22) | benign(0.045) | TCGA-A8-A06T-01 | Breast | breast invasive carcinoma | Female | >=65 | III/IV | Hormone Therapy | anastrozole | SD |
| PPL | SNV | Missense_Mutation | novel | c.1802T>G | p.Leu601Arg | p.L601R | O60437 | protein_coding | tolerated(0.52) | benign(0.009) | TCGA-A8-A08H-01 | Breast | breast invasive carcinoma | Female | >=65 | I/II | Unknown | Unknown | SD |
| PPL | SNV | Missense_Mutation | novel | c.1801C>A | p.Leu601Met | p.L601M | O60437 | protein_coding | tolerated(0.1) | benign(0.039) | TCGA-A8-A08H-01 | Breast | breast invasive carcinoma | Female | >=65 | I/II | Unknown | Unknown | SD |
| PPL | SNV | Missense_Mutation | rs767752605 | c.470N>C | p.Asp157Ala | p.D157A | O60437 | protein_coding | deleterious(0.04) | benign(0.356) | TCGA-AR-A1AY-01 | Breast | breast invasive carcinoma | Female | >=65 | I/II | Unspecific | Doxorubicin | SD |
| PPL | SNV | Missense_Mutation | novel | c.3992N>T | p.Ser1331Phe | p.S1331F | O60437 | protein_coding | deleterious(0.04) | benign(0.223) | TCGA-BH-A0B6-01 | Breast | breast invasive carcinoma | Female | <65 | I/II | Unknown | Unknown | SD |
| PPL | SNV | Missense_Mutation | novel | c.2977N>A | p.Val993Met | p.V993M | O60437 | protein_coding | tolerated(0.09) | possibly_damaging(0.483) | TCGA-C8-A8HQ-01 | Breast | breast invasive carcinoma | Female | <65 | I/II | Unknown | Unknown | SD |
| PPL | SNV | Missense_Mutation | | c.2404G>C | p.Glu802Gln | p.E802Q | O60437 | protein_coding | deleterious(0) | probably_damaging(0.994) | TCGA-D8-A1JA-01 | Breast | breast invasive carcinoma | Female | <65 | III/IV | Chemotherapy | adriamycin | PD |
| PPL | SNV | Missense_Mutation | | c.1774N>A | p.Asp592Asn | p.D592N | O60437 | protein_coding | tolerated(0.73) | benign(0.005) | TCGA-D8-A1Y0-01 | Breast | breast invasive carcinoma | Female | >=65 | III/IV | Chemotherapy | cyclophosphamide+methotrexatum+fluorouracillum | SD |
| PPL | SNV | Missense_Mutation | rs370359256 | c.4894N>A | p.Glu1632Lys | p.E1632K | O60437 | protein_coding | deleterious(0.02) | probably_damaging(0.994) | TCGA-E9-A1RA-01 | Breast | breast invasive carcinoma | Female | <65 | I/II | Hormone Therapy | tamoxiphen | SD |


