| Tissue | Expression Dynamics | Abbreviation |
| Cervix |  | CC: Cervix cancer |
| HSIL_HPV: HPV-infected high-grade squamous intraepithelial lesions |
| N_HPV: HPV-infected normal cervix |
| Colorectum (GSE201348) | 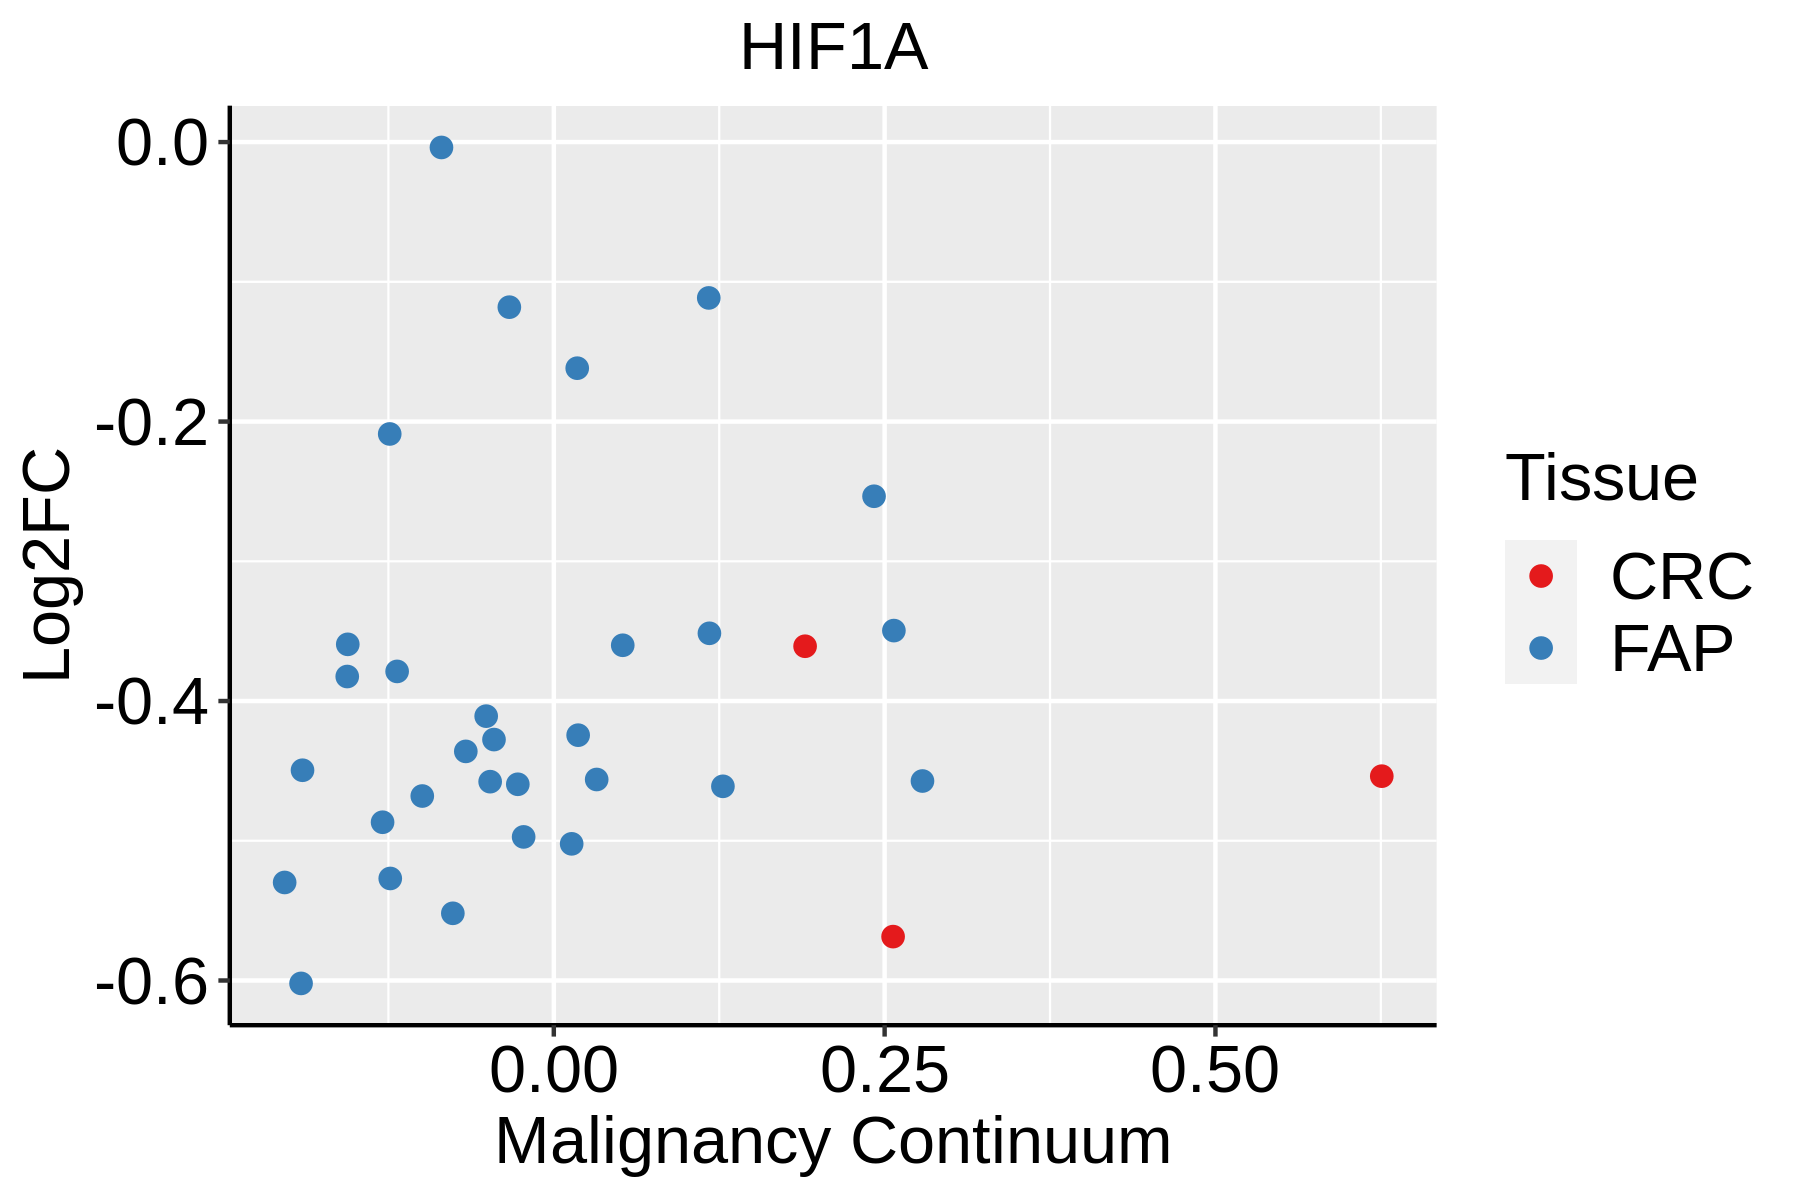 | FAP: Familial adenomatous polyposis |
| CRC: Colorectal cancer |
| Colorectum (HTA11) |  | AD: Adenomas |
| SER: Sessile serrated lesions |
| MSI-H: Microsatellite-high colorectal cancer |
| MSS: Microsatellite stable colorectal cancer |
| Endometrium | 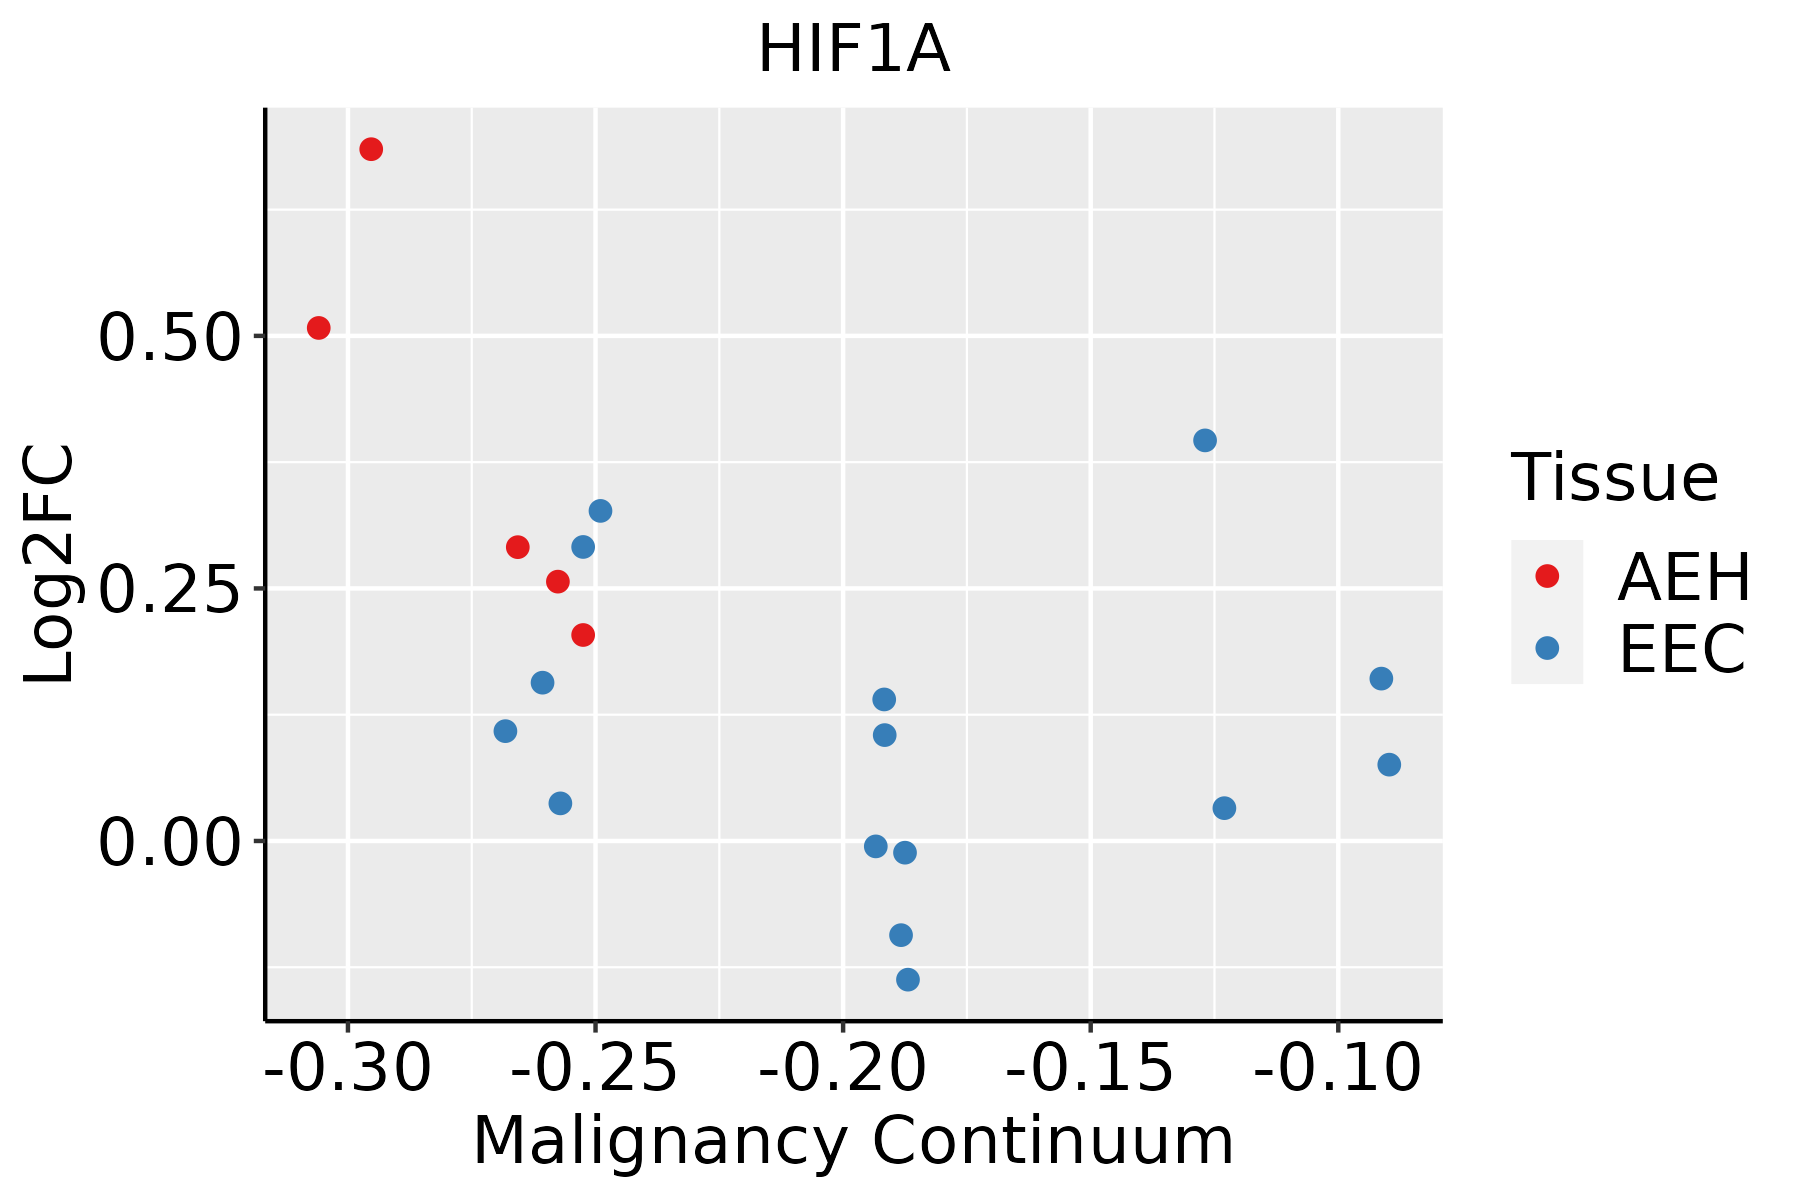 | AEH: Atypical endometrial hyperplasia |
| EEC: Endometrioid Cancer |
| Esophagus |  | ESCC: Esophageal squamous cell carcinoma |
| HGIN: High-grade intraepithelial neoplasias |
| LGIN: Low-grade intraepithelial neoplasias |
| Liver | 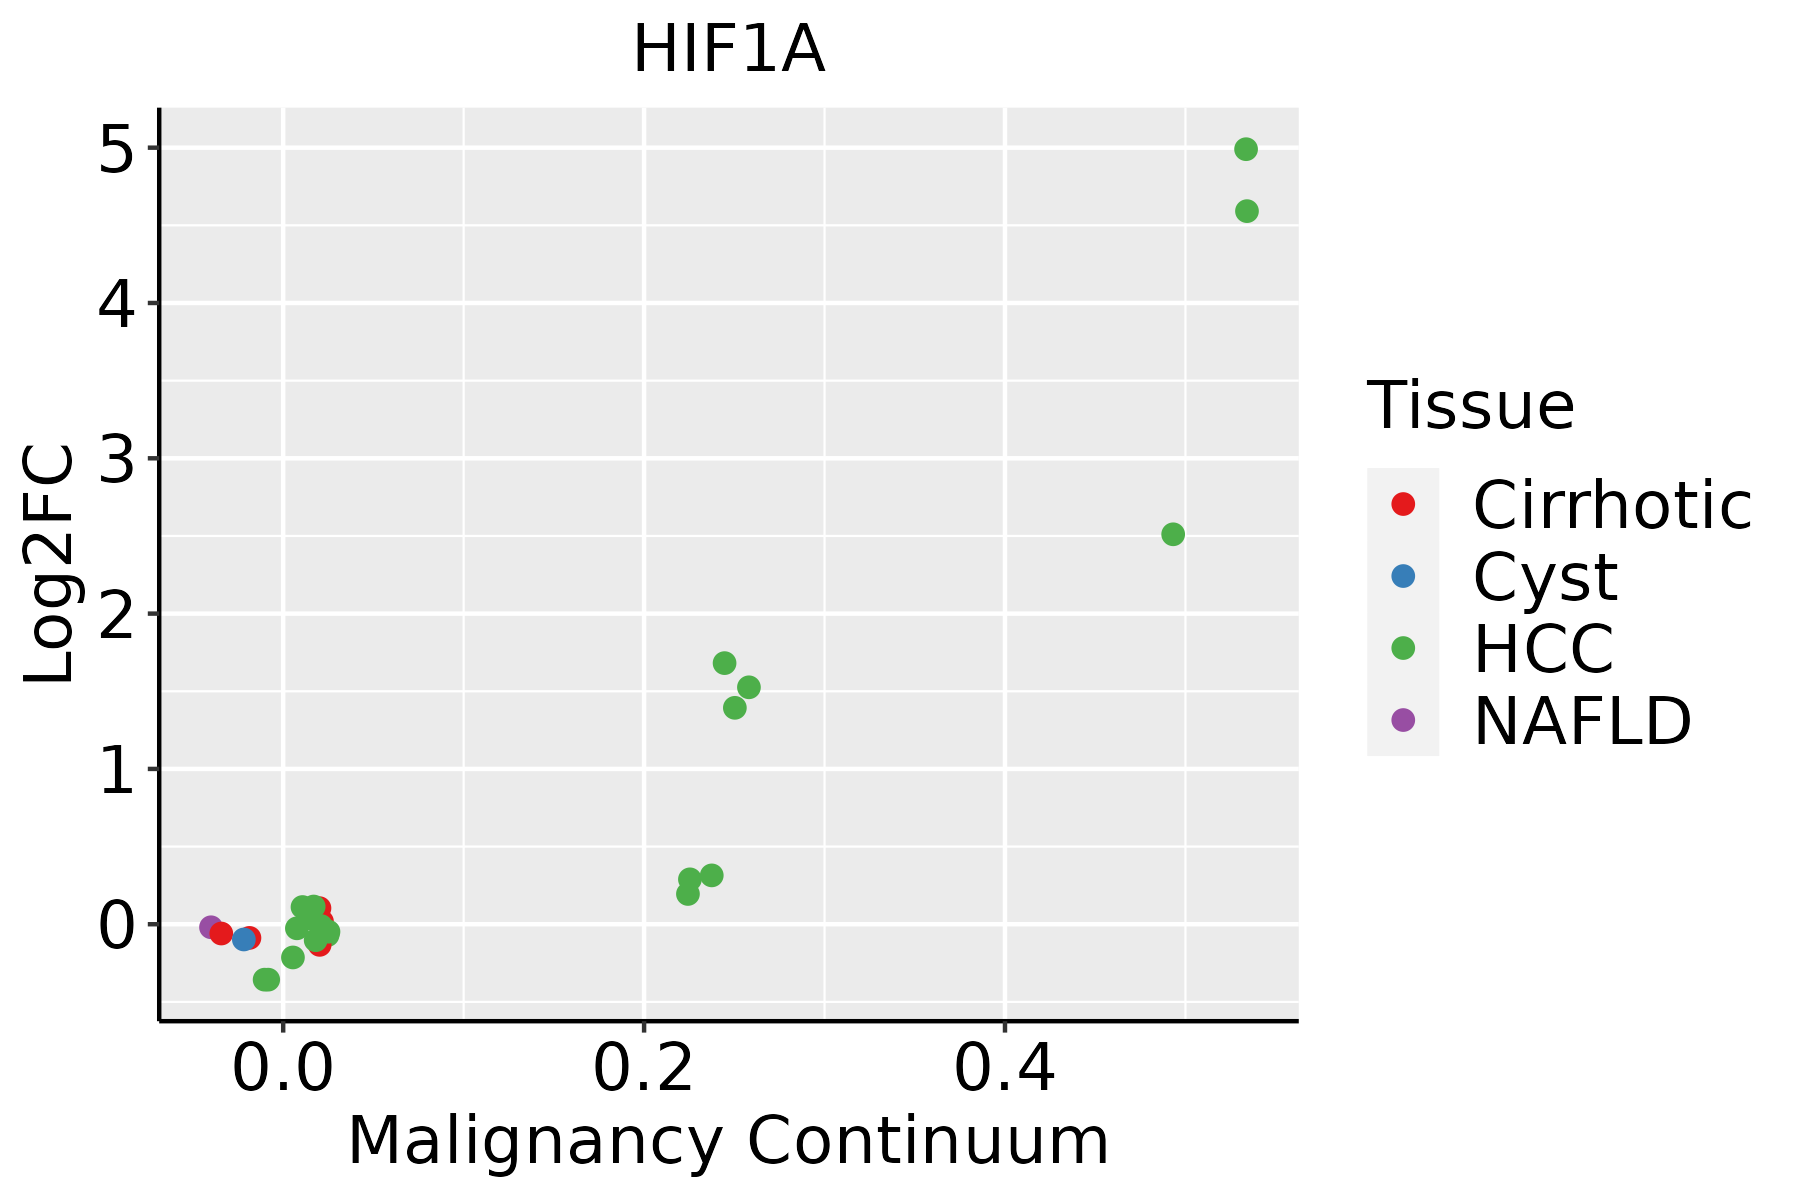 | HCC: Hepatocellular carcinoma |
| NAFLD: Non-alcoholic fatty liver disease |
| Lung | 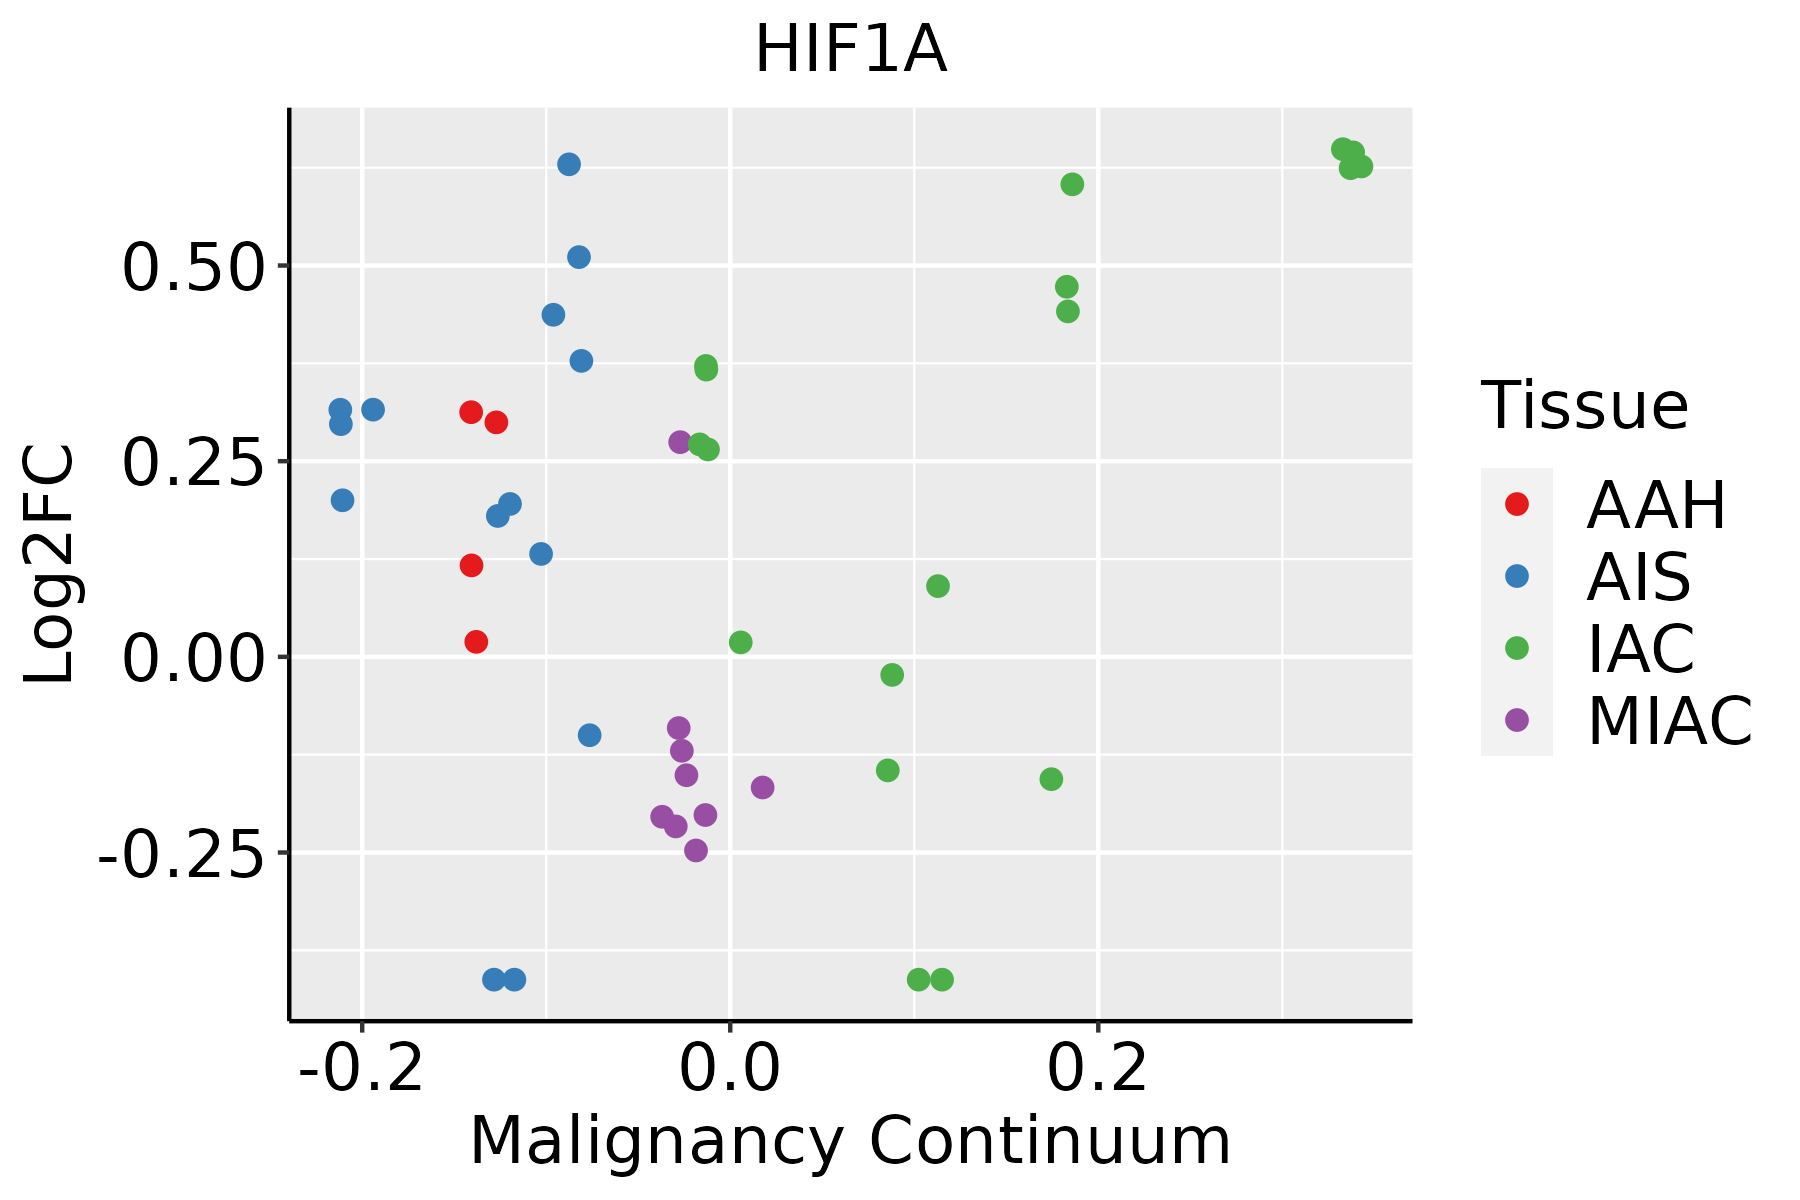 | AAH: Atypical adenomatous hyperplasia |
| AIS: Adenocarcinoma in situ |
| IAC: Invasive lung adenocarcinoma |
| MIA: Minimally invasive adenocarcinoma |
| Oral Cavity | 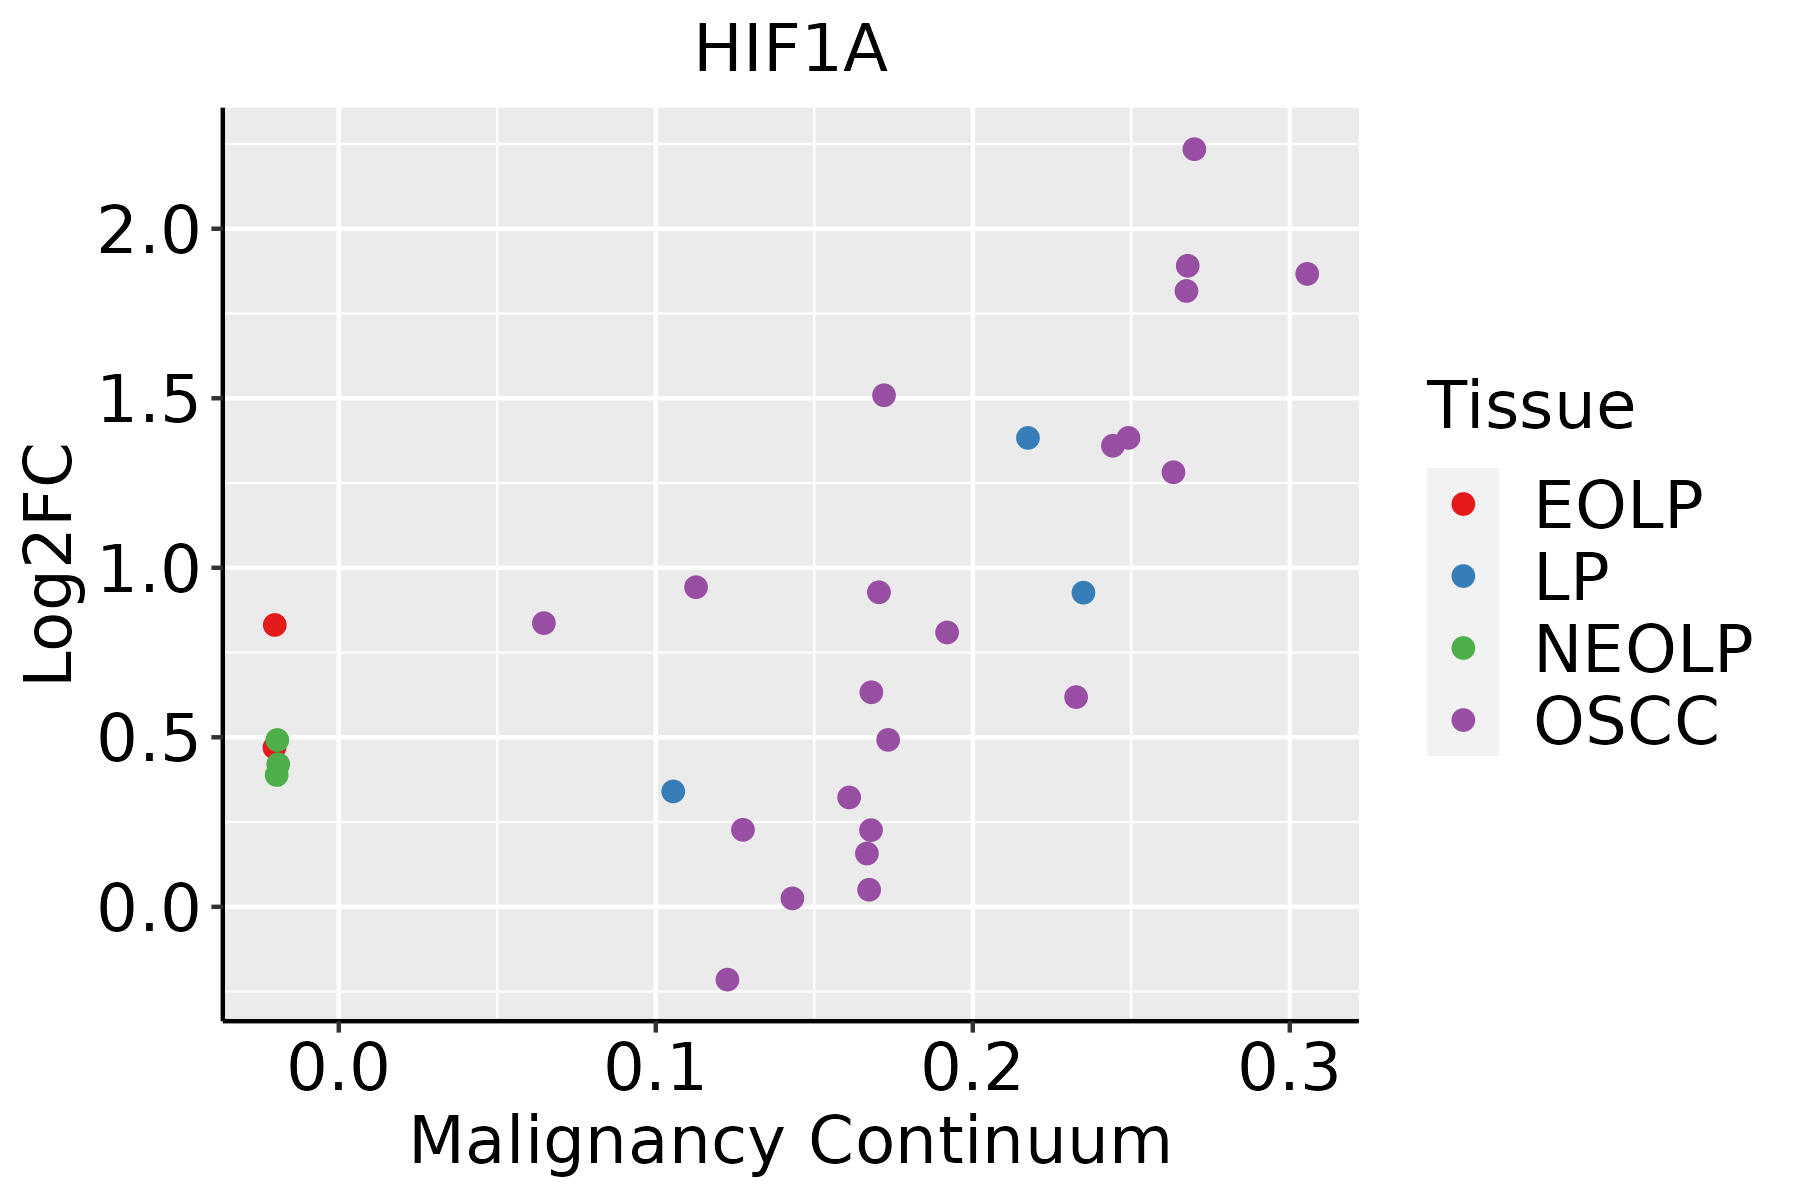 | EOLP: Erosive Oral lichen planus |
| LP: leukoplakia |
| NEOLP: Non-erosive oral lichen planus |
| OSCC: Oral squamous cell carcinoma |
| Prostate | 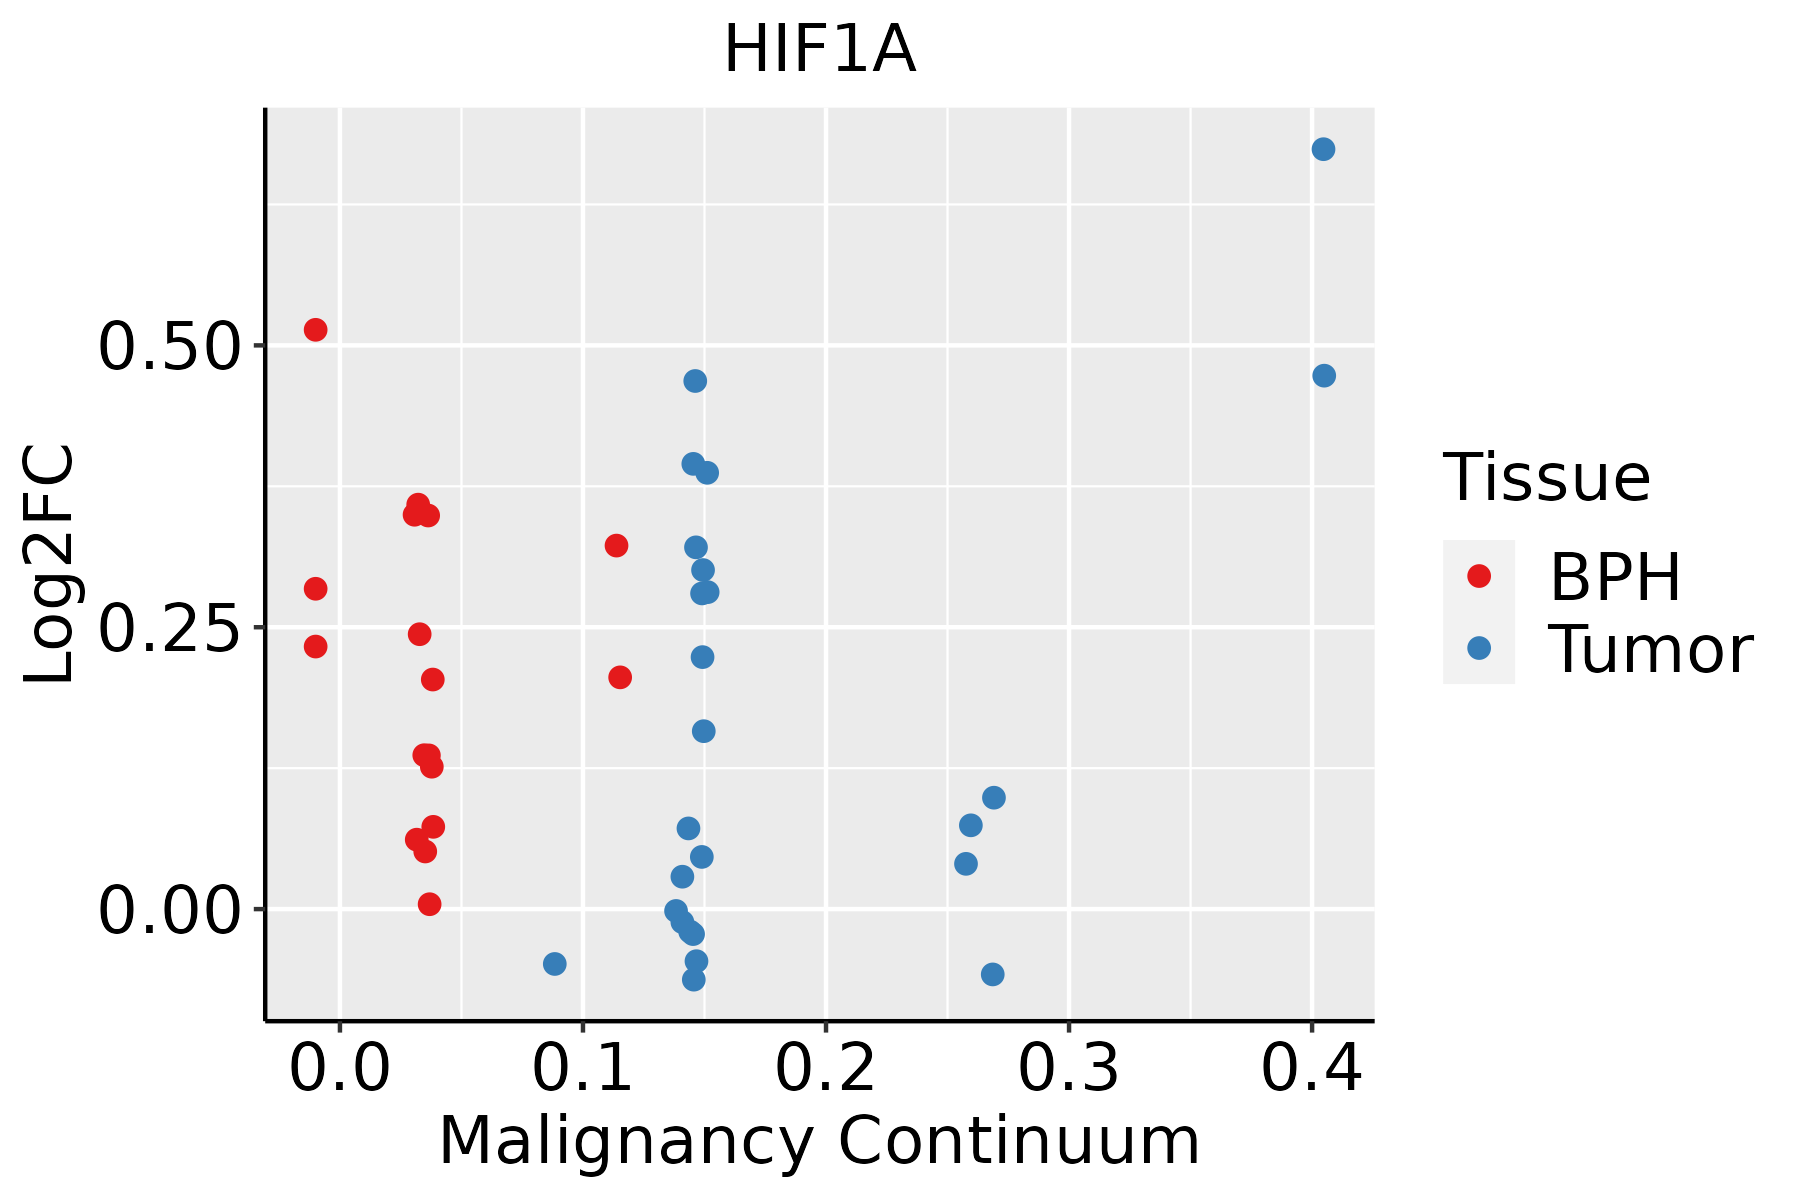 | BPH: Benign Prostatic Hyperplasia |
| Skin | 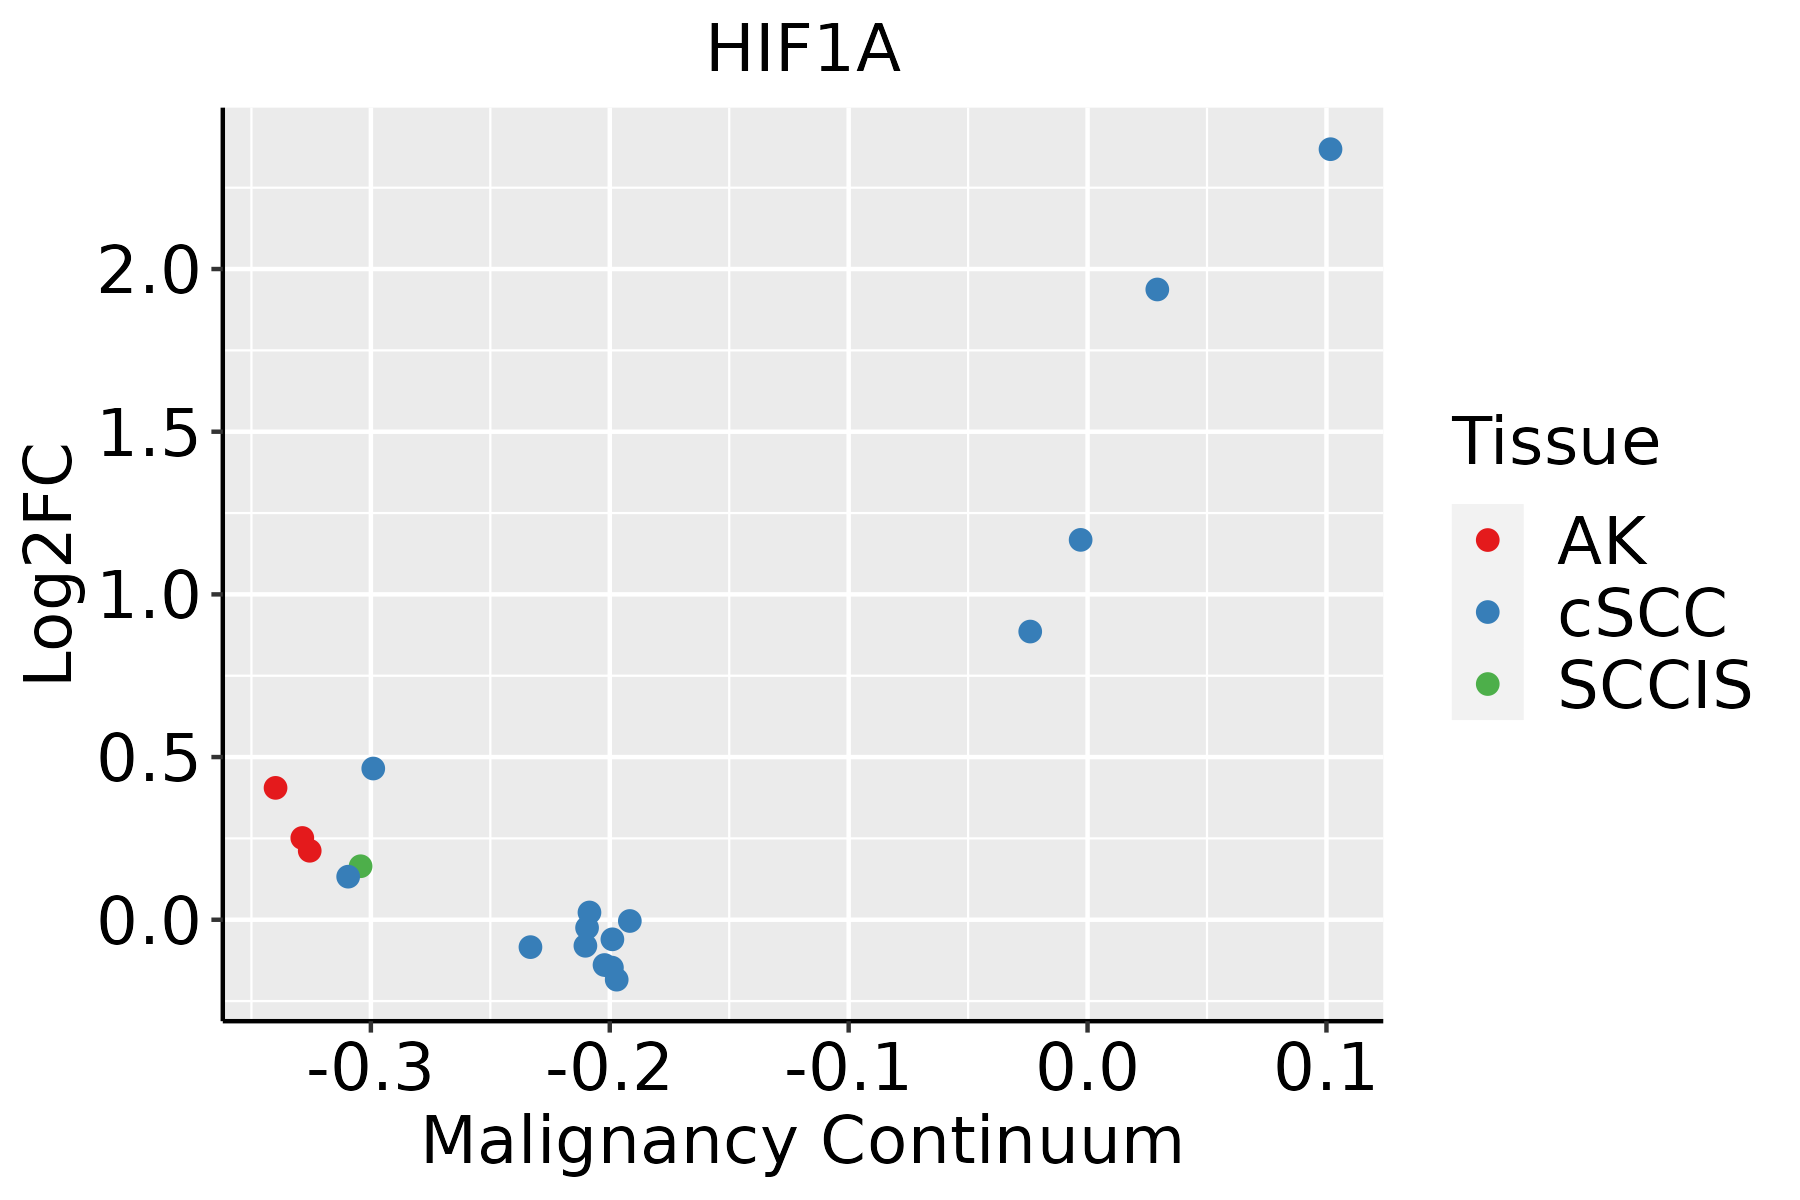 | AK: Actinic keratosis |
| cSCC: Cutaneous squamous cell carcinoma |
| SCCIS:squamous cell carcinoma in situ |
| Thyroid |  | ATC: Anaplastic thyroid cancer |
| HT: Hashimoto's thyroiditis |
| PTC: Papillary thyroid cancer |
| GO ID | Tissue | Disease Stage | Description | Gene Ratio | Bg Ratio | pvalue | p.adjust | Count |
| GO:00097492 | Colorectum | MSS | response to glucose | 64/3467 | 212/18723 | 2.43e-05 | 5.09e-04 | 64 |
| GO:00093062 | Colorectum | MSS | protein secretion | 98/3467 | 359/18723 | 2.43e-05 | 5.09e-04 | 98 |
| GO:00713332 | Colorectum | MSS | cellular response to glucose stimulus | 49/3467 | 151/18723 | 2.73e-05 | 5.58e-04 | 49 |
| GO:00355922 | Colorectum | MSS | establishment of protein localization to extracellular region | 98/3467 | 360/18723 | 2.75e-05 | 5.58e-04 | 98 |
| GO:00016782 | Colorectum | MSS | cellular glucose homeostasis | 54/3467 | 172/18723 | 3.11e-05 | 6.25e-04 | 54 |
| GO:00460312 | Colorectum | MSS | ADP metabolic process | 33/3467 | 90/18723 | 3.70e-05 | 7.09e-04 | 33 |
| GO:00017012 | Colorectum | MSS | in utero embryonic development | 99/3467 | 367/18723 | 3.71e-05 | 7.10e-04 | 99 |
| GO:00713312 | Colorectum | MSS | cellular response to hexose stimulus | 49/3467 | 153/18723 | 4.01e-05 | 7.61e-04 | 49 |
| GO:00716922 | Colorectum | MSS | protein localization to extracellular region | 99/3467 | 368/18723 | 4.17e-05 | 7.83e-04 | 99 |
| GO:00060902 | Colorectum | MSS | pyruvate metabolic process | 37/3467 | 106/18723 | 4.48e-05 | 8.28e-04 | 37 |
| GO:00713262 | Colorectum | MSS | cellular response to monosaccharide stimulus | 49/3467 | 154/18723 | 4.84e-05 | 8.80e-04 | 49 |
| GO:00550762 | Colorectum | MSS | transition metal ion homeostasis | 45/3467 | 138/18723 | 4.99e-05 | 9.02e-04 | 45 |
| GO:00709972 | Colorectum | MSS | neuron death | 97/3467 | 361/18723 | 5.21e-05 | 9.31e-04 | 97 |
| GO:00060962 | Colorectum | MSS | glycolytic process | 30/3467 | 81/18723 | 6.61e-05 | 1.15e-03 | 30 |
| GO:00091322 | Colorectum | MSS | nucleoside diphosphate metabolic process | 41/3467 | 124/18723 | 7.44e-05 | 1.24e-03 | 41 |
| GO:00605621 | Colorectum | MSS | epithelial tube morphogenesis | 88/3467 | 325/18723 | 8.45e-05 | 1.37e-03 | 88 |
| GO:00067572 | Colorectum | MSS | ATP generation from ADP | 30/3467 | 82/18723 | 8.59e-05 | 1.39e-03 | 30 |
| GO:00364732 | Colorectum | MSS | cell death in response to oxidative stress | 33/3467 | 95/18723 | 1.26e-04 | 1.93e-03 | 33 |
| GO:00016672 | Colorectum | MSS | ameboidal-type cell migration | 120/3467 | 475/18723 | 1.37e-04 | 2.05e-03 | 120 |
| GO:00107202 | Colorectum | MSS | positive regulation of cell development | 81/3467 | 298/18723 | 1.38e-04 | 2.06e-03 | 81 |
| Pathway ID | Tissue | Disease Stage | Description | Gene Ratio | Bg Ratio | pvalue | p.adjust | qvalue | Count |
| hsa0520820 | Cervix | CC | Chemical carcinogenesis - reactive oxygen species | 92/1267 | 223/8465 | 4.71e-22 | 5.09e-20 | 3.01e-20 | 92 |
| hsa0516720 | Cervix | CC | Kaposi sarcoma-associated herpesvirus infection | 60/1267 | 194/8465 | 9.74e-09 | 1.58e-07 | 9.33e-08 | 60 |
| hsa0520516 | Cervix | CC | Proteoglycans in cancer | 60/1267 | 205/8465 | 9.13e-08 | 1.18e-06 | 7.00e-07 | 60 |
| hsa0491918 | Cervix | CC | Thyroid hormone signaling pathway | 33/1267 | 121/8465 | 3.11e-04 | 1.65e-03 | 9.78e-04 | 33 |
| hsa0413718 | Cervix | CC | Mitophagy - animal | 22/1267 | 72/8465 | 5.77e-04 | 2.75e-03 | 1.63e-03 | 22 |
| hsa046596 | Cervix | CC | Th17 cell differentiation | 28/1267 | 108/8465 | 1.99e-03 | 7.98e-03 | 4.72e-03 | 28 |
| hsa052119 | Cervix | CC | Renal cell carcinoma | 20/1267 | 69/8465 | 2.07e-03 | 8.17e-03 | 4.83e-03 | 20 |
| hsa0406618 | Cervix | CC | HIF-1 signaling pathway | 27/1267 | 109/8465 | 4.72e-03 | 1.64e-02 | 9.72e-03 | 27 |
| hsa0523010 | Cervix | CC | Central carbon metabolism in cancer | 18/1267 | 70/8465 | 1.29e-02 | 3.87e-02 | 2.29e-02 | 18 |
| hsa05208110 | Cervix | CC | Chemical carcinogenesis - reactive oxygen species | 92/1267 | 223/8465 | 4.71e-22 | 5.09e-20 | 3.01e-20 | 92 |
| hsa05167110 | Cervix | CC | Kaposi sarcoma-associated herpesvirus infection | 60/1267 | 194/8465 | 9.74e-09 | 1.58e-07 | 9.33e-08 | 60 |
| hsa0520517 | Cervix | CC | Proteoglycans in cancer | 60/1267 | 205/8465 | 9.13e-08 | 1.18e-06 | 7.00e-07 | 60 |
| hsa0491919 | Cervix | CC | Thyroid hormone signaling pathway | 33/1267 | 121/8465 | 3.11e-04 | 1.65e-03 | 9.78e-04 | 33 |
| hsa0413719 | Cervix | CC | Mitophagy - animal | 22/1267 | 72/8465 | 5.77e-04 | 2.75e-03 | 1.63e-03 | 22 |
| hsa0465911 | Cervix | CC | Th17 cell differentiation | 28/1267 | 108/8465 | 1.99e-03 | 7.98e-03 | 4.72e-03 | 28 |
| hsa0521114 | Cervix | CC | Renal cell carcinoma | 20/1267 | 69/8465 | 2.07e-03 | 8.17e-03 | 4.83e-03 | 20 |
| hsa0406619 | Cervix | CC | HIF-1 signaling pathway | 27/1267 | 109/8465 | 4.72e-03 | 1.64e-02 | 9.72e-03 | 27 |
| hsa0523013 | Cervix | CC | Central carbon metabolism in cancer | 18/1267 | 70/8465 | 1.29e-02 | 3.87e-02 | 2.29e-02 | 18 |
| hsa05208 | Colorectum | AD | Chemical carcinogenesis - reactive oxygen species | 126/2092 | 223/8465 | 1.01e-24 | 1.68e-22 | 1.07e-22 | 126 |
| hsa04066 | Colorectum | AD | HIF-1 signaling pathway | 48/2092 | 109/8465 | 7.25e-06 | 7.84e-05 | 5.00e-05 | 48 |
| TF | Cell Type | Tissue | Disease Stage | Target Gene | RSS | Regulon Activity |
| HIF1A | MLUM | Breast | Healthy | TGM2,BZW1,NAMPT, etc. | 4.62e-01 |  |
| HIF1A | MES | Cervix | CC | HIF1A-AS3,SNAPC1,KRT6C, etc. | 7.02e-01 |  |
| HIF1A | PERI | Colorectum | FAP | SSH1,NUAK1,RUNX1, etc. | 4.34e-02 |  |
| HIF1A | ICAF | Colorectum | SER | SSH1,NUAK1,RUNX1, etc. | 3.93e-01 |  |
| HIF1A | PMC | Stomach | CAG with IM | PLPP3,SERPINA3,SOD2, etc. | 2.12e-01 |  |
| HIF1A | GMC | Stomach | CAG with IM | PLPP3,SERPINA3,SOD2, etc. | 1.31e-01 | |
| HIF1A | PMC | Stomach | SIM | PLPP3,SERPINA3,SOD2, etc. | 4.96e-01 |  |
| HIF1A | GMC | Stomach | WIM | PLPP3,SERPINA3,SOD2, etc. | 7.45e-02 |  |
| Hugo Symbol | Variant Class | Variant Classification | dbSNP RS | HGVSc | HGVSp | HGVSp Short | SWISSPROT | BIOTYPE | SIFT | PolyPhen | Tumor Sample Barcode | Tissue | Histology | Sex | Age | Stage | Therapy Types | Drugs | Outcome |
| HIF1A | SNV | Missense_Mutation | novel | c.1022T>G | p.Val341Gly | p.V341G | Q16665 | protein_coding | deleterious(0) | probably_damaging(0.969) | TCGA-A8-A095-01 | Breast | breast invasive carcinoma | Female | <65 | I/II | Chemotherapy | 5-fluorouracil | CR |
| HIF1A | SNV | Missense_Mutation | rs540883086 | c.853N>A | p.Glu285Lys | p.E285K | Q16665 | protein_coding | deleterious(0) | possibly_damaging(0.473) | TCGA-AN-A046-01 | Breast | breast invasive carcinoma | Female | >=65 | I/II | Unknown | Unknown | SD |
| HIF1A | SNV | Missense_Mutation | | c.1713N>T | p.Lys571Asn | p.K571N | Q16665 | protein_coding | tolerated(0.1) | probably_damaging(0.916) | TCGA-AN-A046-01 | Breast | breast invasive carcinoma | Female | >=65 | I/II | Unknown | Unknown | SD |
| HIF1A | SNV | Missense_Mutation | novel | c.1752N>T | p.Glu584Asp | p.E584D | Q16665 | protein_coding | deleterious(0.01) | possibly_damaging(0.557) | TCGA-AN-A046-01 | Breast | breast invasive carcinoma | Female | >=65 | I/II | Unknown | Unknown | SD |
| HIF1A | SNV | Missense_Mutation | rs746540920 | c.157N>T | p.Arg53Trp | p.R53W | Q16665 | protein_coding | deleterious(0) | probably_damaging(0.998) | TCGA-AN-A0AK-01 | Breast | breast invasive carcinoma | Female | >=65 | I/II | Unknown | Unknown | SD |
| HIF1A | SNV | Missense_Mutation | | c.2485N>G | p.Pro829Ala | p.P829A | Q16665 | protein_coding | deleterious(0) | probably_damaging(1) | TCGA-BH-A0H5-01 | Breast | breast invasive carcinoma | Female | <65 | I/II | Chemotherapy | cytoxan | CR |
| HIF1A | SNV | Missense_Mutation | | c.1996C>T | p.Pro666Ser | p.P666S | Q16665 | protein_coding | tolerated(0.1) | benign(0.01) | TCGA-BH-A18P-01 | Breast | breast invasive carcinoma | Female | <65 | I/II | Unknown | Unknown | PD |
| HIF1A | SNV | Missense_Mutation | rs776377120 | c.196C>T | p.His66Tyr | p.H66Y | Q16665 | protein_coding | deleterious(0.02) | benign(0.023) | TCGA-D8-A1J8-01 | Breast | breast invasive carcinoma | Female | >=65 | I/II | Hormone Therapy | nolvadex | SD |
| HIF1A | SNV | Missense_Mutation | novel | c.2122C>G | p.His708Asp | p.H708D | Q16665 | protein_coding | tolerated(0.2) | benign(0.07) | TCGA-EA-A3HU-01 | Cervix | cervical & endocervical cancer | Female | <65 | I/II | Unknown | Unknown | SD |
| HIF1A | SNV | Missense_Mutation | | c.412G>C | p.Asp138His | p.D138H | Q16665 | protein_coding | deleterious(0) | possibly_damaging(0.811) | TCGA-EK-A2PL-01 | Cervix | cervical & endocervical cancer | Female | <65 | III/IV | Unknown | Unknown | SD |
| Entrez ID | Symbol | Category | Interaction Types | Drug Claim Name | Drug Name | PMIDs |
| 3091 | HIF1A | TRANSPORTER, TRANSCRIPTION FACTOR, ENZYME, DRUGGABLE GENOME, TRANSCRIPTION FACTOR COMPLEX, CLINICALLY ACTIONABLE | | SP-600125 | SP-600125 | |
| 3091 | HIF1A | TRANSPORTER, TRANSCRIPTION FACTOR, ENZYME, DRUGGABLE GENOME, TRANSCRIPTION FACTOR COMPLEX, CLINICALLY ACTIONABLE | | LEVONORDEFRIN | LEVONORDEFRIN | |
| 3091 | HIF1A | TRANSPORTER, TRANSCRIPTION FACTOR, ENZYME, DRUGGABLE GENOME, TRANSCRIPTION FACTOR COMPLEX, CLINICALLY ACTIONABLE | | DNDI1417388 | CHEMBL1528359 | |
| 3091 | HIF1A | TRANSPORTER, TRANSCRIPTION FACTOR, ENZYME, DRUGGABLE GENOME, TRANSCRIPTION FACTOR COMPLEX, CLINICALLY ACTIONABLE | | NOSCAPINE | NOSCAPINE | |
| 3091 | HIF1A | TRANSPORTER, TRANSCRIPTION FACTOR, ENZYME, DRUGGABLE GENOME, TRANSCRIPTION FACTOR COMPLEX, CLINICALLY ACTIONABLE | | NSC-117079 | CHEMBL471225 | |
| 3091 | HIF1A | TRANSPORTER, TRANSCRIPTION FACTOR, ENZYME, DRUGGABLE GENOME, TRANSCRIPTION FACTOR COMPLEX, CLINICALLY ACTIONABLE | | TYRPHOSTIN A9 | TYRPHOSTIN A9 | |
| 3091 | HIF1A | TRANSPORTER, TRANSCRIPTION FACTOR, ENZYME, DRUGGABLE GENOME, TRANSCRIPTION FACTOR COMPLEX, CLINICALLY ACTIONABLE | | PX-478 | PX-478 | |
| 3091 | HIF1A | TRANSPORTER, TRANSCRIPTION FACTOR, ENZYME, DRUGGABLE GENOME, TRANSCRIPTION FACTOR COMPLEX, CLINICALLY ACTIONABLE | | PIMOZIDE | PIMOZIDE | |
| 3091 | HIF1A | TRANSPORTER, TRANSCRIPTION FACTOR, ENZYME, DRUGGABLE GENOME, TRANSCRIPTION FACTOR COMPLEX, CLINICALLY ACTIONABLE | | BECLOMETHASONE | BECLOMETHASONE | |
| 3091 | HIF1A | TRANSPORTER, TRANSCRIPTION FACTOR, ENZYME, DRUGGABLE GENOME, TRANSCRIPTION FACTOR COMPLEX, CLINICALLY ACTIONABLE | | GELDANAMYCIN | GELDANAMYCIN | 12811834 |


