
|
|||||
|
 | |
| |
| |
| |
| |
| |
|
Gene: FERMT2 |
Gene summary for FERMT2 |
| Gene information | Species | Human | Gene symbol | FERMT2 | Gene ID | 10979 |
| Gene name | FERM domain containing kindlin 2 | |
| Gene Alias | KIND2 | |
| Cytomap | 14q22.1 | |
| Gene Type | protein-coding | GO ID | GO:0000165 | UniProtAcc | Q96AC1 |
Top |
Malignant transformation analysis |
| Identification of the aberrant gene expression in precancerous and cancerous lesions by comparing the gene expression of stem-like cells in diseased tissues with normal stem cells |
| Entrez ID | Symbol | Replicates | Species | Organ | Tissue | Adj P-value | Log2FC | Malignancy |
| 10979 | FERMT2 | P2T-E | Human | Esophagus | ESCC | 1.02e-09 | 1.63e-01 | 0.1177 |
| 10979 | FERMT2 | P4T-E | Human | Esophagus | ESCC | 2.45e-06 | 4.69e-01 | 0.1323 |
| 10979 | FERMT2 | P5T-E | Human | Esophagus | ESCC | 7.03e-05 | 2.62e-01 | 0.1327 |
| 10979 | FERMT2 | P8T-E | Human | Esophagus | ESCC | 6.83e-14 | 2.37e-01 | 0.0889 |
| 10979 | FERMT2 | P9T-E | Human | Esophagus | ESCC | 2.10e-15 | 3.38e-01 | 0.1131 |
| 10979 | FERMT2 | P10T-E | Human | Esophagus | ESCC | 4.95e-21 | 4.56e-01 | 0.116 |
| 10979 | FERMT2 | P11T-E | Human | Esophagus | ESCC | 1.10e-04 | 3.85e-01 | 0.1426 |
| 10979 | FERMT2 | P12T-E | Human | Esophagus | ESCC | 8.68e-15 | 3.61e-01 | 0.1122 |
| 10979 | FERMT2 | P16T-E | Human | Esophagus | ESCC | 1.97e-12 | 2.96e-01 | 0.1153 |
| 10979 | FERMT2 | P19T-E | Human | Esophagus | ESCC | 1.52e-06 | 1.01e+00 | 0.1662 |
| 10979 | FERMT2 | P20T-E | Human | Esophagus | ESCC | 1.01e-02 | 4.70e-02 | 0.1124 |
| 10979 | FERMT2 | P21T-E | Human | Esophagus | ESCC | 4.15e-03 | 9.79e-02 | 0.1617 |
| 10979 | FERMT2 | P22T-E | Human | Esophagus | ESCC | 5.14e-03 | 1.09e-01 | 0.1236 |
| 10979 | FERMT2 | P23T-E | Human | Esophagus | ESCC | 3.81e-05 | 1.34e-01 | 0.108 |
| 10979 | FERMT2 | P24T-E | Human | Esophagus | ESCC | 4.09e-16 | 4.75e-01 | 0.1287 |
| 10979 | FERMT2 | P26T-E | Human | Esophagus | ESCC | 9.45e-09 | 3.55e-01 | 0.1276 |
| 10979 | FERMT2 | P28T-E | Human | Esophagus | ESCC | 5.50e-18 | 4.03e-01 | 0.1149 |
| 10979 | FERMT2 | P30T-E | Human | Esophagus | ESCC | 3.29e-11 | 4.68e-01 | 0.137 |
| 10979 | FERMT2 | P32T-E | Human | Esophagus | ESCC | 4.41e-06 | 3.78e-01 | 0.1666 |
| 10979 | FERMT2 | P36T-E | Human | Esophagus | ESCC | 5.49e-05 | 2.39e-01 | 0.1187 |
| Page: 1 2 3 4 |
| Tissue | Expression Dynamics | Abbreviation |
| Esophagus |  | ESCC: Esophageal squamous cell carcinoma |
| HGIN: High-grade intraepithelial neoplasias | ||
| LGIN: Low-grade intraepithelial neoplasias | ||
| Liver | 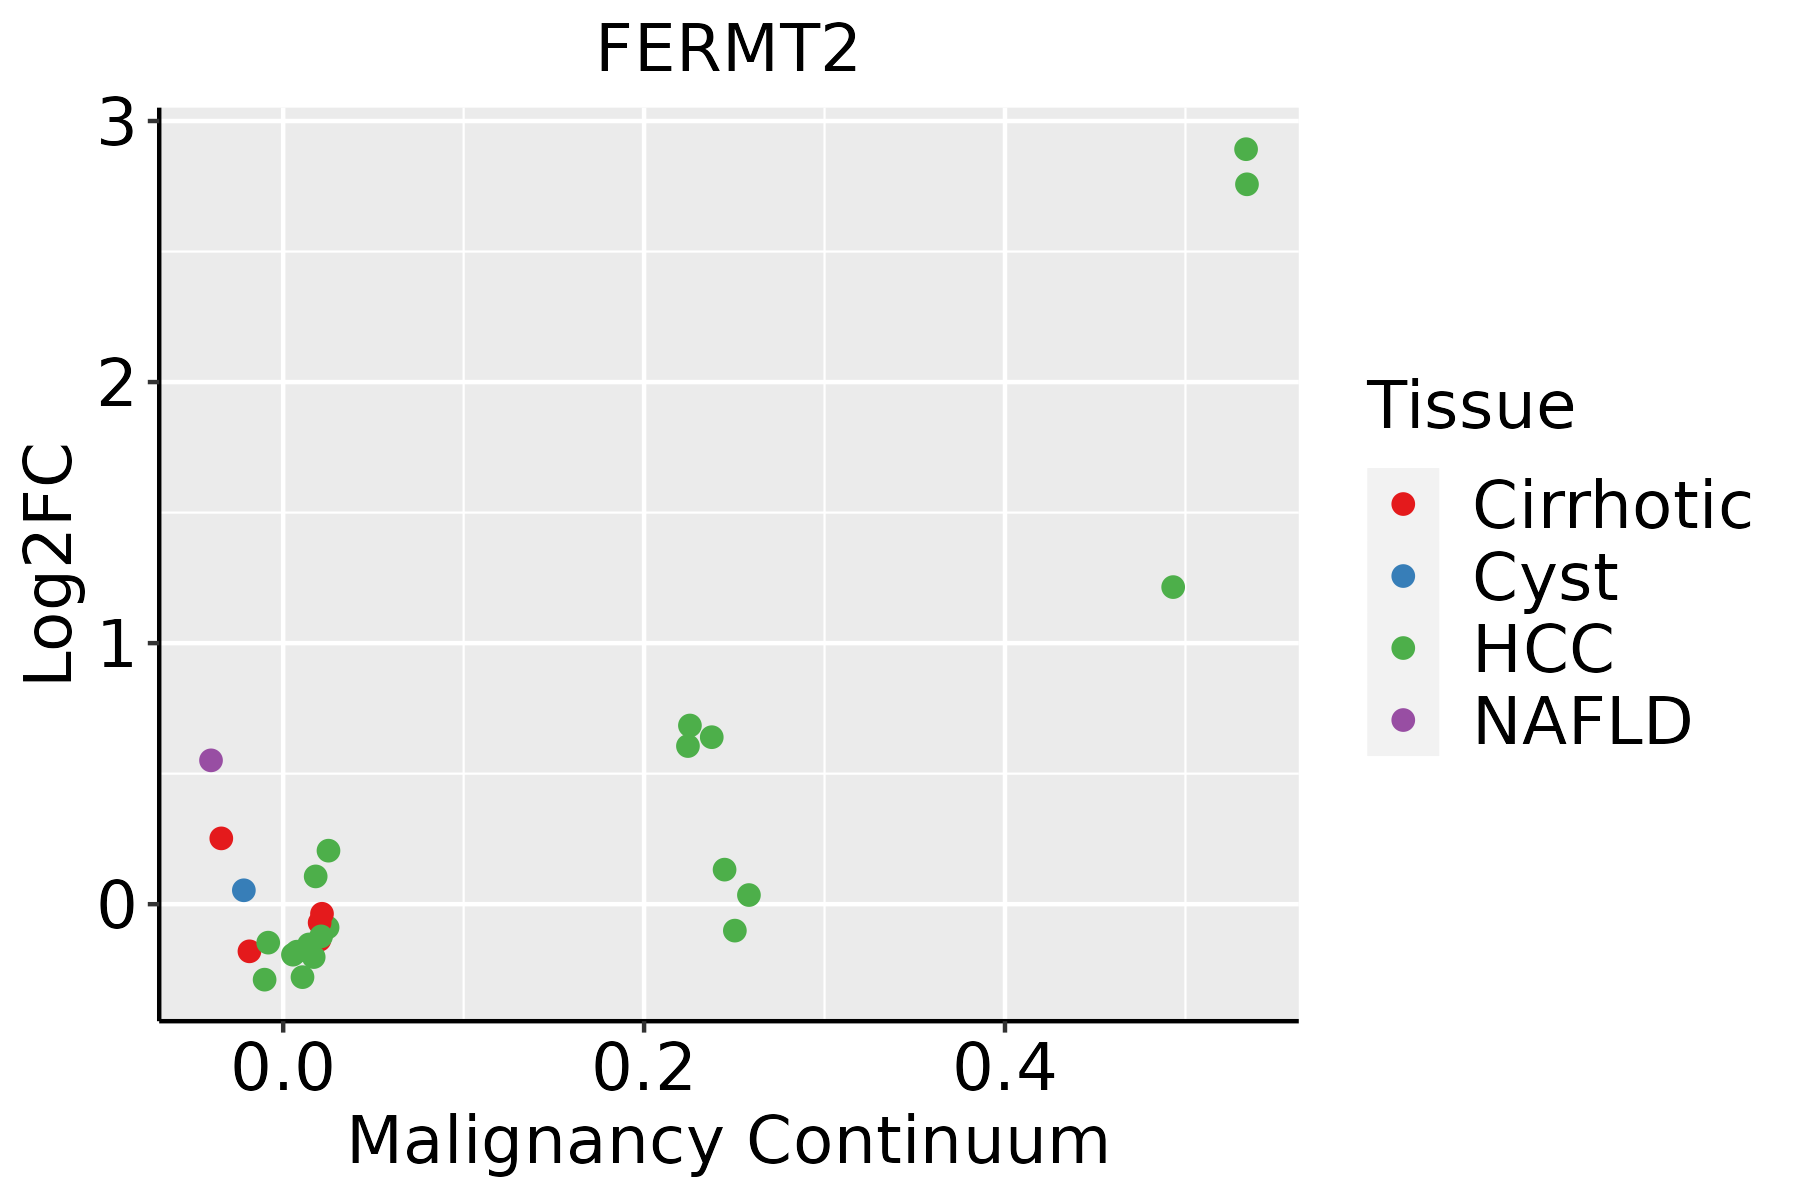 | HCC: Hepatocellular carcinoma |
| NAFLD: Non-alcoholic fatty liver disease | ||
| Prostate | 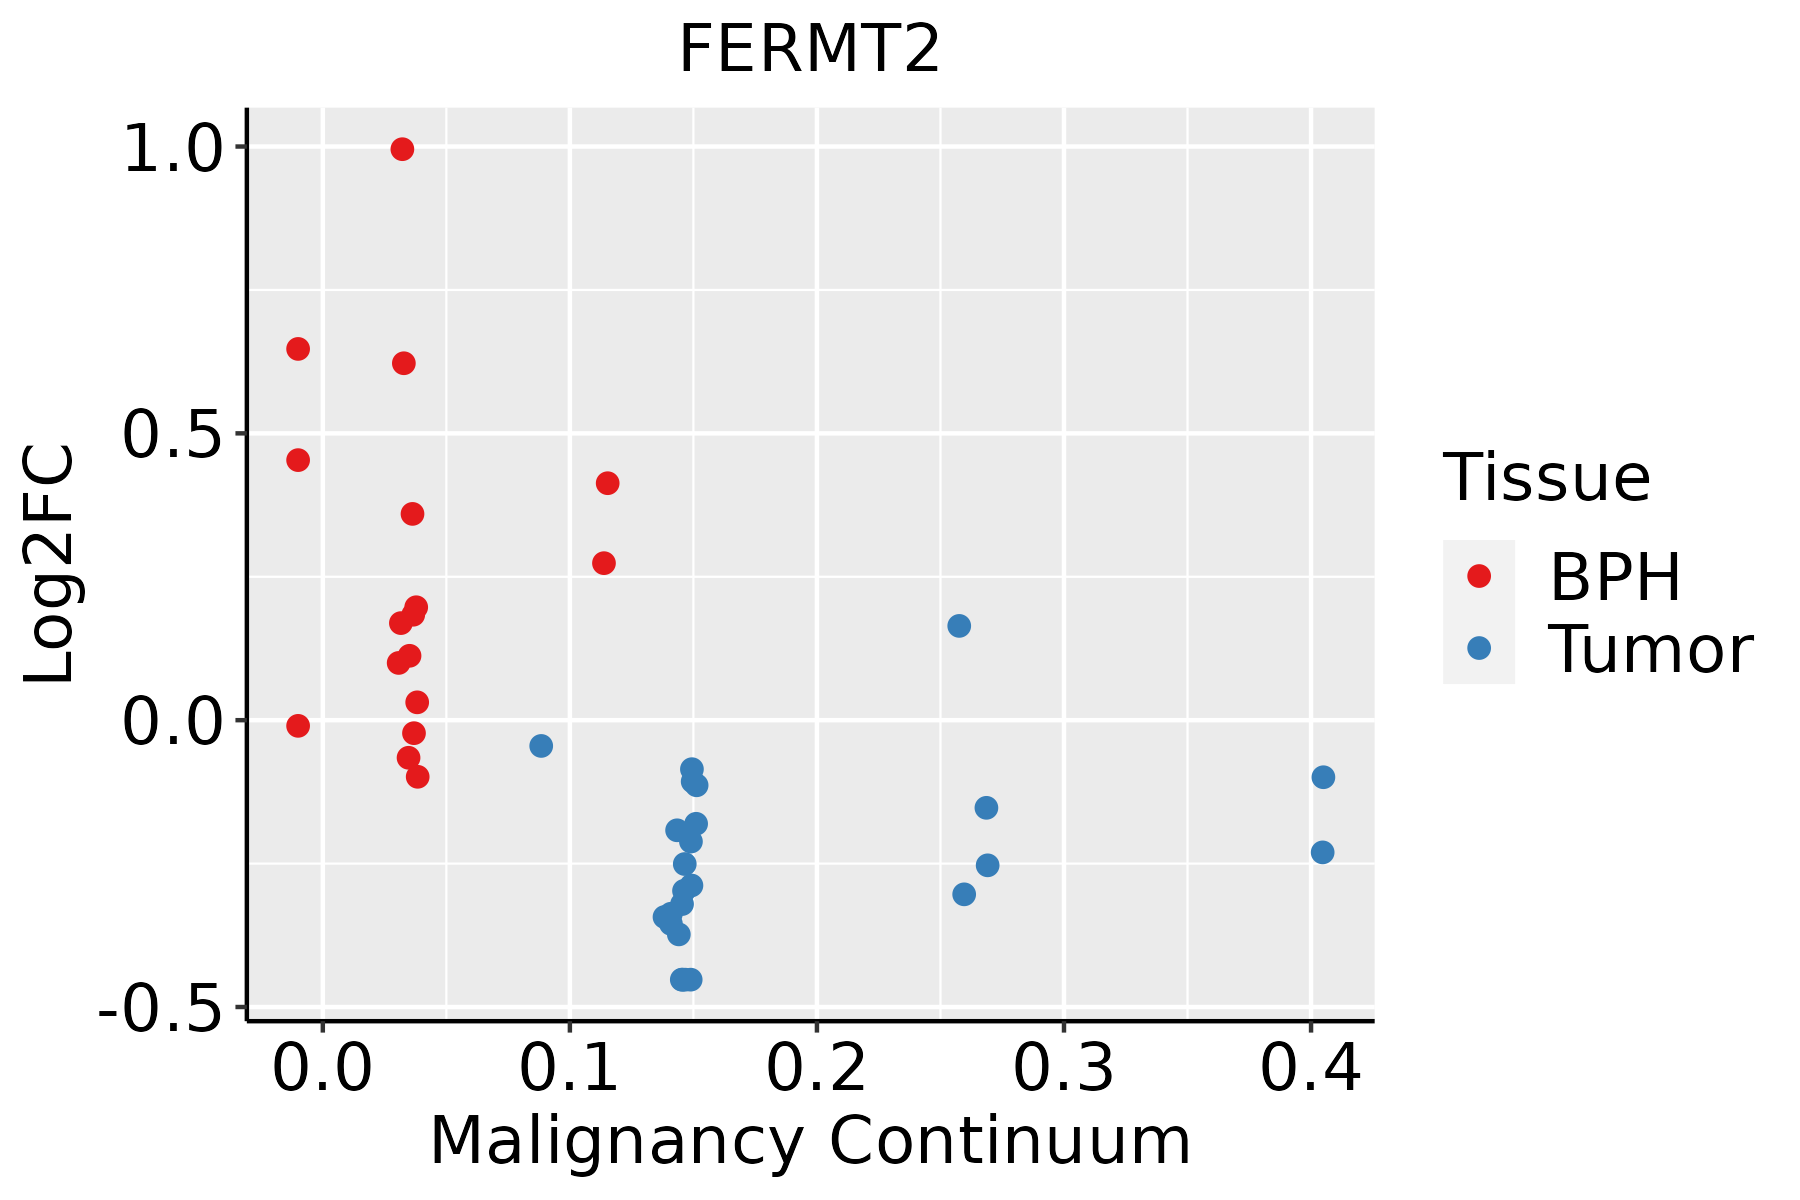 | BPH: Benign Prostatic Hyperplasia |
| Thyroid | 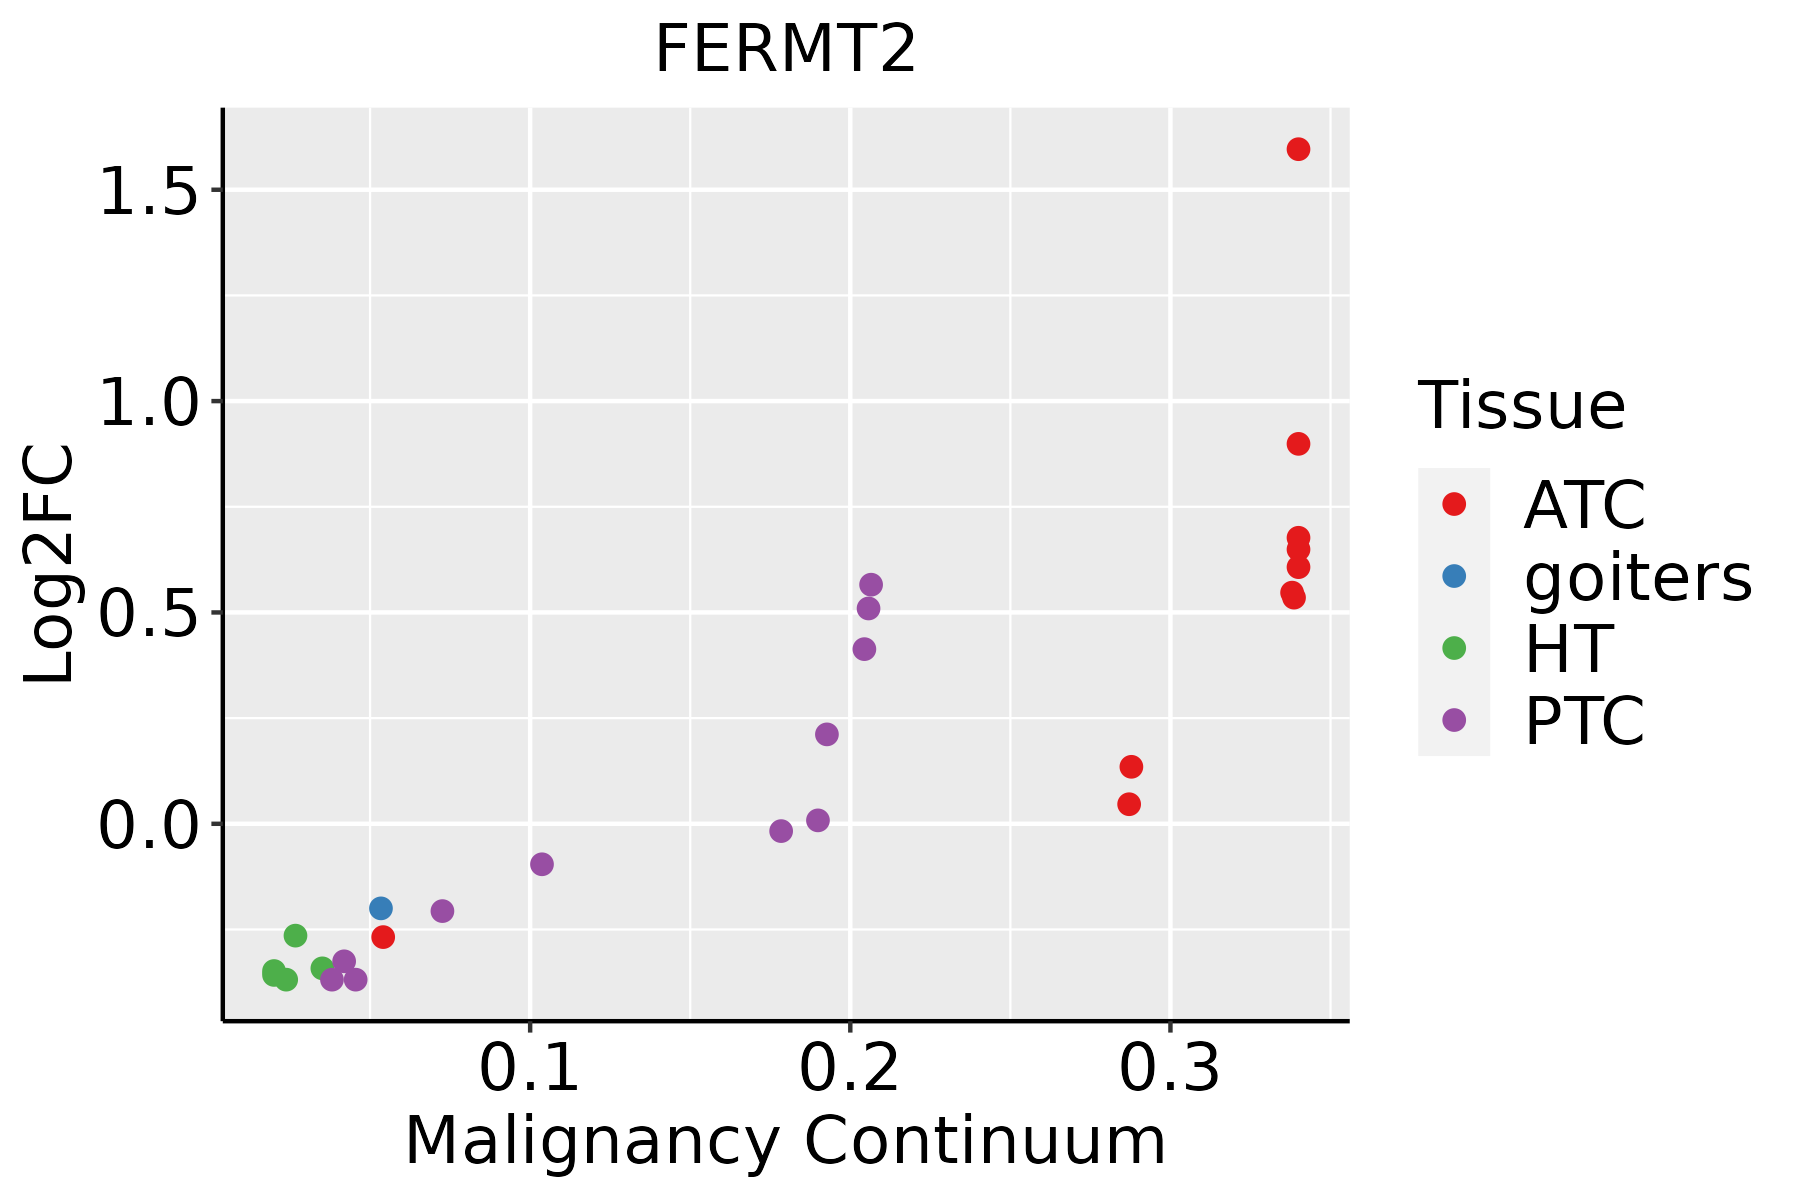 | ATC: Anaplastic thyroid cancer |
| HT: Hashimoto's thyroiditis | ||
| PTC: Papillary thyroid cancer |
| ∗log2FC in expression of this searched gene in stem-like cells from each diseased tissue sample relative to stem-like cells in normal samples in each tissue plotted against the malignancy continuum. Samples are colored based on if they are from different disease stage. |
Top |
Malignant transformation related pathway analysis |
| Find out the enriched GO biological processes and KEGG pathways involved in transition from healthy to precancer to cancer |
| Tissue | Disease Stage | Enriched GO biological Processes |
| Colorectum | AD |  |
| Colorectum | SER |  |
| Colorectum | MSS |  |
| Colorectum | MSI-H |  |
| Colorectum | FAP |  |
| ∗Top 15 enriched GO BP terms are showed in the bar plot of each disease state in each tissue. Each row represents a significant GO biological process which is colored according to the -log10(p.adjust). |
| Page: 1 2 3 4 5 6 7 8 9 |
| GO ID | Tissue | Disease Stage | Description | Gene Ratio | Bg Ratio | pvalue | p.adjust | Count |
| GO:007156019 | Thyroid | PTC | cellular response to transforming growth factor beta stimulus | 126/5968 | 250/18723 | 7.34e-10 | 2.19e-08 | 126 |
| GO:000717919 | Thyroid | PTC | transforming growth factor beta receptor signaling pathway | 104/5968 | 198/18723 | 1.20e-09 | 3.47e-08 | 104 |
| GO:0010810112 | Thyroid | PTC | regulation of cell-substrate adhesion | 113/5968 | 221/18723 | 1.87e-09 | 5.28e-08 | 113 |
| GO:0031589111 | Thyroid | PTC | cell-substrate adhesion | 169/5968 | 363/18723 | 2.73e-09 | 7.57e-08 | 169 |
| GO:0051893111 | Thyroid | PTC | regulation of focal adhesion assembly | 44/5968 | 66/18723 | 6.73e-09 | 1.70e-07 | 44 |
| GO:0090109111 | Thyroid | PTC | regulation of cell-substrate junction assembly | 44/5968 | 66/18723 | 6.73e-09 | 1.70e-07 | 44 |
| GO:0042060112 | Thyroid | PTC | wound healing | 190/5968 | 422/18723 | 7.72e-09 | 1.92e-07 | 190 |
| GO:0045860111 | Thyroid | PTC | positive regulation of protein kinase activity | 176/5968 | 386/18723 | 8.89e-09 | 2.17e-07 | 176 |
| GO:0071900110 | Thyroid | PTC | regulation of protein serine/threonine kinase activity | 164/5968 | 359/18723 | 2.41e-08 | 5.43e-07 | 164 |
| GO:0010769111 | Thyroid | PTC | regulation of cell morphogenesis involved in differentiation | 57/5968 | 96/18723 | 2.50e-08 | 5.62e-07 | 57 |
| GO:0051017112 | Thyroid | PTC | actin filament bundle assembly | 83/5968 | 157/18723 | 3.73e-08 | 8.18e-07 | 83 |
| GO:0061572112 | Thyroid | PTC | actin filament bundle organization | 84/5968 | 161/18723 | 6.75e-08 | 1.40e-06 | 84 |
| GO:001072018 | Thyroid | PTC | positive regulation of cell development | 138/5968 | 298/18723 | 1.13e-07 | 2.22e-06 | 138 |
| GO:0010770111 | Thyroid | PTC | positive regulation of cell morphogenesis involved in differentiation | 48/5968 | 79/18723 | 1.15e-07 | 2.26e-06 | 48 |
| GO:000195220 | Thyroid | PTC | regulation of cell-matrix adhesion | 69/5968 | 128/18723 | 1.92e-07 | 3.51e-06 | 69 |
| GO:0033674111 | Thyroid | PTC | positive regulation of kinase activity | 201/5968 | 467/18723 | 1.95e-07 | 3.54e-06 | 201 |
| GO:0001503110 | Thyroid | PTC | ossification | 176/5968 | 408/18723 | 9.26e-07 | 1.40e-05 | 176 |
| GO:000717819 | Thyroid | PTC | transmembrane receptor protein serine/threonine kinase signaling pathway | 156/5968 | 355/18723 | 1.02e-06 | 1.51e-05 | 156 |
| GO:0010811112 | Thyroid | PTC | positive regulation of cell-substrate adhesion | 65/5968 | 123/18723 | 1.10e-06 | 1.62e-05 | 65 |
| GO:0034329111 | Thyroid | PTC | cell junction assembly | 180/5968 | 420/18723 | 1.17e-06 | 1.69e-05 | 180 |
| Page: 1 2 3 4 5 6 7 8 9 10 11 12 13 14 15 16 17 18 19 20 21 22 23 24 25 26 27 28 29 30 31 32 33 34 35 |
| Pathway ID | Tissue | Disease Stage | Description | Gene Ratio | Bg Ratio | pvalue | p.adjust | qvalue | Count |
| Page: 1 |
Top |
Cell-cell communication analysis |
| Identification of potential cell-cell interactions between two cell types and their ligand-receptor pairs for different disease states |
| Ligand | Receptor | LRpair | Pathway | Tissue | Disease Stage |
| Page: 1 |
Top |
Single-cell gene regulatory network inference analysis |
| Find out the significant the regulons (TFs) and the target genes of each regulon across cell types for different disease states |
| TF | Cell Type | Tissue | Disease Stage | Target Gene | RSS | Regulon Activity |
| ∗The dot plots of a searched regulon are shown for all cell subpopulations in each disease state of each tissue based on the regulon specific score inferred using pySCENIC and by calculating the average expression. |
| Page: 1 |
Top |
Somatic mutation of malignant transformation related genes |
| Annotation of somatic variants for genes involved in malignant transformation |
| Hugo Symbol | Variant Class | Variant Classification | dbSNP RS | HGVSc | HGVSp | HGVSp Short | SWISSPROT | BIOTYPE | SIFT | PolyPhen | Tumor Sample Barcode | Tissue | Histology | Sex | Age | Stage | Therapy Types | Drugs | Outcome |
| FERMT2 | SNV | Missense_Mutation | novel | c.1513N>T | p.Pro505Ser | p.P505S | Q96AC1 | protein_coding | tolerated(0.31) | benign(0.012) | TCGA-AN-A046-01 | Breast | breast invasive carcinoma | Female | >=65 | I/II | Unknown | Unknown | SD |
| FERMT2 | SNV | Missense_Mutation | c.1900N>C | p.Glu634Gln | p.E634Q | Q96AC1 | protein_coding | tolerated(0.64) | possibly_damaging(0.677) | TCGA-C8-A1HF-01 | Breast | breast invasive carcinoma | Female | <65 | I/II | Unknown | Unknown | SD | |
| FERMT2 | insertion | Frame_Shift_Ins | novel | c.1909_1910insGGCTTAACCTATATGAACTCTATTTATCATGTCTA | p.Asp637GlyfsTer24 | p.D637Gfs*24 | Q96AC1 | protein_coding | TCGA-AO-A0JB-01 | Breast | breast invasive carcinoma | Female | <65 | III/IV | Chemotherapy | cyclophosphamide | SD | ||
| FERMT2 | deletion | Frame_Shift_Del | novel | c.55delN | p.Glu19AsnfsTer2 | p.E19Nfs*2 | Q96AC1 | protein_coding | TCGA-D8-A27V-01 | Breast | breast invasive carcinoma | Female | <65 | I/II | Hormone Therapy | tamoxiphen | SD | ||
| FERMT2 | SNV | Missense_Mutation | c.1095T>G | p.Ile365Met | p.I365M | Q96AC1 | protein_coding | tolerated(0.29) | possibly_damaging(0.653) | TCGA-FU-A3HZ-01 | Cervix | cervical & endocervical cancer | Female | <65 | I/II | Chemotherapy | cisplatin | CR | |
| FERMT2 | SNV | Missense_Mutation | c.997N>C | p.Glu333Gln | p.E333Q | Q96AC1 | protein_coding | tolerated(0.5) | benign(0.291) | TCGA-IR-A3LA-01 | Cervix | cervical & endocervical cancer | Female | <65 | I/II | Chemotherapy | cisplatin | CR | |
| FERMT2 | SNV | Missense_Mutation | c.720A>T | p.Gln240His | p.Q240H | Q96AC1 | protein_coding | deleterious(0.02) | possibly_damaging(0.871) | TCGA-A6-4105-01 | Colorectum | colon adenocarcinoma | Male | >=65 | I/II | Unknown | Unknown | PD | |
| FERMT2 | SNV | Missense_Mutation | c.1997N>A | p.Arg666His | p.R666H | Q96AC1 | protein_coding | deleterious(0) | probably_damaging(0.999) | TCGA-AA-3509-01 | Colorectum | colon adenocarcinoma | Female | <65 | I/II | Unknown | Unknown | SD | |
| FERMT2 | SNV | Missense_Mutation | c.1316T>G | p.Phe439Cys | p.F439C | Q96AC1 | protein_coding | deleterious(0) | probably_damaging(0.984) | TCGA-AA-3851-01 | Colorectum | colon adenocarcinoma | Male | >=65 | I/II | Unknown | Unknown | SD | |
| FERMT2 | SNV | Missense_Mutation | c.106A>G | p.Thr36Ala | p.T36A | Q96AC1 | protein_coding | tolerated(0.35) | benign(0.108) | TCGA-AA-3977-01 | Colorectum | colon adenocarcinoma | Male | >=65 | I/II | Unknown | Unknown | SD |
| Page: 1 2 3 4 5 6 7 |
Top |
Related drugs of malignant transformation related genes |
| Identification of chemicals and drugs interact with genes involved in malignant transfromation |
| (DGIdb 4.0) |
| Entrez ID | Symbol | Category | Interaction Types | Drug Claim Name | Drug Name | PMIDs |
| Page: 1 |

Copyright 2023-Present -The University of Texas Health Science Center at Houston |