| Tissue | Expression Dynamics | Abbreviation |
| Colorectum (GSE201348) | 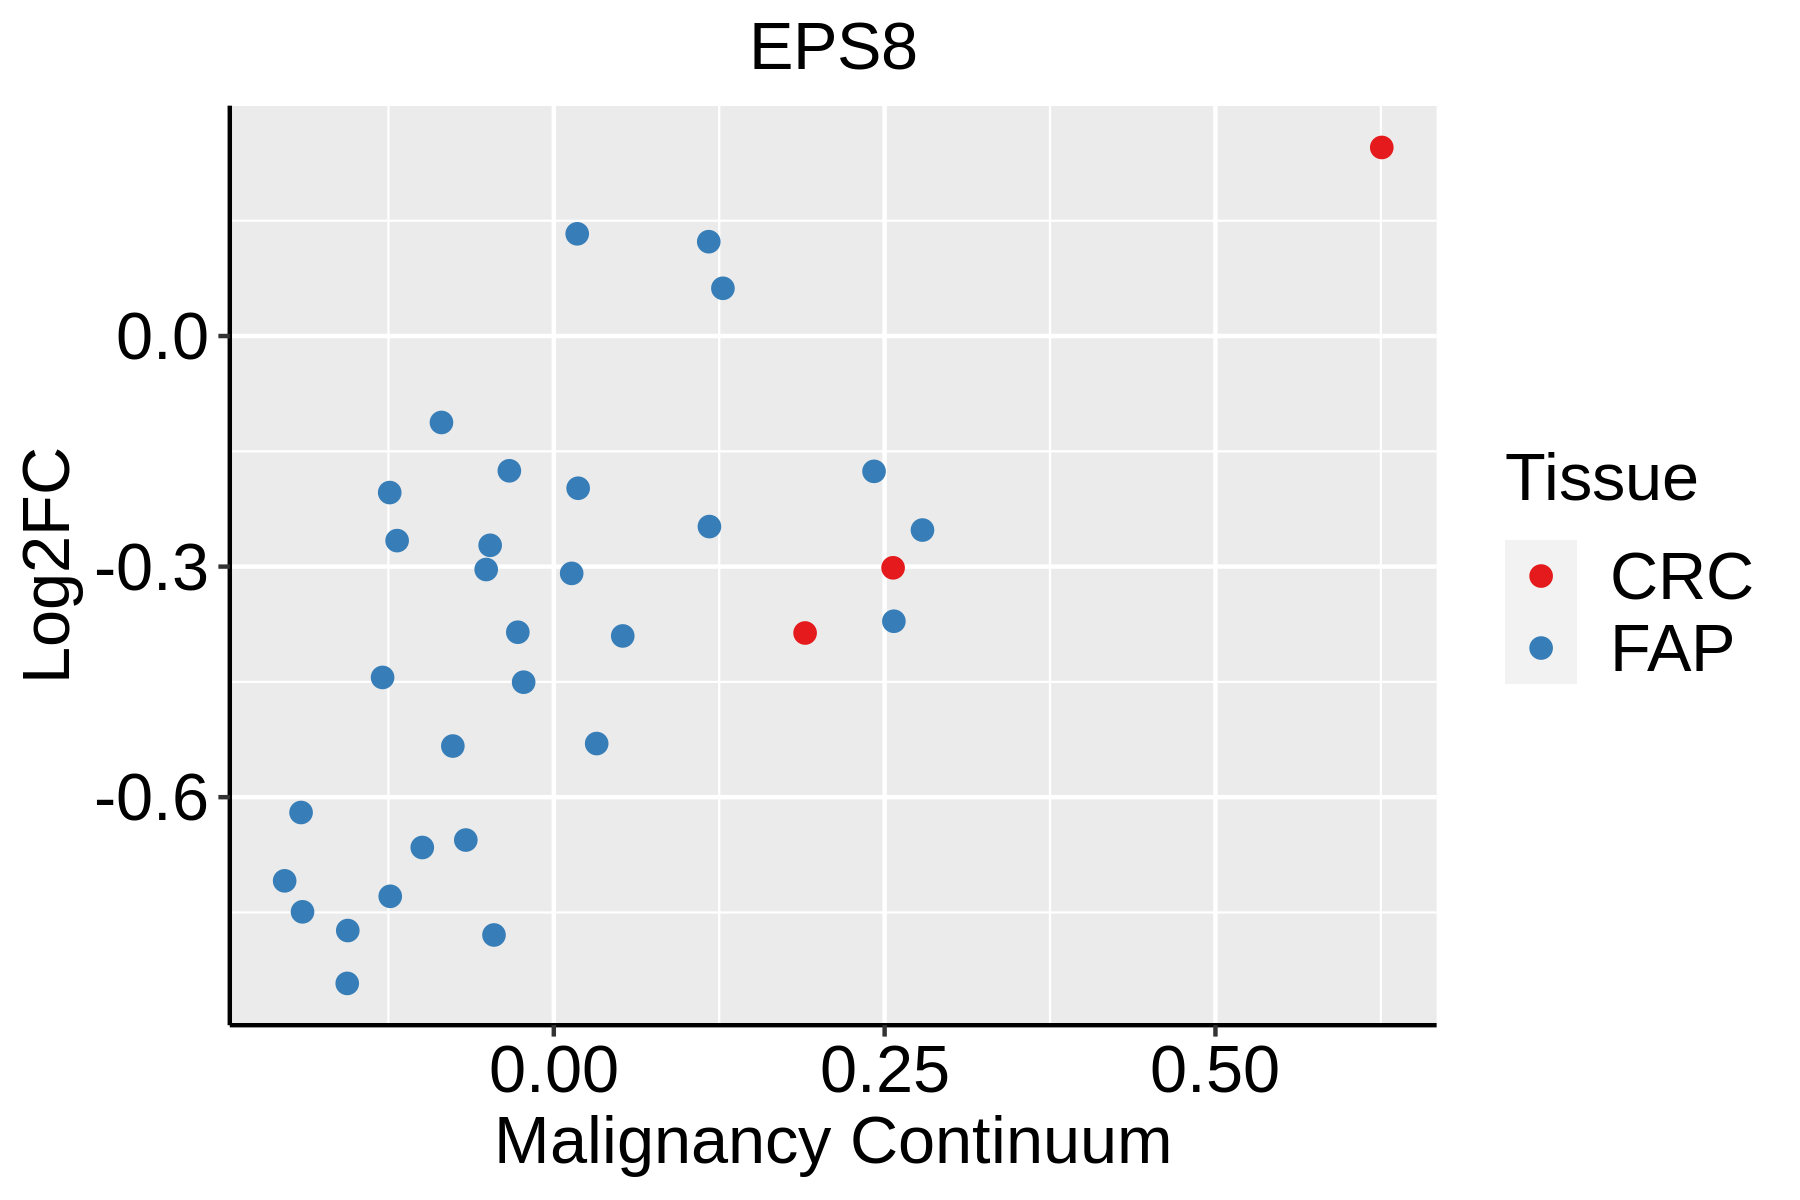 | FAP: Familial adenomatous polyposis |
| CRC: Colorectal cancer |
| Colorectum (HTA11) | 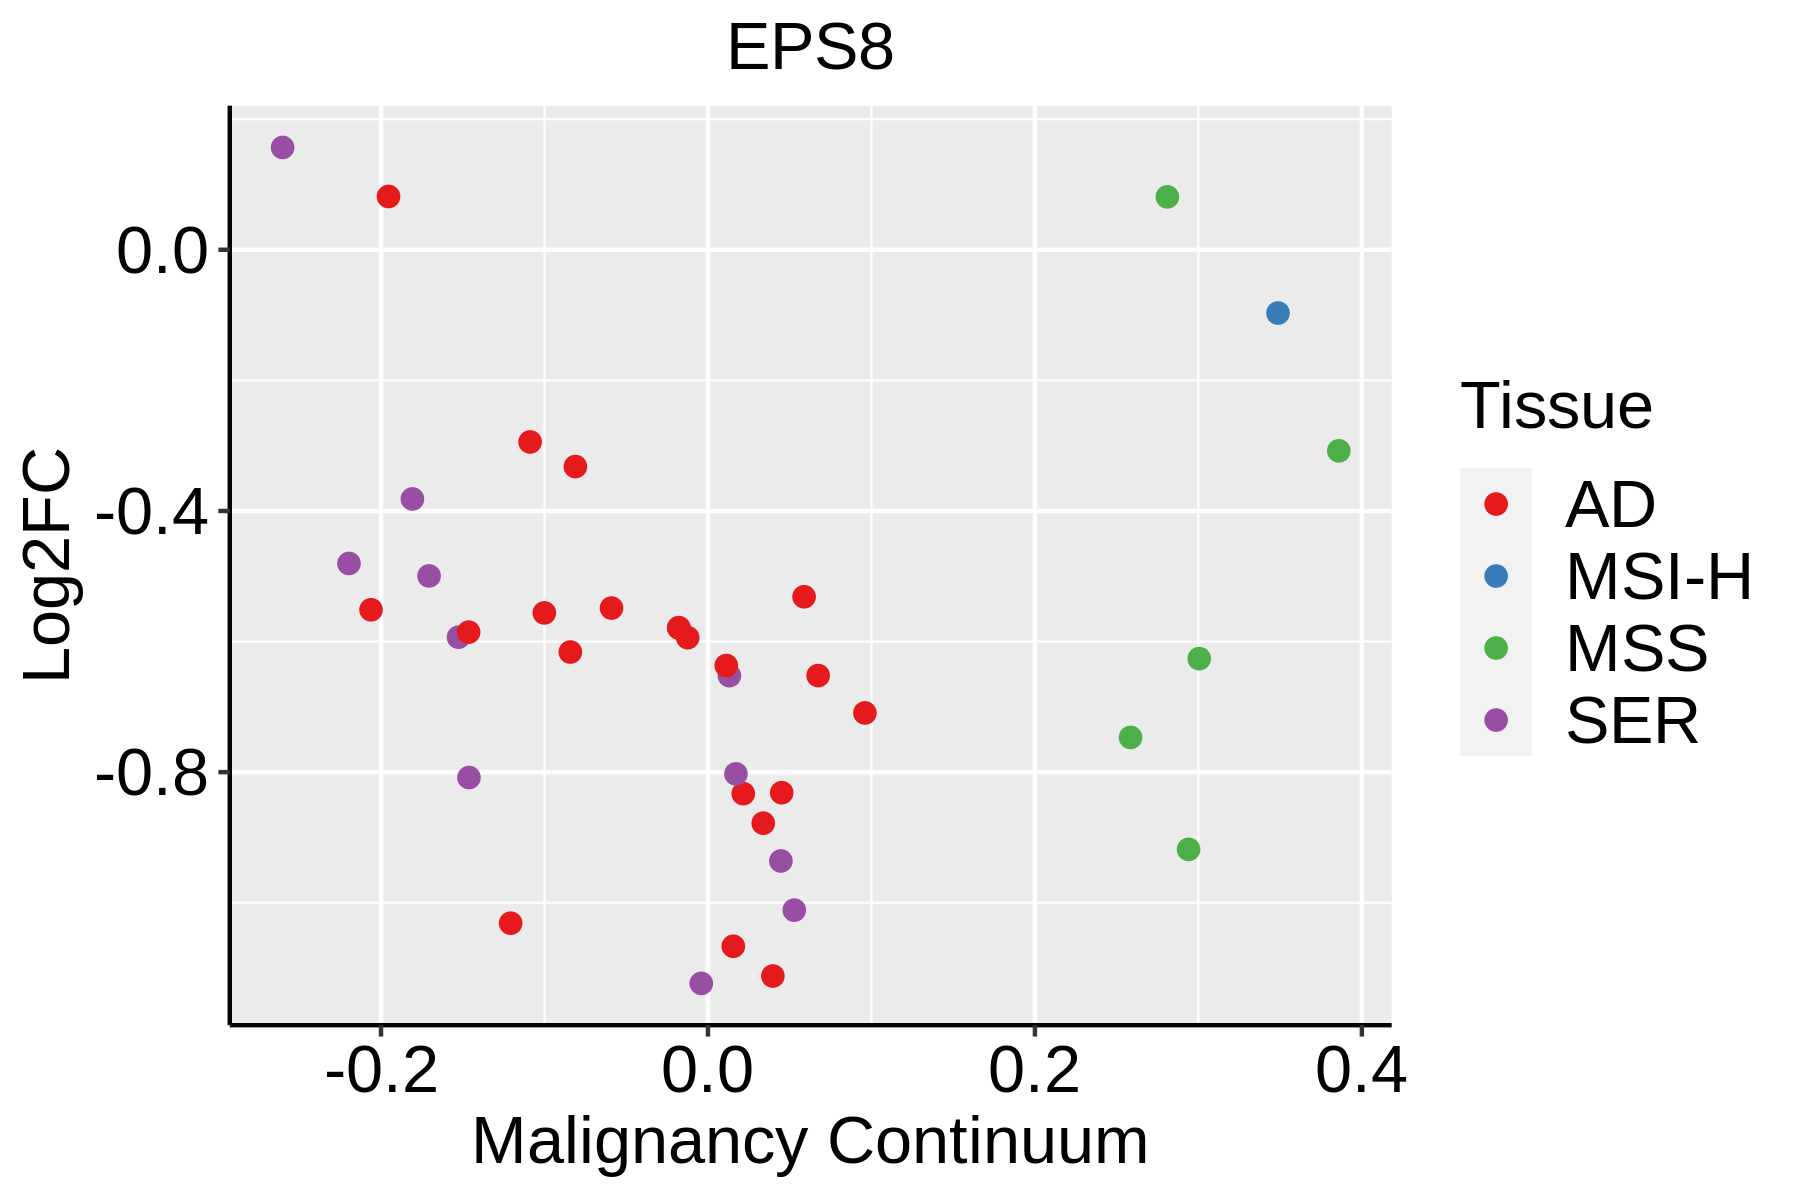 | AD: Adenomas |
| SER: Sessile serrated lesions |
| MSI-H: Microsatellite-high colorectal cancer |
| MSS: Microsatellite stable colorectal cancer |
| Endometrium | 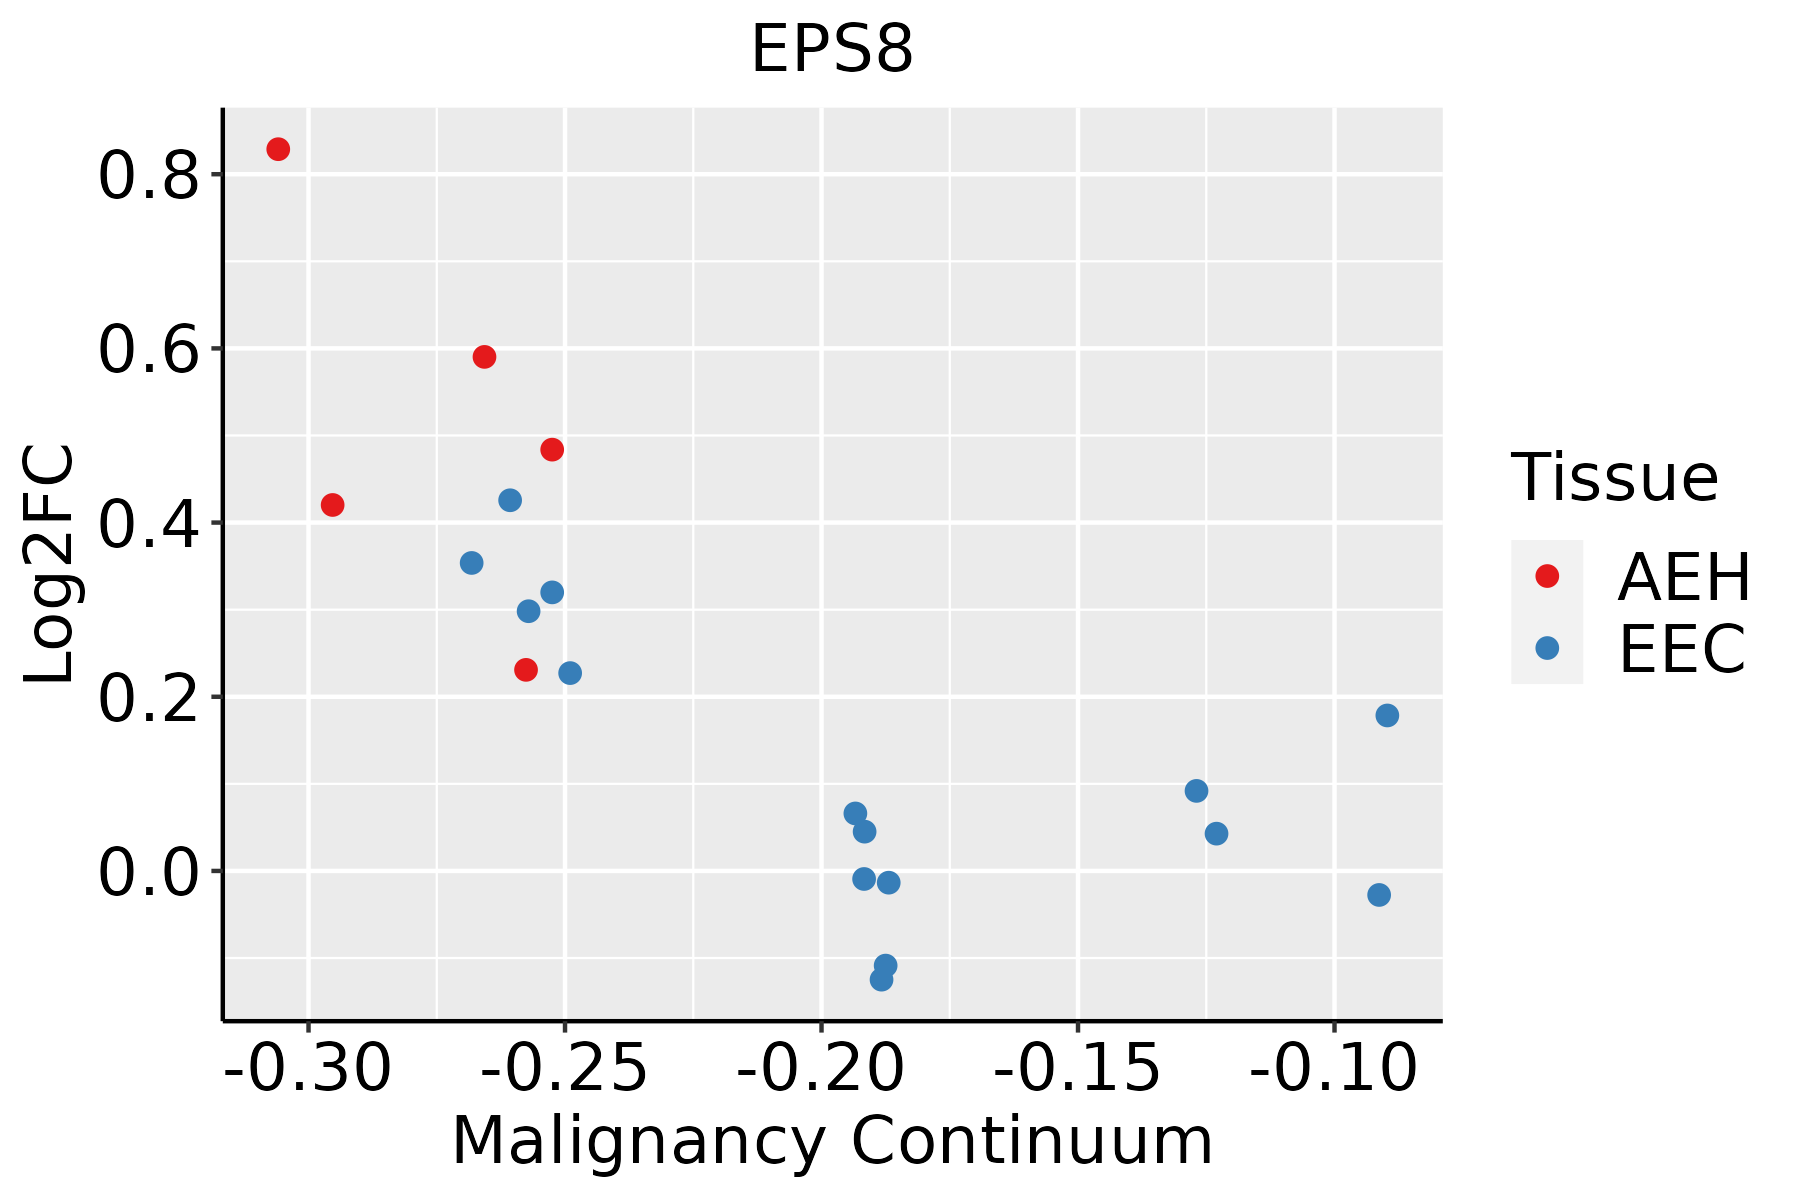 | AEH: Atypical endometrial hyperplasia |
| EEC: Endometrioid Cancer |
| Esophagus | 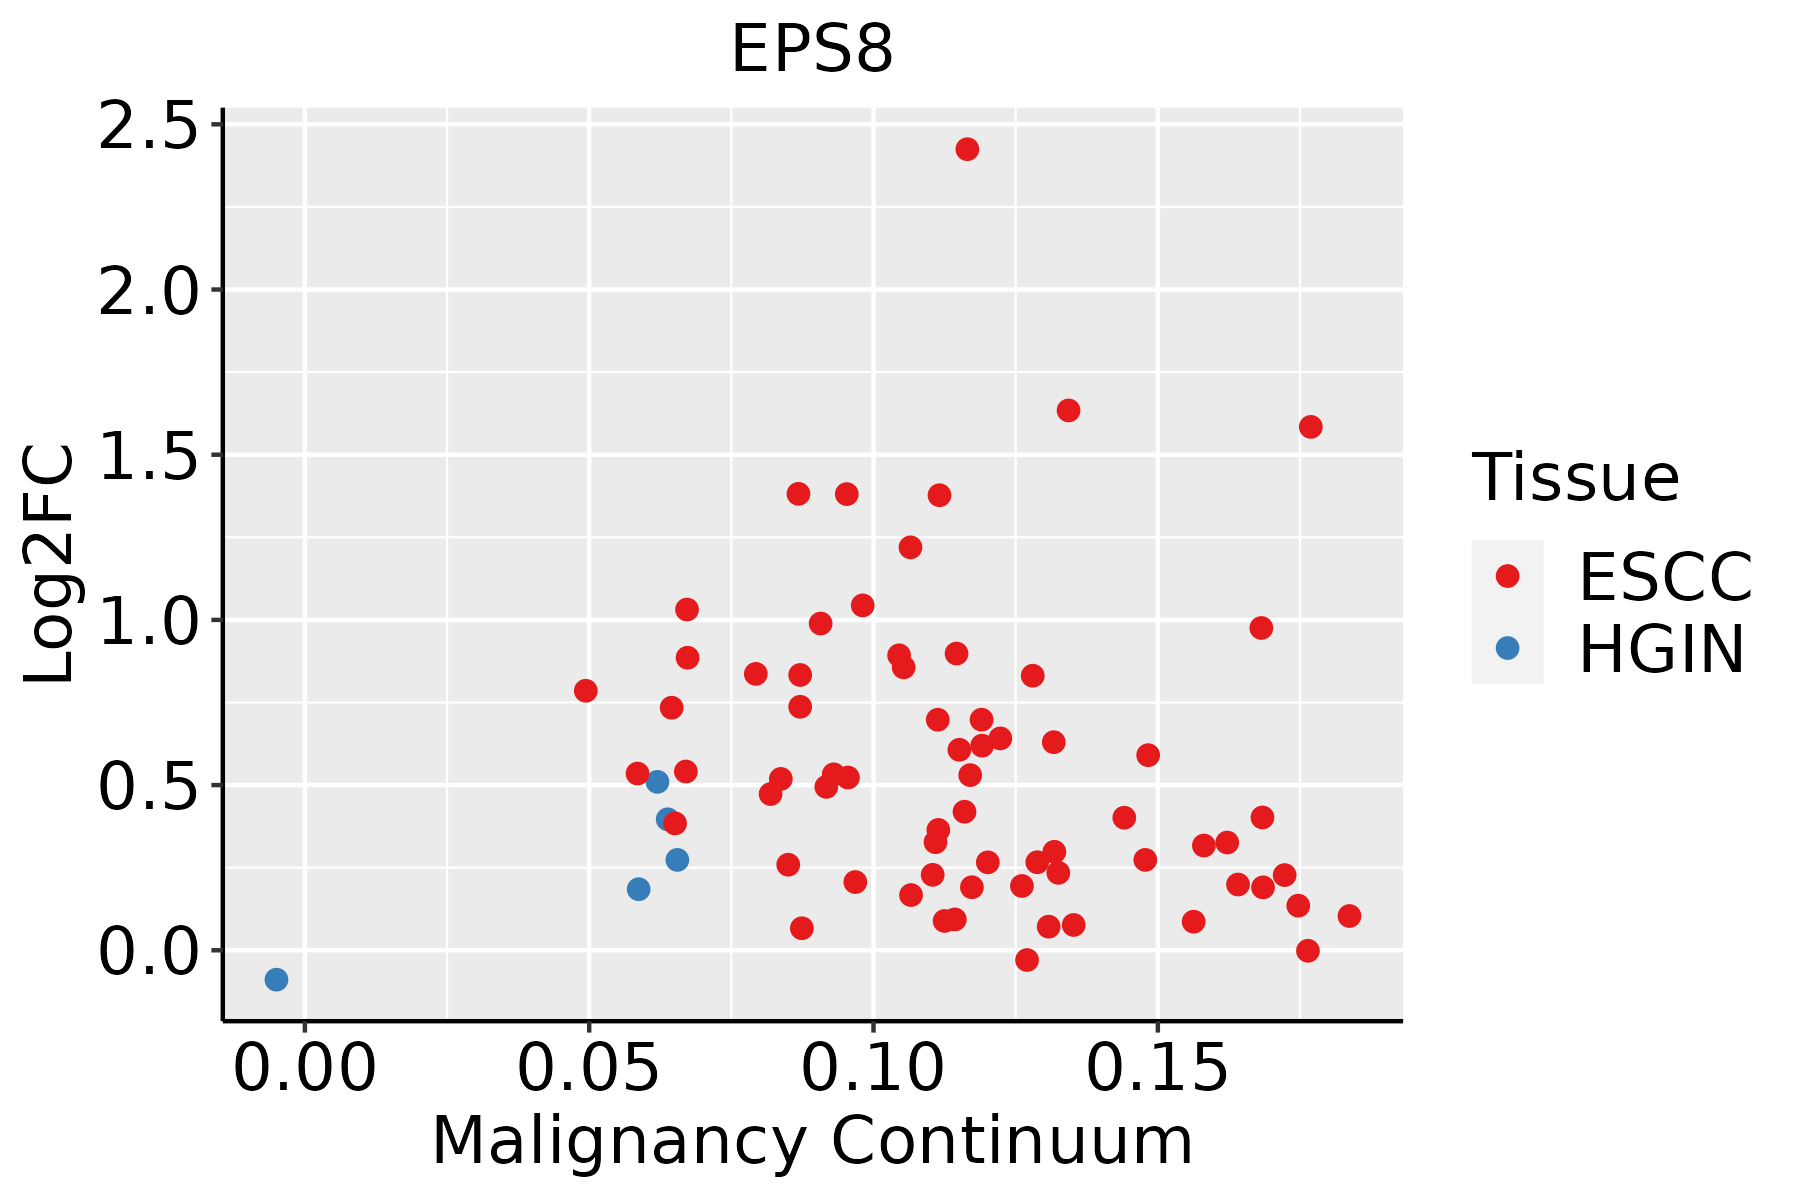 | ESCC: Esophageal squamous cell carcinoma |
| HGIN: High-grade intraepithelial neoplasias |
| LGIN: Low-grade intraepithelial neoplasias |
| GC |  | CAG: Chronic atrophic gastritis |
| CAG with IM: Chronic atrophic gastritis with intestinal metaplasia |
| CSG: Chronic superficial gastritis |
| GC: Gastric cancer |
| SIM: Severe intestinal metaplasia |
| WIM: Wild intestinal metaplasia |
| Liver | 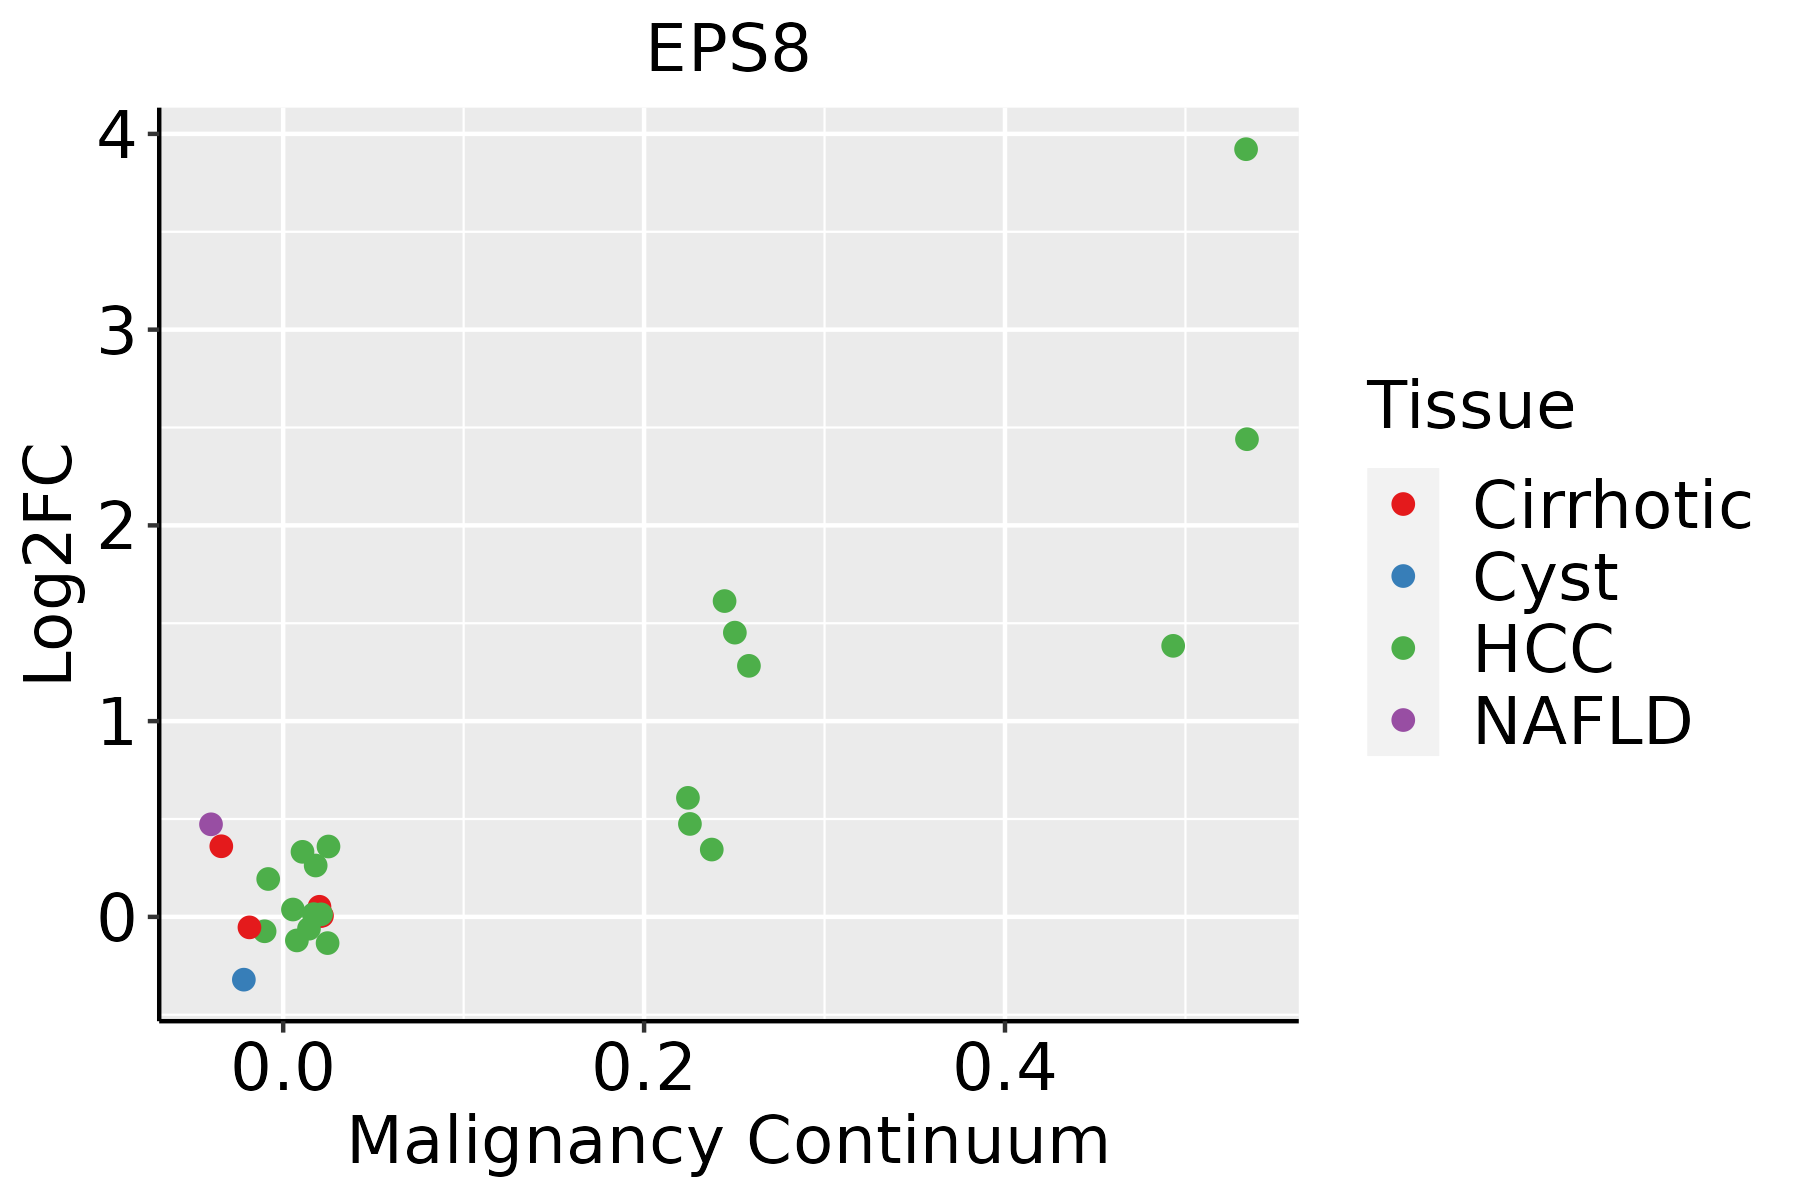 | HCC: Hepatocellular carcinoma |
| NAFLD: Non-alcoholic fatty liver disease |
| Lung | 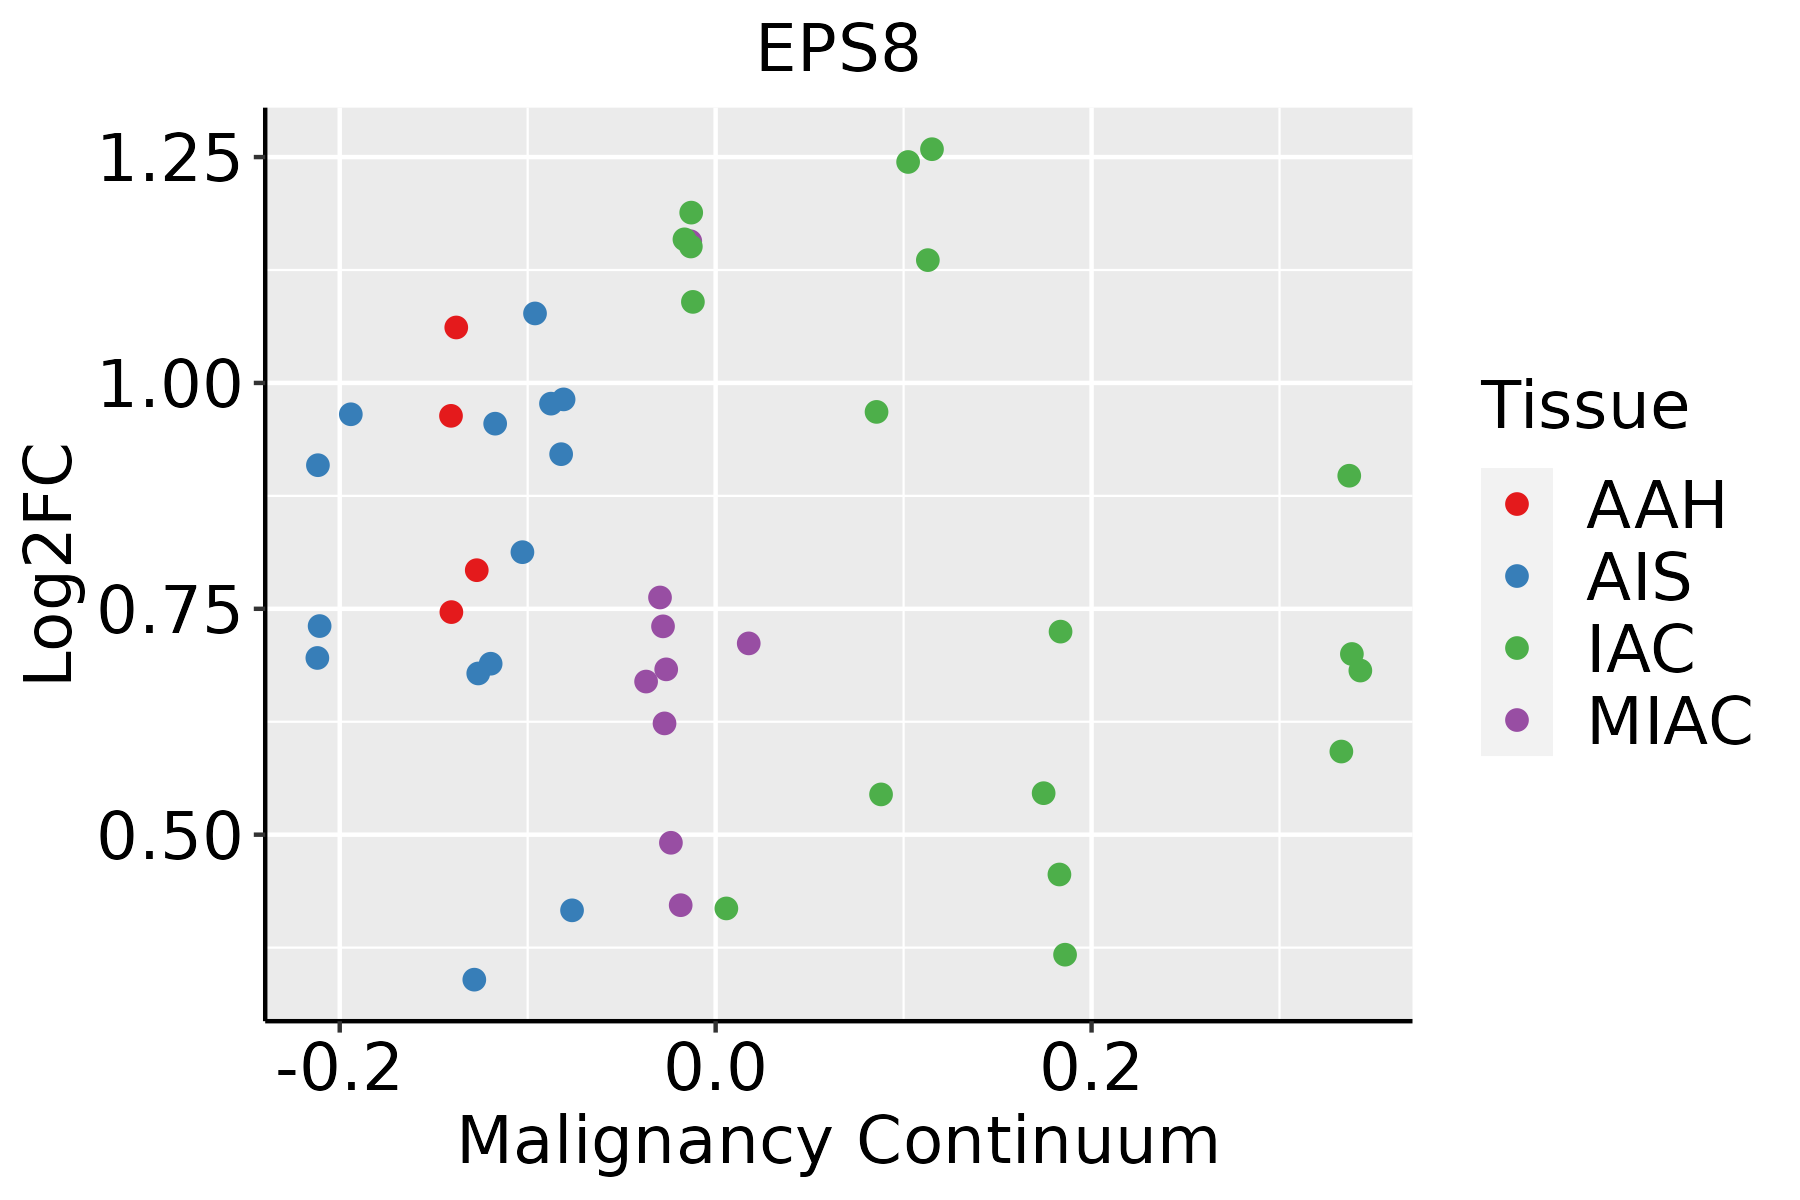 | AAH: Atypical adenomatous hyperplasia |
| AIS: Adenocarcinoma in situ |
| IAC: Invasive lung adenocarcinoma |
| MIA: Minimally invasive adenocarcinoma |
| Oral Cavity |  | EOLP: Erosive Oral lichen planus |
| LP: leukoplakia |
| NEOLP: Non-erosive oral lichen planus |
| OSCC: Oral squamous cell carcinoma |
| Prostate | 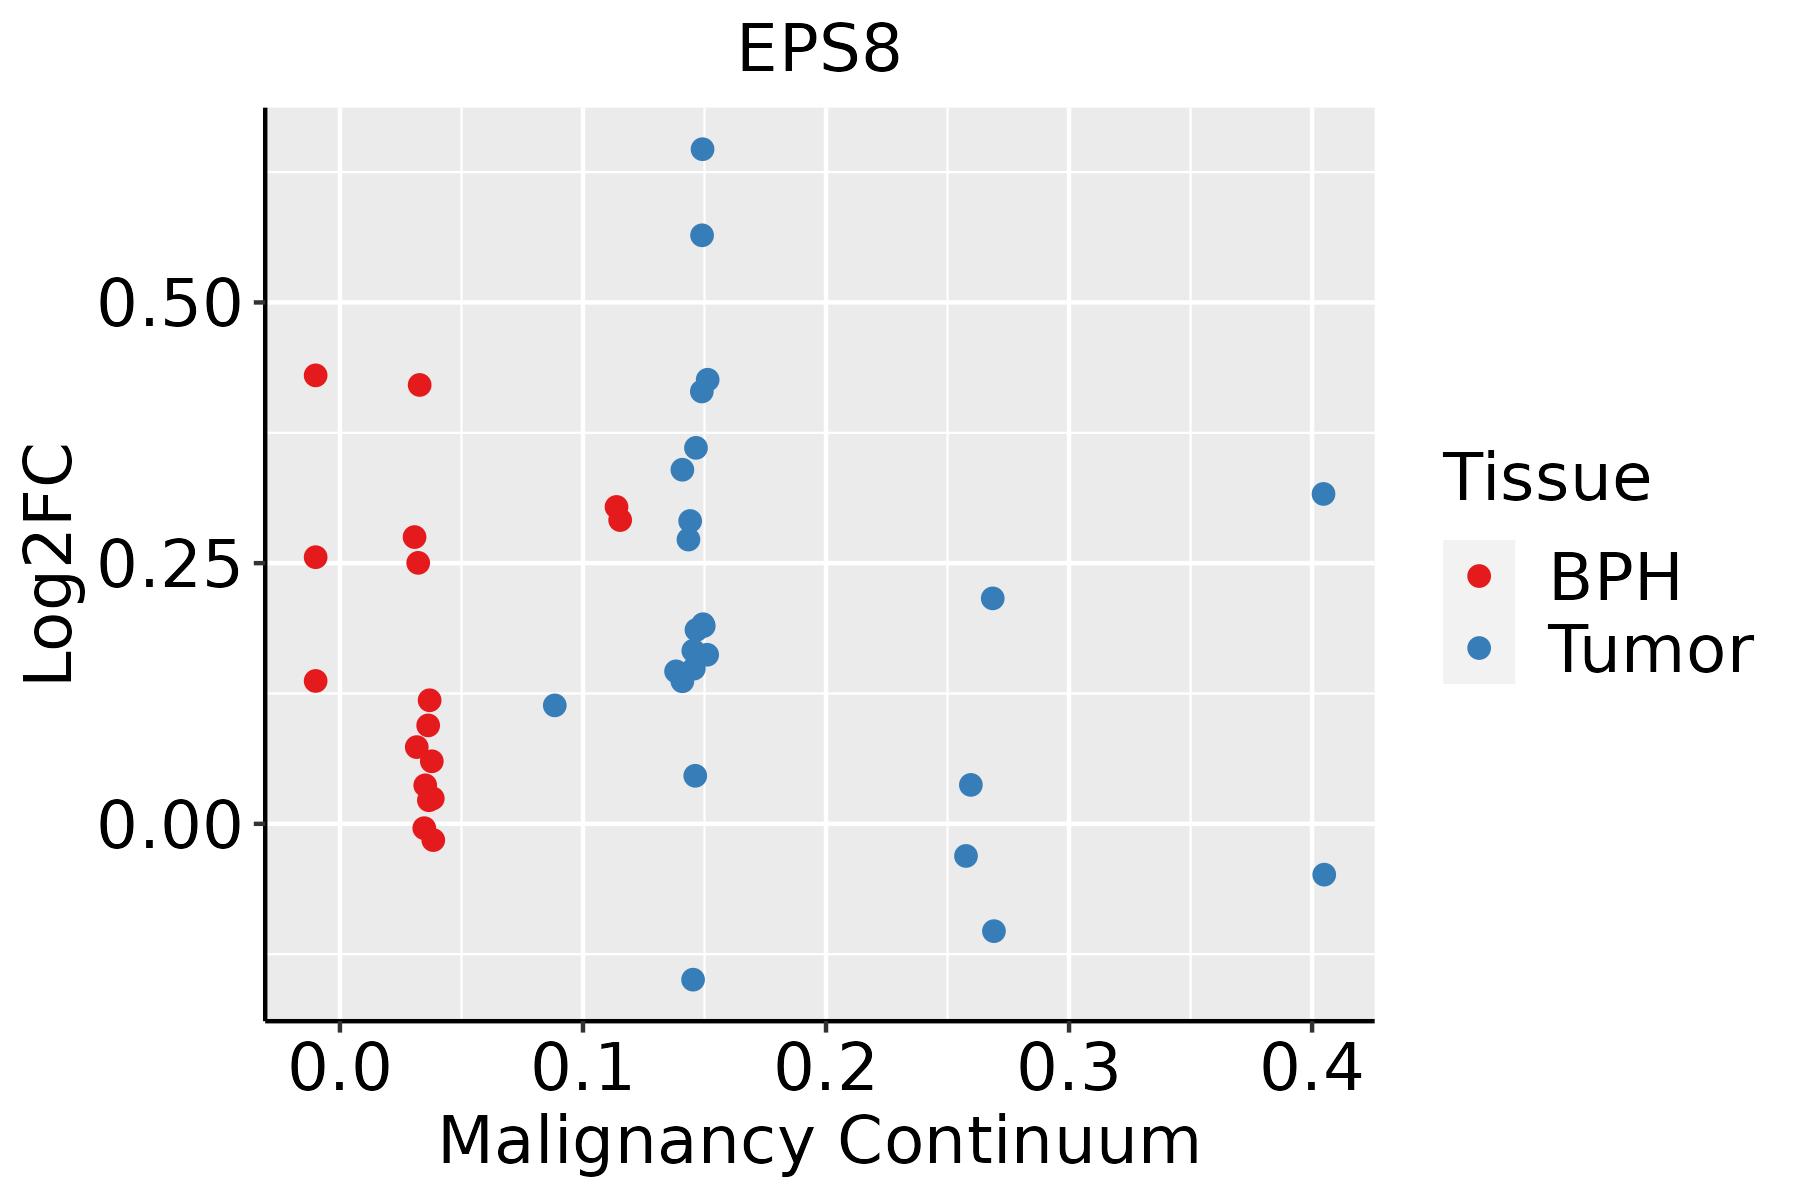 | BPH: Benign Prostatic Hyperplasia |
| Thyroid |  | ATC: Anaplastic thyroid cancer |
| HT: Hashimoto's thyroiditis |
| PTC: Papillary thyroid cancer |
| GO ID | Tissue | Disease Stage | Description | Gene Ratio | Bg Ratio | pvalue | p.adjust | Count |
| GO:009717811 | Lung | AIS | ruffle assembly | 11/1849 | 44/18723 | 3.01e-03 | 2.97e-02 | 11 |
| GO:003083713 | Lung | AIS | negative regulation of actin filament polymerization | 14/1849 | 65/18723 | 3.90e-03 | 3.59e-02 | 14 |
| GO:00300418 | Lung | AIS | actin filament polymerization | 31/1849 | 191/18723 | 3.90e-03 | 3.59e-02 | 31 |
| GO:00308338 | Lung | AIS | regulation of actin filament polymerization | 28/1849 | 172/18723 | 5.64e-03 | 4.76e-02 | 28 |
| GO:00973057 | Lung | AIS | response to alcohol | 38/1849 | 253/18723 | 5.88e-03 | 4.89e-02 | 38 |
| GO:002260423 | Lung | AAH | regulation of cell morphogenesis | 30/613 | 309/18723 | 1.18e-07 | 6.77e-05 | 30 |
| GO:000701523 | Lung | AAH | actin filament organization | 37/613 | 442/18723 | 1.88e-07 | 9.56e-05 | 37 |
| GO:003153222 | Lung | AAH | actin cytoskeleton reorganization | 16/613 | 107/18723 | 3.93e-07 | 1.64e-04 | 16 |
| GO:000836023 | Lung | AAH | regulation of cell shape | 16/613 | 154/18723 | 4.67e-05 | 5.22e-03 | 16 |
| GO:005101723 | Lung | AAH | actin filament bundle assembly | 16/613 | 157/18723 | 5.91e-05 | 5.52e-03 | 16 |
| GO:190290323 | Lung | AAH | regulation of supramolecular fiber organization | 28/613 | 383/18723 | 6.82e-05 | 6.09e-03 | 28 |
| GO:006157223 | Lung | AAH | actin filament bundle organization | 16/613 | 161/18723 | 7.99e-05 | 6.21e-03 | 16 |
| GO:003297023 | Lung | AAH | regulation of actin filament-based process | 27/613 | 397/18723 | 2.96e-04 | 1.45e-02 | 27 |
| GO:003295623 | Lung | AAH | regulation of actin cytoskeleton organization | 25/613 | 358/18723 | 3.31e-04 | 1.55e-02 | 25 |
| GO:190290422 | Lung | AAH | negative regulation of supramolecular fiber organization | 15/613 | 167/18723 | 4.01e-04 | 1.78e-02 | 15 |
| GO:009730513 | Lung | AAH | response to alcohol | 19/613 | 253/18723 | 7.02e-04 | 2.55e-02 | 19 |
| GO:011005323 | Lung | AAH | regulation of actin filament organization | 20/613 | 278/18723 | 8.79e-04 | 2.88e-02 | 20 |
| GO:005149422 | Lung | AAH | negative regulation of cytoskeleton organization | 14/613 | 163/18723 | 9.62e-04 | 2.94e-02 | 14 |
| GO:003083313 | Lung | AAH | regulation of actin filament polymerization | 14/613 | 172/18723 | 1.61e-03 | 3.96e-02 | 14 |
| GO:003227123 | Lung | AAH | regulation of protein polymerization | 17/613 | 233/18723 | 1.79e-03 | 4.22e-02 | 17 |
| Hugo Symbol | Variant Class | Variant Classification | dbSNP RS | HGVSc | HGVSp | HGVSp Short | SWISSPROT | BIOTYPE | SIFT | PolyPhen | Tumor Sample Barcode | Tissue | Histology | Sex | Age | Stage | Therapy Types | Drugs | Outcome |
| EPS8 | SNV | Missense_Mutation | | c.982N>C | p.Phe328Leu | p.F328L | Q12929 | protein_coding | tolerated(0.05) | possibly_damaging(0.533) | TCGA-A8-A09Z-01 | Breast | breast invasive carcinoma | Female | >=65 | I/II | Unknown | Unknown | SD |
| EPS8 | SNV | Missense_Mutation | | c.1785G>T | p.Leu595Phe | p.L595F | Q12929 | protein_coding | tolerated(0.32) | benign(0.003) | TCGA-AO-A0JC-01 | Breast | breast invasive carcinoma | Female | <65 | I/II | Chemotherapy | fluorouracil | SD |
| EPS8 | SNV | Missense_Mutation | | c.1508A>G | p.His503Arg | p.H503R | Q12929 | protein_coding | tolerated(0.35) | benign(0) | TCGA-AQ-A04H-01 | Breast | breast invasive carcinoma | Female | <65 | III/IV | Chemotherapy | taxotere | SD |
| EPS8 | SNV | Missense_Mutation | | c.220N>T | p.Val74Phe | p.V74F | Q12929 | protein_coding | deleterious(0) | possibly_damaging(0.57) | TCGA-B6-A0RP-01 | Breast | breast invasive carcinoma | Female | >=65 | I/II | Unknown | Unknown | PD |
| EPS8 | SNV | Missense_Mutation | rs776013800 | c.287C>G | p.Ala96Gly | p.A96G | Q12929 | protein_coding | deleterious(0.01) | possibly_damaging(0.574) | TCGA-C8-A26Y-01 | Breast | breast invasive carcinoma | Female | >=65 | I/II | Unknown | Unknown | SD |
| EPS8 | SNV | Missense_Mutation | rs369986759 | c.794N>A | p.Arg265His | p.R265H | Q12929 | protein_coding | deleterious(0) | benign(0.097) | TCGA-D8-A1J8-01 | Breast | breast invasive carcinoma | Female | >=65 | I/II | Hormone Therapy | nolvadex | SD |
| EPS8 | SNV | Missense_Mutation | | c.1313A>T | p.Glu438Val | p.E438V | Q12929 | protein_coding | deleterious(0) | possibly_damaging(0.459) | TCGA-E9-A22G-01 | Breast | breast invasive carcinoma | Female | <65 | I/II | Chemotherapy | doxorubicin | SD |
| EPS8 | insertion | Frame_Shift_Ins | novel | c.2371_2372insTTGCTGTTTTAGGTAGTATGGCCATTTTCAC | p.Ser791PhefsTer29 | p.S791Ffs*29 | Q12929 | protein_coding | | | TCGA-A2-A0EY-01 | Breast | breast invasive carcinoma | Female | <65 | I/II | Chemotherapy | adriamycin | SD |
| EPS8 | SNV | Missense_Mutation | rs147224631 | c.1300N>T | p.Arg434Cys | p.R434C | Q12929 | protein_coding | deleterious(0) | benign(0.125) | TCGA-EA-A410-01 | Cervix | cervical & endocervical cancer | Female | <65 | I/II | Unknown | Unknown | SD |
| EPS8 | SNV | Missense_Mutation | | c.1499N>C | p.Arg500Thr | p.R500T | Q12929 | protein_coding | tolerated(0.08) | benign(0.024) | TCGA-EK-A2RJ-01 | Cervix | cervical & endocervical cancer | Female | <65 | I/II | Unknown | Unknown | SD |


