
|
|||||
|
 | |
| |
| |
| |
| |
| |
|
Gene: CHMP4B |
Gene summary for CHMP4B |
| Gene information | Species | Human | Gene symbol | CHMP4B | Gene ID | 128866 |
| Gene name | charged multivesicular body protein 4B | |
| Gene Alias | C20orf178 | |
| Cytomap | 20q11.22 | |
| Gene Type | protein-coding | GO ID | GO:0000045 | UniProtAcc | Q9H444 |
Top |
Malignant transformation analysis |
| Identification of the aberrant gene expression in precancerous and cancerous lesions by comparing the gene expression of stem-like cells in diseased tissues with normal stem cells |
| Entrez ID | Symbol | Replicates | Species | Organ | Tissue | Adj P-value | Log2FC | Malignancy |
| 128866 | CHMP4B | HTA11_2487_2000001011 | Human | Colorectum | SER | 8.95e-11 | 6.88e-01 | -0.1808 |
| 128866 | CHMP4B | HTA11_1938_2000001011 | Human | Colorectum | AD | 1.56e-16 | 8.06e-01 | -0.0811 |
| 128866 | CHMP4B | HTA11_78_2000001011 | Human | Colorectum | AD | 4.62e-03 | 3.58e-01 | -0.1088 |
| 128866 | CHMP4B | HTA11_347_2000001011 | Human | Colorectum | AD | 3.59e-24 | 7.42e-01 | -0.1954 |
| 128866 | CHMP4B | HTA11_411_2000001011 | Human | Colorectum | SER | 6.15e-06 | 1.01e+00 | -0.2602 |
| 128866 | CHMP4B | HTA11_2112_2000001011 | Human | Colorectum | SER | 4.13e-09 | 1.10e+00 | -0.2196 |
| 128866 | CHMP4B | HTA11_3361_2000001011 | Human | Colorectum | AD | 1.27e-11 | 7.05e-01 | -0.1207 |
| 128866 | CHMP4B | HTA11_83_2000001011 | Human | Colorectum | SER | 5.50e-07 | 6.11e-01 | -0.1526 |
| 128866 | CHMP4B | HTA11_696_2000001011 | Human | Colorectum | AD | 2.42e-19 | 7.06e-01 | -0.1464 |
| 128866 | CHMP4B | HTA11_866_2000001011 | Human | Colorectum | AD | 5.60e-04 | 3.80e-01 | -0.1001 |
| 128866 | CHMP4B | HTA11_1391_2000001011 | Human | Colorectum | AD | 3.04e-19 | 7.60e-01 | -0.059 |
| 128866 | CHMP4B | HTA11_2992_2000001011 | Human | Colorectum | SER | 3.56e-08 | 8.82e-01 | -0.1706 |
| 128866 | CHMP4B | HTA11_5212_2000001011 | Human | Colorectum | AD | 1.49e-13 | 1.18e+00 | -0.2061 |
| 128866 | CHMP4B | HTA11_546_2000001011 | Human | Colorectum | AD | 4.89e-04 | 4.43e-01 | -0.0842 |
| 128866 | CHMP4B | HTA11_7862_2000001011 | Human | Colorectum | AD | 5.18e-05 | 4.98e-01 | -0.0179 |
| 128866 | CHMP4B | HTA11_866_3004761011 | Human | Colorectum | AD | 3.04e-21 | 7.88e-01 | 0.096 |
| 128866 | CHMP4B | HTA11_8622_2000001021 | Human | Colorectum | SER | 8.16e-03 | 4.47e-01 | 0.0528 |
| 128866 | CHMP4B | HTA11_7663_2000001011 | Human | Colorectum | SER | 4.98e-06 | 8.20e-01 | 0.0131 |
| 128866 | CHMP4B | HTA11_10623_2000001011 | Human | Colorectum | AD | 2.57e-03 | 4.66e-01 | -0.0177 |
| 128866 | CHMP4B | HTA11_7696_3000711011 | Human | Colorectum | AD | 1.69e-03 | 3.71e-01 | 0.0674 |
| Page: 1 2 3 4 5 6 7 8 9 10 11 12 13 |
| Tissue | Expression Dynamics | Abbreviation |
| Colorectum (GSE201348) |  | FAP: Familial adenomatous polyposis |
| CRC: Colorectal cancer | ||
| Colorectum (HTA11) |  | AD: Adenomas |
| SER: Sessile serrated lesions | ||
| MSI-H: Microsatellite-high colorectal cancer | ||
| MSS: Microsatellite stable colorectal cancer | ||
| Endometrium | 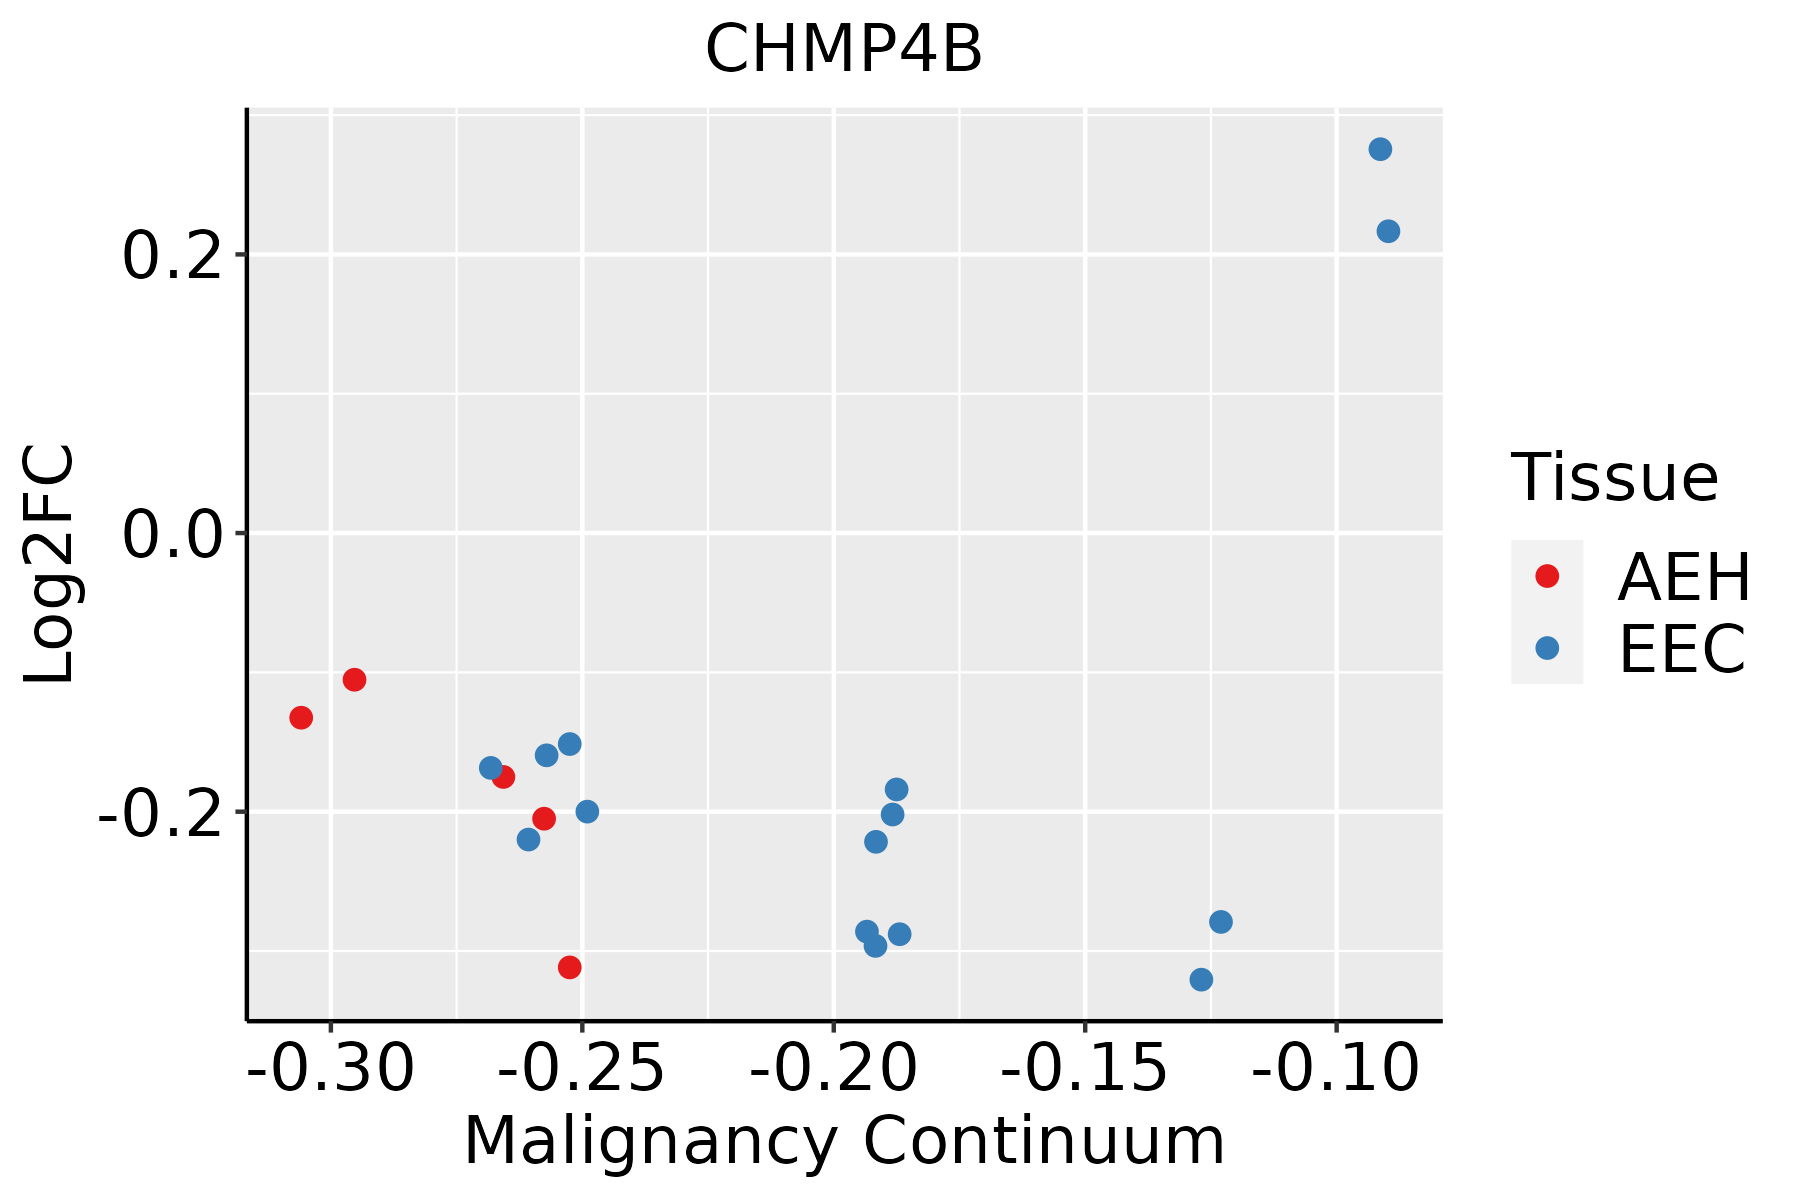 | AEH: Atypical endometrial hyperplasia |
| EEC: Endometrioid Cancer | ||
| Esophagus | 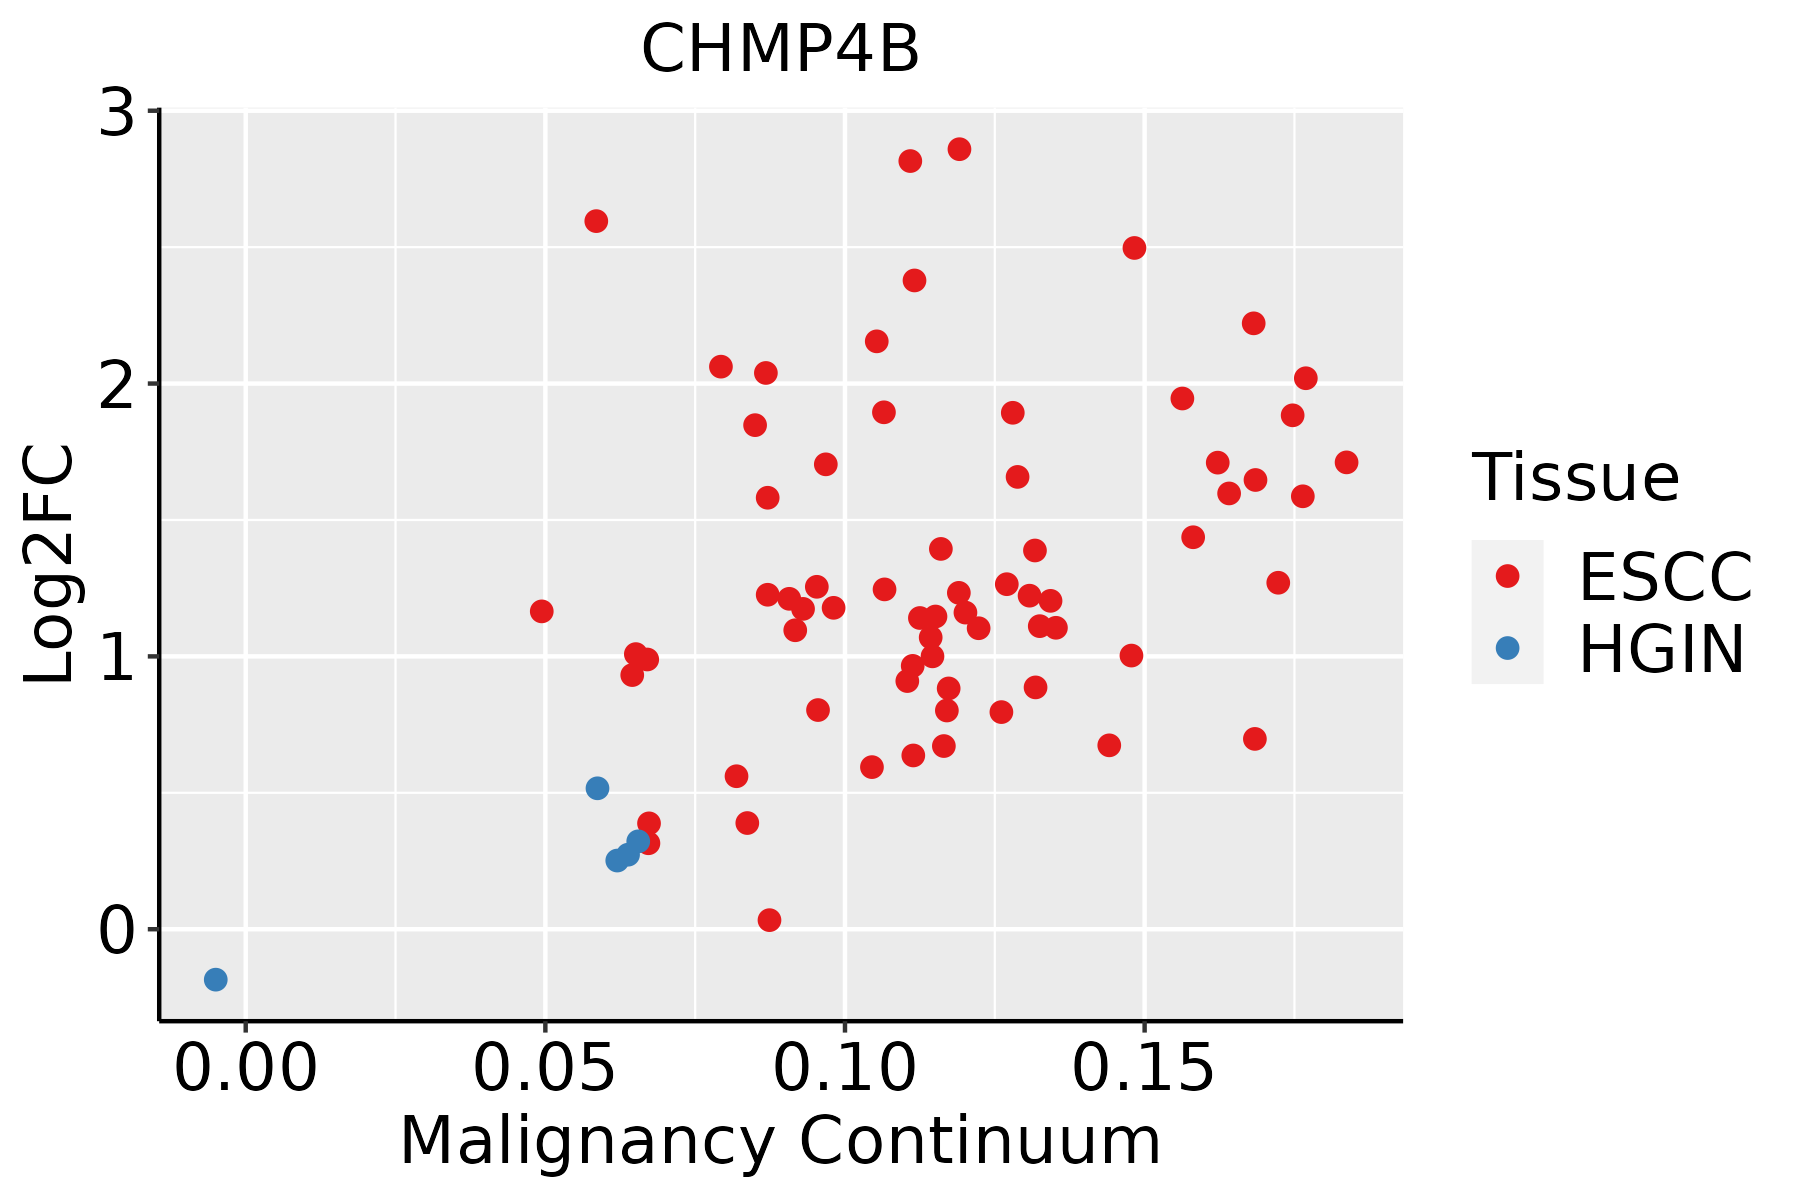 | ESCC: Esophageal squamous cell carcinoma |
| HGIN: High-grade intraepithelial neoplasias | ||
| LGIN: Low-grade intraepithelial neoplasias | ||
| GC | 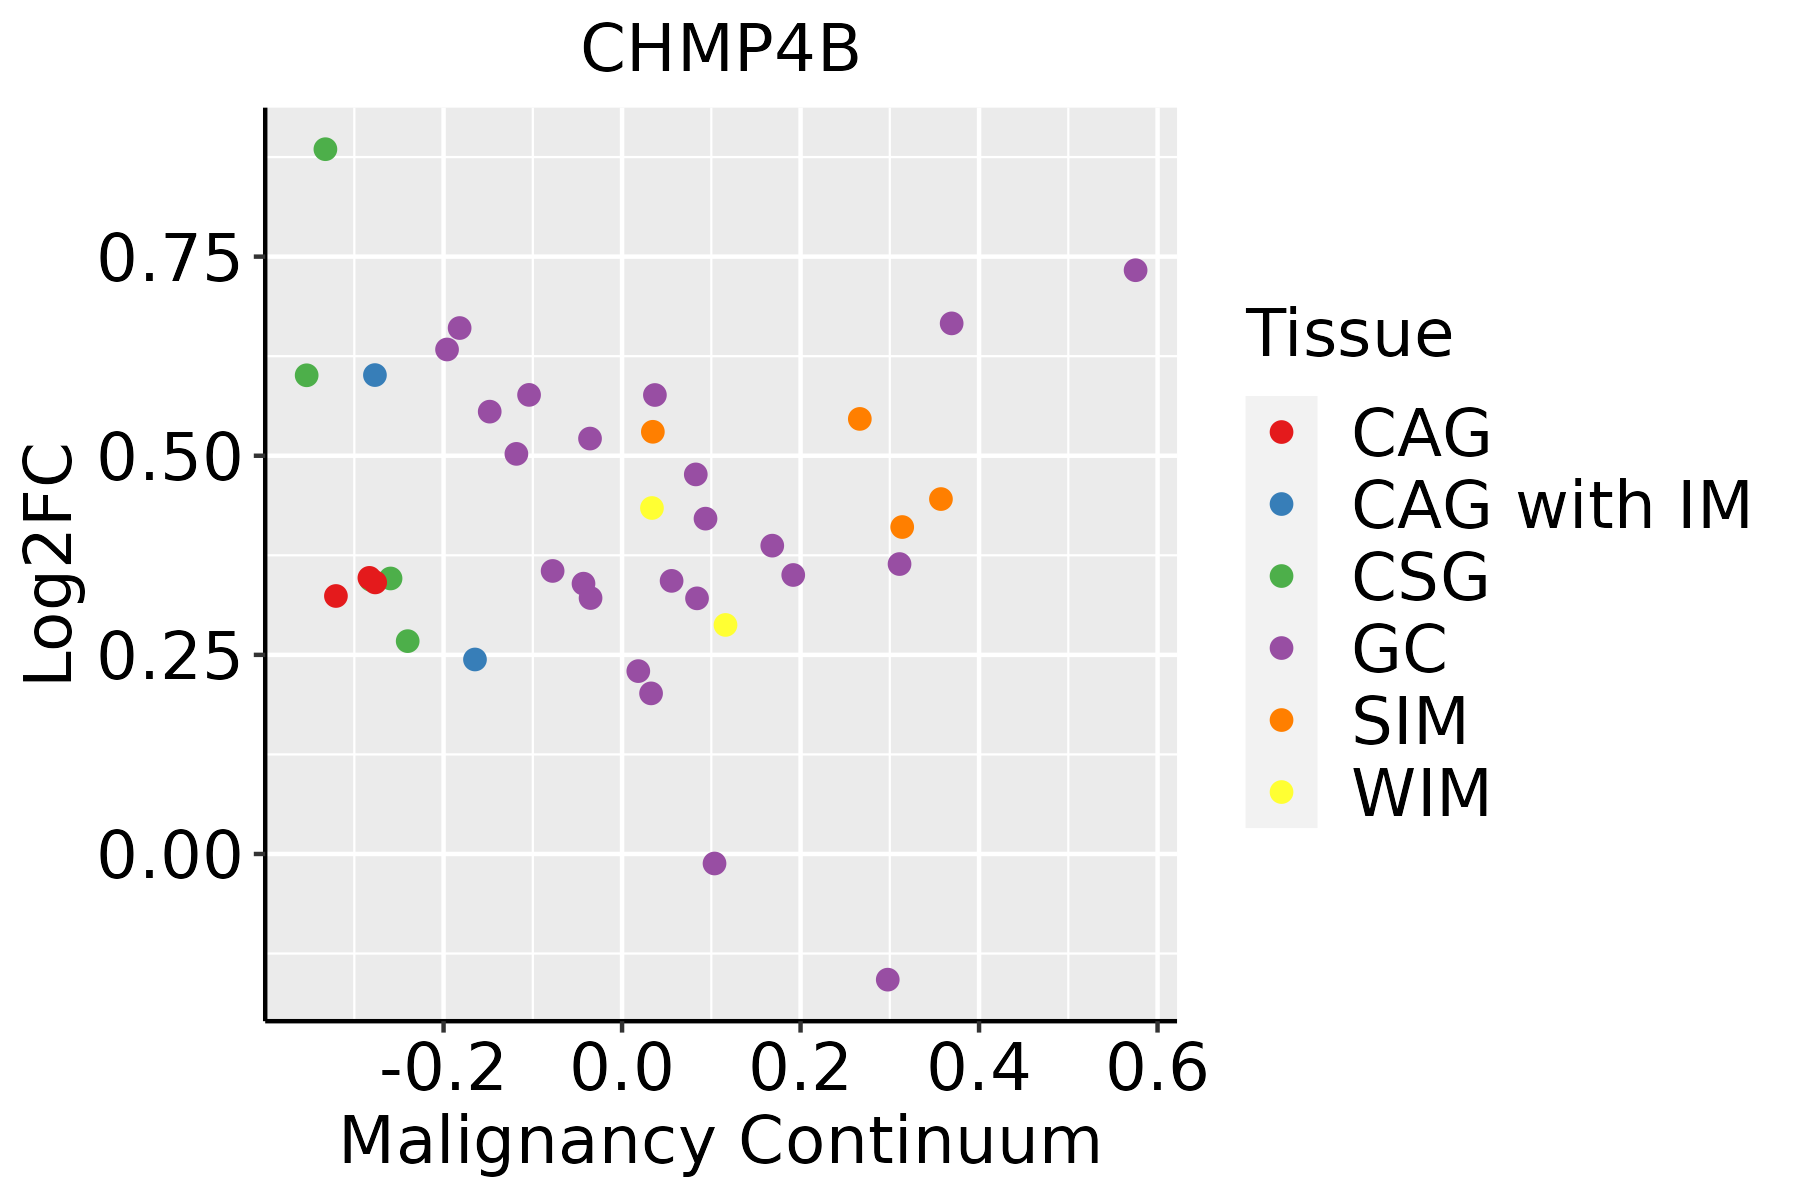 | CAG: Chronic atrophic gastritis |
| CAG with IM: Chronic atrophic gastritis with intestinal metaplasia | ||
| CSG: Chronic superficial gastritis | ||
| GC: Gastric cancer | ||
| SIM: Severe intestinal metaplasia | ||
| WIM: Wild intestinal metaplasia | ||
| Liver | 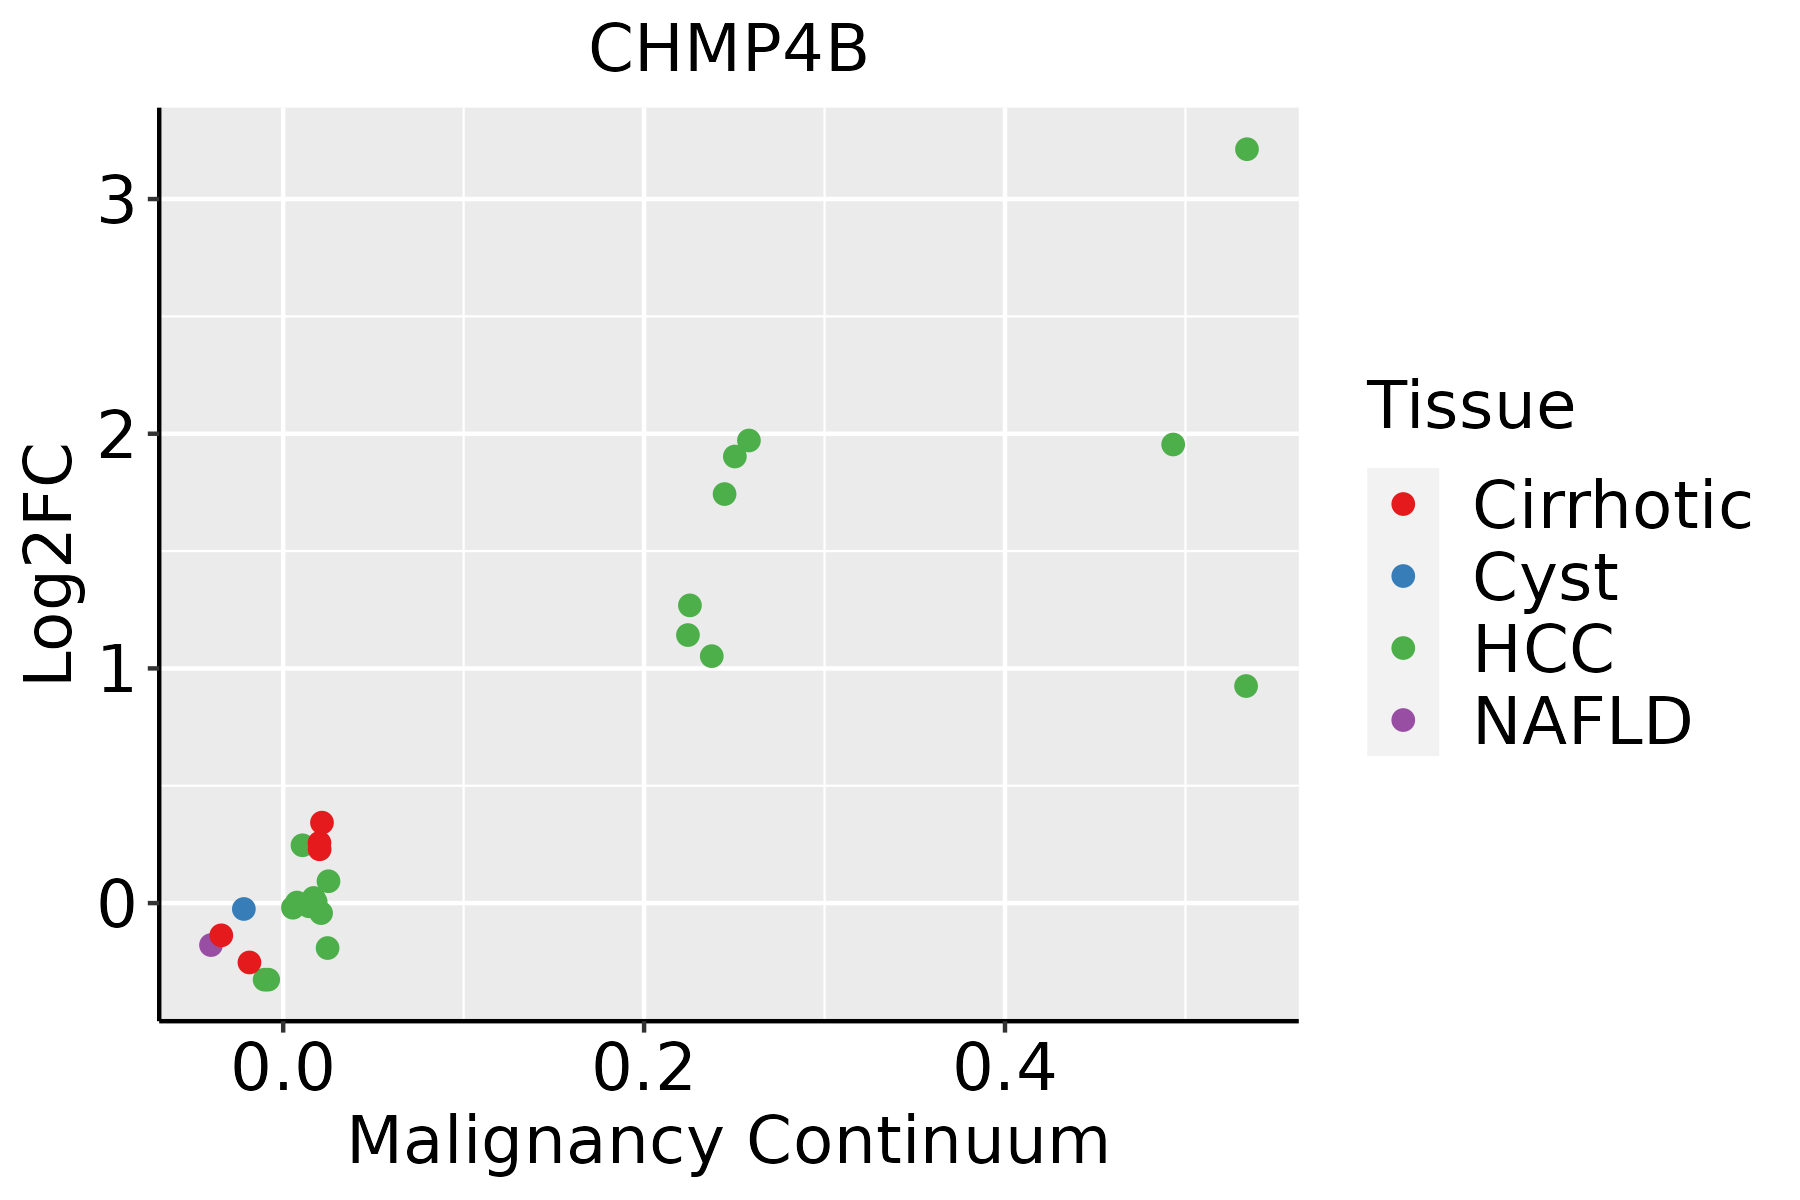 | HCC: Hepatocellular carcinoma |
| NAFLD: Non-alcoholic fatty liver disease | ||
| Oral Cavity | 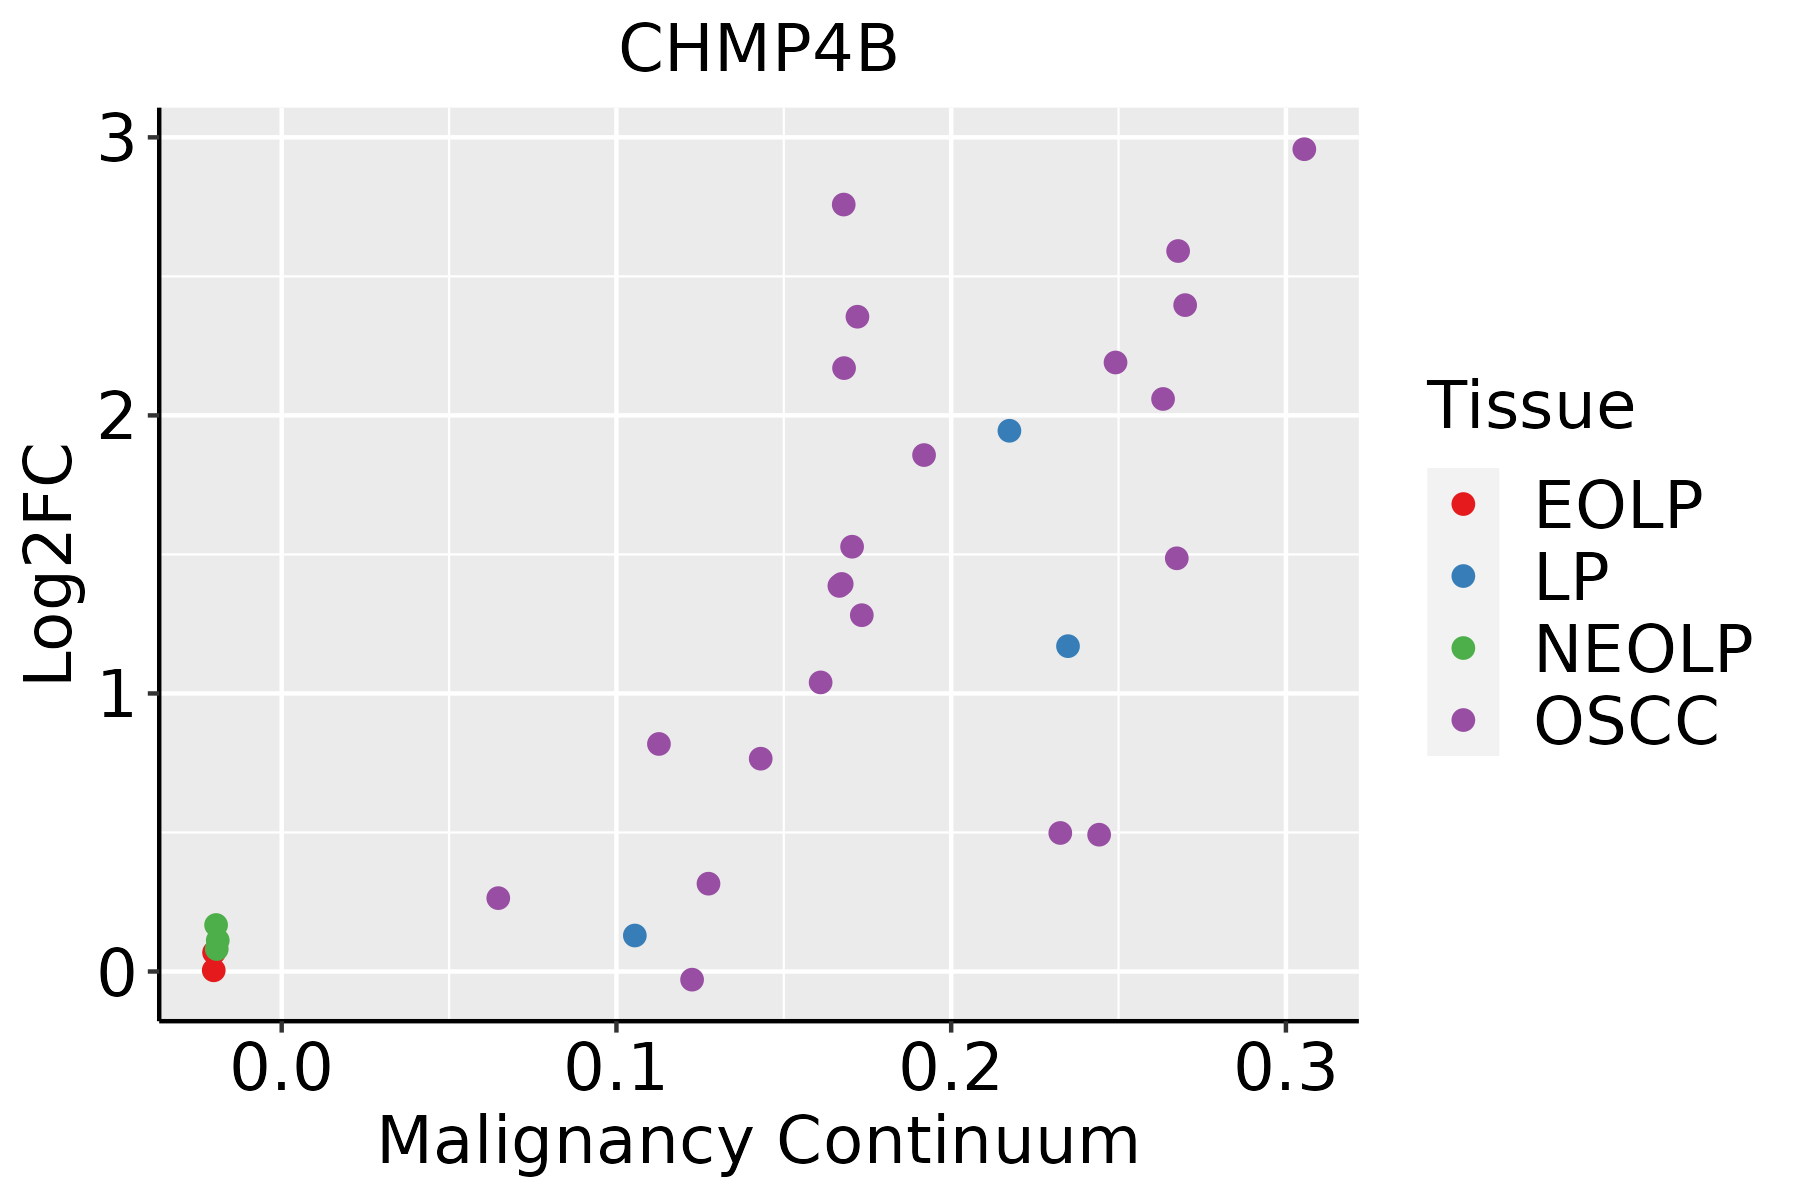 | EOLP: Erosive Oral lichen planus |
| LP: leukoplakia | ||
| NEOLP: Non-erosive oral lichen planus | ||
| OSCC: Oral squamous cell carcinoma | ||
| Prostate | 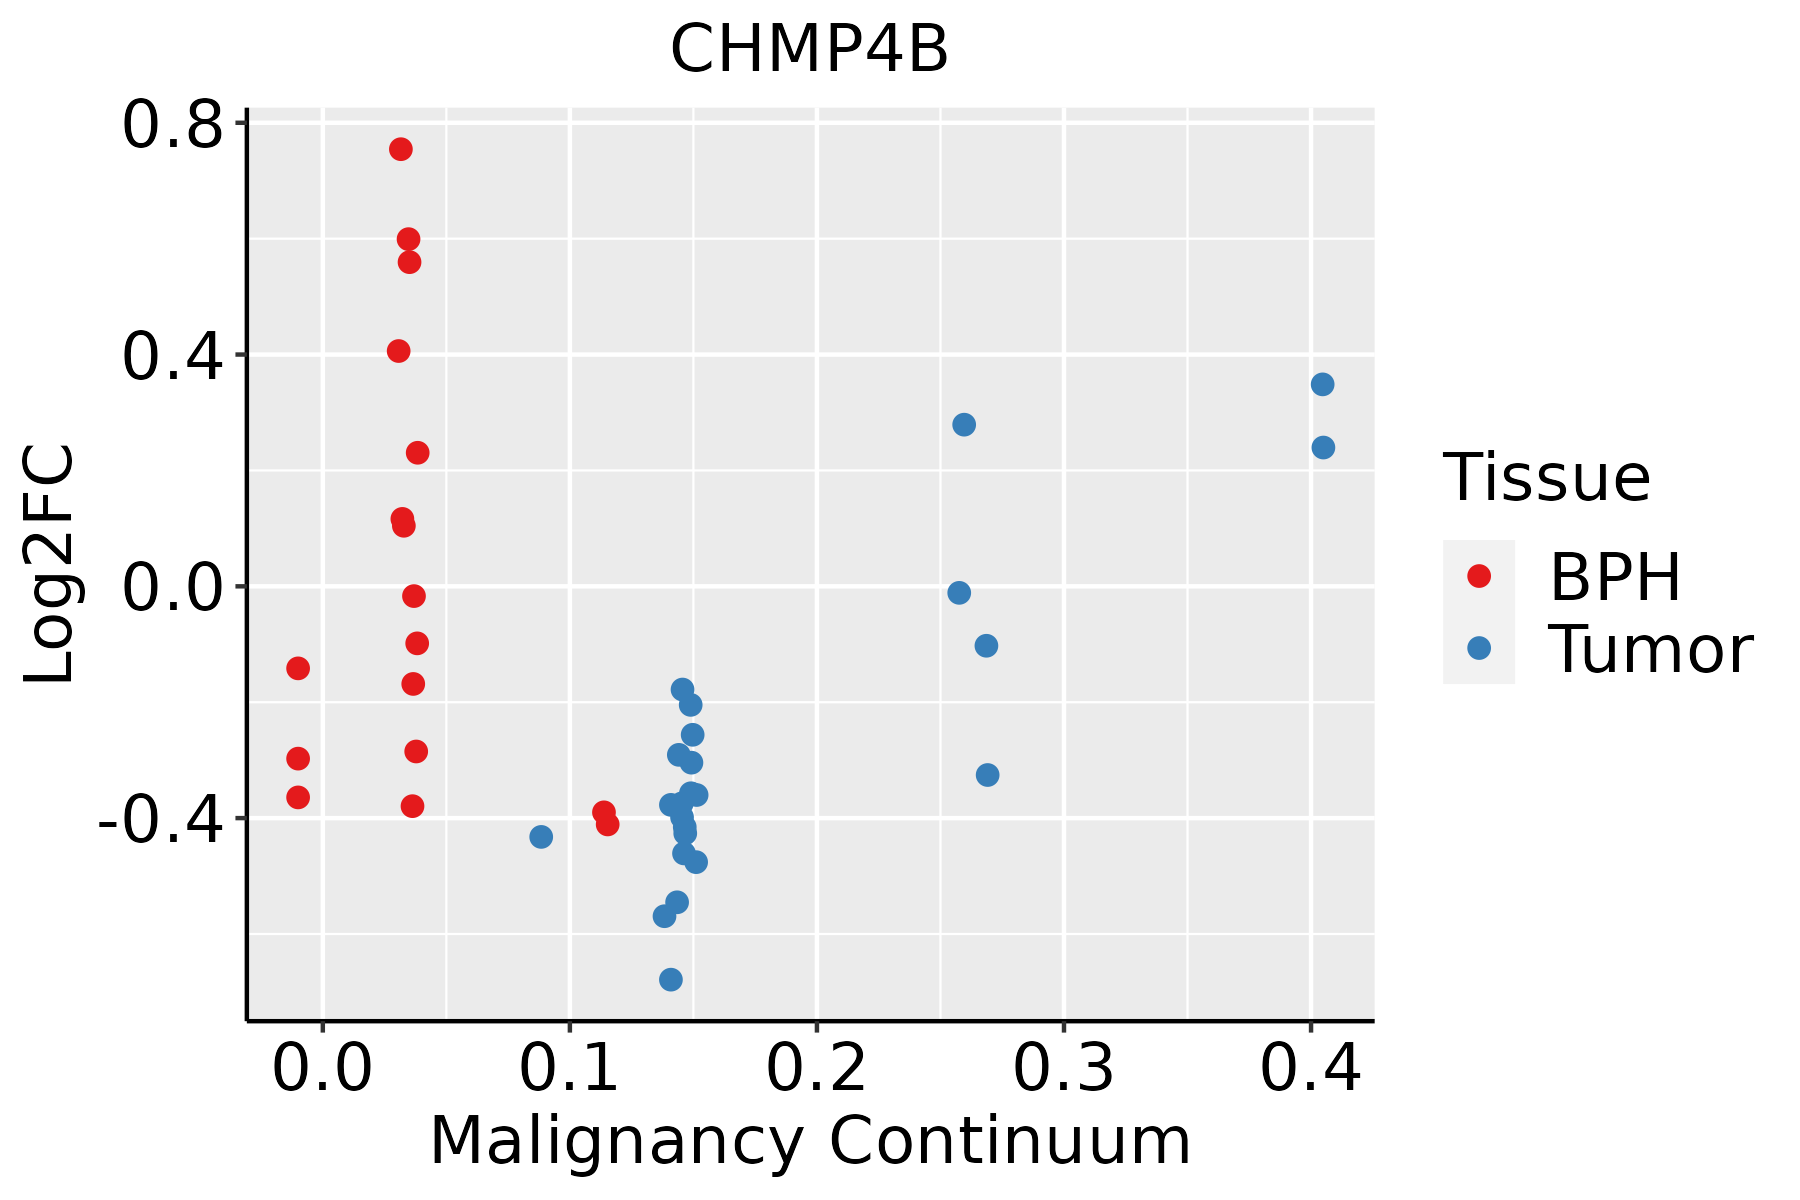 | BPH: Benign Prostatic Hyperplasia |
| Skin | 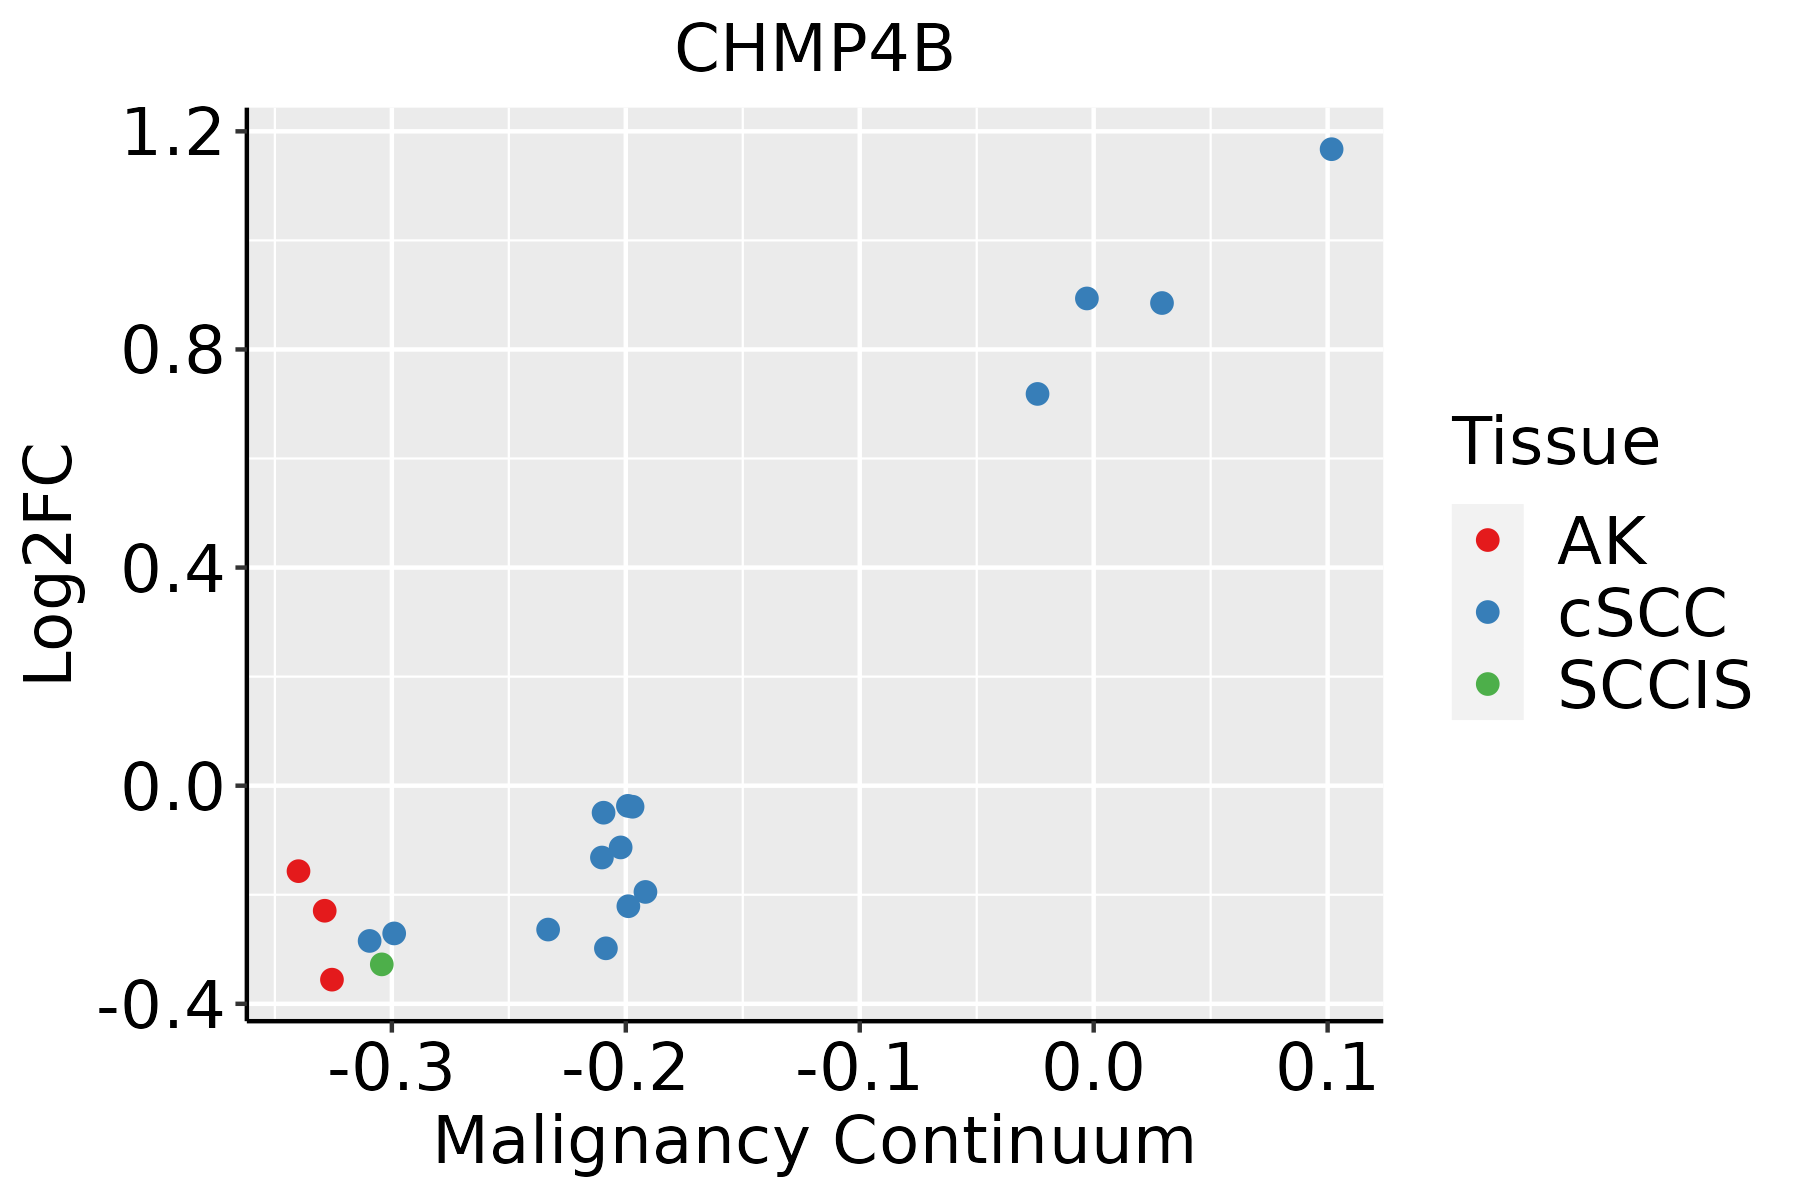 | AK: Actinic keratosis |
| cSCC: Cutaneous squamous cell carcinoma | ||
| SCCIS:squamous cell carcinoma in situ | ||
| Thyroid | 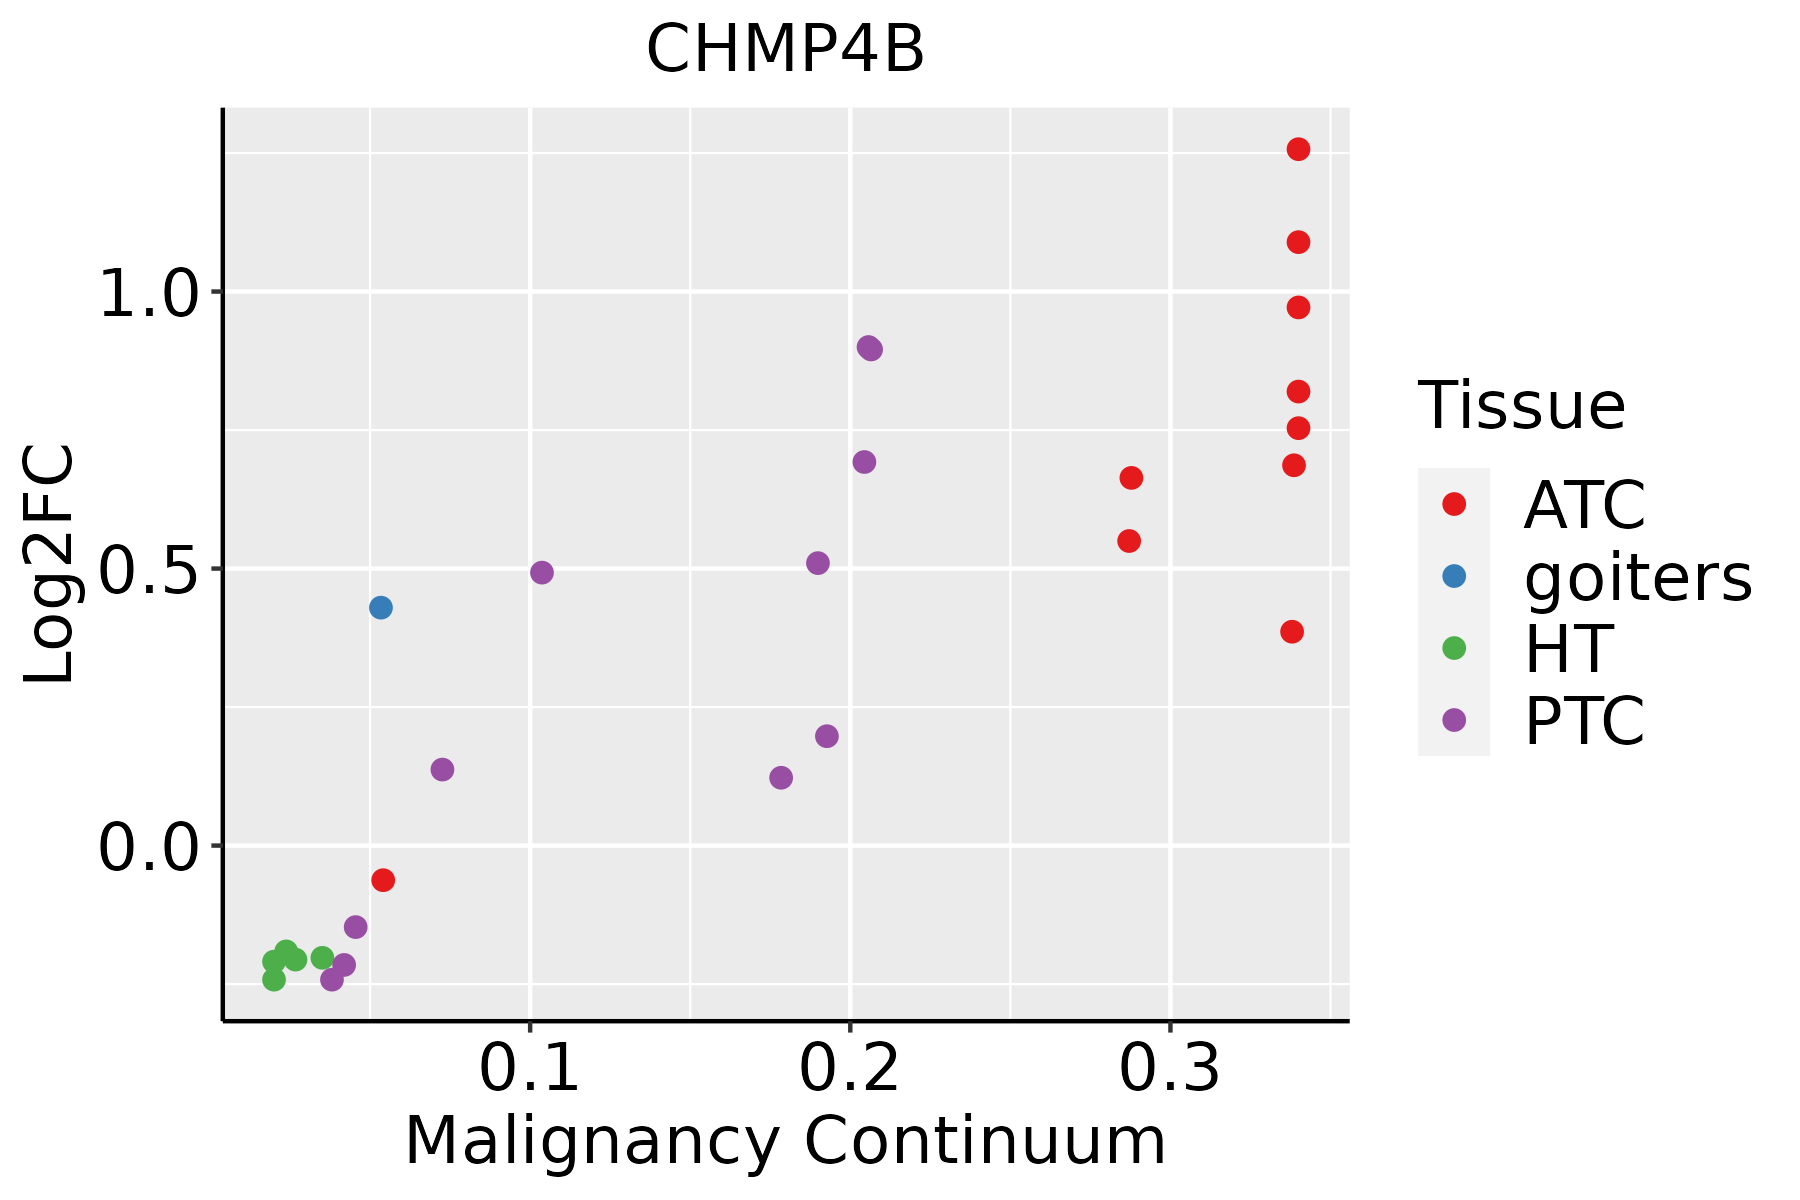 | ATC: Anaplastic thyroid cancer |
| HT: Hashimoto's thyroiditis | ||
| PTC: Papillary thyroid cancer |
| ∗log2FC in expression of this searched gene in stem-like cells from each diseased tissue sample relative to stem-like cells in normal samples in each tissue plotted against the malignancy continuum. Samples are colored based on if they are from different disease stage. |
Top |
Malignant transformation related pathway analysis |
| Find out the enriched GO biological processes and KEGG pathways involved in transition from healthy to precancer to cancer |
| Tissue | Disease Stage | Enriched GO biological Processes |
| Colorectum | AD |  |
| Colorectum | SER |  |
| Colorectum | MSS |  |
| Colorectum | MSI-H |  |
| Colorectum | FAP |  |
| ∗Top 15 enriched GO BP terms are showed in the bar plot of each disease state in each tissue. Each row represents a significant GO biological process which is colored according to the -log10(p.adjust). |
| Page: 1 2 3 4 5 6 7 8 9 |
| GO ID | Tissue | Disease Stage | Description | Gene Ratio | Bg Ratio | pvalue | p.adjust | Count |
| GO:014001411 | Liver | HCC | mitotic nuclear division | 174/7958 | 287/18723 | 3.74e-10 | 1.23e-08 | 174 |
| GO:005165621 | Liver | HCC | establishment of organelle localization | 226/7958 | 390/18723 | 4.15e-10 | 1.34e-08 | 226 |
| GO:001624111 | Liver | HCC | regulation of macroautophagy | 96/7958 | 141/18723 | 6.82e-10 | 2.14e-08 | 96 |
| GO:001063912 | Liver | HCC | negative regulation of organelle organization | 204/7958 | 348/18723 | 7.67e-10 | 2.37e-08 | 204 |
| GO:0000070 | Liver | HCC | mitotic sister chromatid segregation | 110/7958 | 168/18723 | 1.42e-09 | 4.25e-08 | 110 |
| GO:00008191 | Liver | HCC | sister chromatid segregation | 128/7958 | 202/18723 | 1.59e-09 | 4.73e-08 | 128 |
| GO:00447722 | Liver | HCC | mitotic cell cycle phase transition | 240/7958 | 424/18723 | 2.47e-09 | 6.84e-08 | 240 |
| GO:005170122 | Liver | HCC | biological process involved in interaction with host | 128/7958 | 203/18723 | 2.51e-09 | 6.91e-08 | 128 |
| GO:000703211 | Liver | HCC | endosome organization | 61/7958 | 82/18723 | 4.36e-09 | 1.15e-07 | 61 |
| GO:000705111 | Liver | HCC | spindle organization | 116/7958 | 184/18723 | 1.40e-08 | 3.40e-07 | 116 |
| GO:003250911 | Liver | HCC | endosome transport via multivesicular body sorting pathway | 28/7958 | 31/18723 | 3.56e-08 | 7.87e-07 | 28 |
| GO:0007059 | Liver | HCC | chromosome segregation | 197/7958 | 346/18723 | 3.57e-08 | 7.87e-07 | 197 |
| GO:007198511 | Liver | HCC | multivesicular body sorting pathway | 32/7958 | 37/18723 | 3.85e-08 | 8.35e-07 | 32 |
| GO:000705211 | Liver | HCC | mitotic spindle organization | 80/7958 | 120/18723 | 7.43e-08 | 1.50e-06 | 80 |
| GO:005212612 | Liver | HCC | movement in host environment | 109/7958 | 175/18723 | 9.58e-08 | 1.89e-06 | 109 |
| GO:007097212 | Liver | HCC | protein localization to endoplasmic reticulum | 54/7958 | 74/18723 | 1.01e-07 | 1.98e-06 | 54 |
| GO:007099722 | Liver | HCC | neuron death | 202/7958 | 361/18723 | 1.44e-07 | 2.70e-06 | 202 |
| GO:19050371 | Liver | HCC | autophagosome organization | 70/7958 | 103/18723 | 1.52e-07 | 2.82e-06 | 70 |
| GO:190285011 | Liver | HCC | microtubule cytoskeleton organization involved in mitosis | 93/7958 | 147/18723 | 2.91e-07 | 5.09e-06 | 93 |
| GO:003625711 | Liver | HCC | multivesicular body organization | 27/7958 | 31/18723 | 3.48e-07 | 5.97e-06 | 27 |
| Page: 1 2 3 4 5 6 7 8 9 10 11 12 13 14 15 16 17 18 19 20 21 22 23 24 25 26 27 28 29 30 31 32 33 34 35 36 37 38 39 40 41 42 43 44 45 46 47 48 49 50 51 52 53 54 55 56 57 58 59 60 61 62 63 64 65 66 67 68 69 70 71 72 |
| Pathway ID | Tissue | Disease Stage | Description | Gene Ratio | Bg Ratio | pvalue | p.adjust | qvalue | Count |
| hsa04144 | Colorectum | AD | Endocytosis | 111/2092 | 251/8465 | 5.95e-12 | 1.42e-10 | 9.08e-11 | 111 |
| hsa041441 | Colorectum | AD | Endocytosis | 111/2092 | 251/8465 | 5.95e-12 | 1.42e-10 | 9.08e-11 | 111 |
| hsa041442 | Colorectum | SER | Endocytosis | 81/1580 | 251/8465 | 1.14e-07 | 2.36e-06 | 1.71e-06 | 81 |
| hsa04217 | Colorectum | SER | Necroptosis | 47/1580 | 159/8465 | 5.21e-04 | 4.44e-03 | 3.22e-03 | 47 |
| hsa041443 | Colorectum | SER | Endocytosis | 81/1580 | 251/8465 | 1.14e-07 | 2.36e-06 | 1.71e-06 | 81 |
| hsa042171 | Colorectum | SER | Necroptosis | 47/1580 | 159/8465 | 5.21e-04 | 4.44e-03 | 3.22e-03 | 47 |
| hsa041444 | Colorectum | MSS | Endocytosis | 102/1875 | 251/8465 | 1.85e-11 | 4.43e-10 | 2.71e-10 | 102 |
| hsa03250 | Colorectum | MSS | Viral life cycle - HIV-1 | 23/1875 | 63/8465 | 6.55e-03 | 2.64e-02 | 1.62e-02 | 23 |
| hsa041445 | Colorectum | MSS | Endocytosis | 102/1875 | 251/8465 | 1.85e-11 | 4.43e-10 | 2.71e-10 | 102 |
| hsa032501 | Colorectum | MSS | Viral life cycle - HIV-1 | 23/1875 | 63/8465 | 6.55e-03 | 2.64e-02 | 1.62e-02 | 23 |
| hsa041446 | Colorectum | FAP | Endocytosis | 78/1404 | 251/8465 | 6.20e-09 | 2.96e-07 | 1.80e-07 | 78 |
| hsa041447 | Colorectum | FAP | Endocytosis | 78/1404 | 251/8465 | 6.20e-09 | 2.96e-07 | 1.80e-07 | 78 |
| hsa041448 | Colorectum | CRC | Endocytosis | 65/1091 | 251/8465 | 1.27e-08 | 1.06e-06 | 7.19e-07 | 65 |
| hsa041449 | Colorectum | CRC | Endocytosis | 65/1091 | 251/8465 | 1.27e-08 | 1.06e-06 | 7.19e-07 | 65 |
| hsa0414420 | Endometrium | AEH | Endocytosis | 56/1197 | 251/8465 | 2.58e-04 | 2.15e-03 | 1.57e-03 | 56 |
| hsa04144110 | Endometrium | AEH | Endocytosis | 56/1197 | 251/8465 | 2.58e-04 | 2.15e-03 | 1.57e-03 | 56 |
| hsa0414424 | Endometrium | EEC | Endocytosis | 57/1237 | 251/8465 | 3.34e-04 | 2.82e-03 | 2.10e-03 | 57 |
| hsa0414434 | Endometrium | EEC | Endocytosis | 57/1237 | 251/8465 | 3.34e-04 | 2.82e-03 | 2.10e-03 | 57 |
| hsa0414429 | Esophagus | HGIN | Endocytosis | 76/1383 | 251/8465 | 1.74e-08 | 3.34e-07 | 2.65e-07 | 76 |
| hsa04144113 | Esophagus | HGIN | Endocytosis | 76/1383 | 251/8465 | 1.74e-08 | 3.34e-07 | 2.65e-07 | 76 |
| Page: 1 2 3 4 |
Top |
Cell-cell communication analysis |
| Identification of potential cell-cell interactions between two cell types and their ligand-receptor pairs for different disease states |
| Ligand | Receptor | LRpair | Pathway | Tissue | Disease Stage |
| Page: 1 |
Top |
Single-cell gene regulatory network inference analysis |
| Find out the significant the regulons (TFs) and the target genes of each regulon across cell types for different disease states |
| TF | Cell Type | Tissue | Disease Stage | Target Gene | RSS | Regulon Activity |
| ∗The dot plots of a searched regulon are shown for all cell subpopulations in each disease state of each tissue based on the regulon specific score inferred using pySCENIC and by calculating the average expression. |
| Page: 1 |
Top |
Somatic mutation of malignant transformation related genes |
| Annotation of somatic variants for genes involved in malignant transformation |
| Hugo Symbol | Variant Class | Variant Classification | dbSNP RS | HGVSc | HGVSp | HGVSp Short | SWISSPROT | BIOTYPE | SIFT | PolyPhen | Tumor Sample Barcode | Tissue | Histology | Sex | Age | Stage | Therapy Types | Drugs | Outcome |
| CHMP4B | SNV | Missense_Mutation | c.559G>A | p.Glu187Lys | p.E187K | Q9H444 | protein_coding | tolerated(0.36) | benign(0.025) | TCGA-D8-A1XQ-01 | Breast | breast invasive carcinoma | Female | >=65 | I/II | Unknown | Unknown | SD | |
| CHMP4B | insertion | Frame_Shift_Ins | novel | c.471_472insTTTGTATGTAG | p.Glu158PhefsTer15 | p.E158Ffs*15 | Q9H444 | protein_coding | TCGA-A7-A0CJ-01 | Breast | breast invasive carcinoma | Female | <65 | I/II | Chemotherapy | cytoxan | SD | ||
| CHMP4B | insertion | Frame_Shift_Ins | novel | c.473_474insCCTTGATAGTGCCACCTGTAGG | p.Glu158AspfsTer10 | p.E158Dfs*10 | Q9H444 | protein_coding | TCGA-A7-A0CJ-01 | Breast | breast invasive carcinoma | Female | <65 | I/II | Chemotherapy | cytoxan | SD | ||
| CHMP4B | insertion | Frame_Shift_Ins | novel | c.364_365insT | p.Asn122IlefsTer6 | p.N122Ifs*6 | Q9H444 | protein_coding | TCGA-A8-A085-01 | Breast | breast invasive carcinoma | Male | <65 | I/II | Hormone Therapy | tamoxiphen | SD | ||
| CHMP4B | deletion | Frame_Shift_Del | novel | c.367delN | p.Met123TrpfsTer9 | p.M123Wfs*9 | Q9H444 | protein_coding | TCGA-A8-A085-01 | Breast | breast invasive carcinoma | Male | <65 | I/II | Hormone Therapy | tamoxiphen | SD | ||
| CHMP4B | SNV | Missense_Mutation | novel | c.202N>A | p.Ala68Thr | p.A68T | Q9H444 | protein_coding | deleterious(0.01) | probably_damaging(0.998) | TCGA-2W-A8YY-01 | Cervix | cervical & endocervical cancer | Female | <65 | I/II | Chemotherapy | cisplatin | CR |
| CHMP4B | SNV | Missense_Mutation | novel | c.5C>T | p.Ser2Leu | p.S2L | Q9H444 | protein_coding | deleterious(0) | benign(0) | TCGA-C5-A902-01 | Cervix | cervical & endocervical cancer | Female | <65 | I/II | Chemotherapy | cisplatin | SD |
| CHMP4B | SNV | Missense_Mutation | novel | c.122N>G | p.Glu41Gly | p.E41G | Q9H444 | protein_coding | deleterious(0) | possibly_damaging(0.833) | TCGA-A6-6652-01 | Colorectum | colon adenocarcinoma | Male | <65 | I/II | Targeted Molecular therapy | cetuximab | SD |
| CHMP4B | SNV | Missense_Mutation | rs746089715 | c.497N>T | p.Ala166Val | p.A166V | Q9H444 | protein_coding | tolerated(0.11) | probably_damaging(0.962) | TCGA-AA-3811-01 | Colorectum | colon adenocarcinoma | Female | >=65 | III/IV | Unknown | Unknown | PD |
| CHMP4B | deletion | Frame_Shift_Del | c.62delN | p.Gln23ArgfsTer14 | p.Q23Rfs*14 | Q9H444 | protein_coding | TCGA-D5-6540-01 | Colorectum | colon adenocarcinoma | Male | >=65 | I/II | Unknown | Unknown | SD |
| Page: 1 2 3 |
Top |
Related drugs of malignant transformation related genes |
| Identification of chemicals and drugs interact with genes involved in malignant transfromation |
| (DGIdb 4.0) |
| Entrez ID | Symbol | Category | Interaction Types | Drug Claim Name | Drug Name | PMIDs |
| Page: 1 |

Copyright 2023-Present -The University of Texas Health Science Center at Houston |