Schematic overview of the cellular and molecular mechanisms involved in the cancer progression, including the proposed cellular and molecular mechanisms in cancer cells trajectory. AT1: alveolar type 1 cells; AT2: alveolar type 2 cells; AAH: atypical adenomatous hyperplasia; AIS: adenocarcinoma in situ; MIA: minimally invasive adenocarcinoma; IA: invasive adenocarcinoma; EMT: epithelial-mesenchymal transition

Home

Download

Statistics

Help

Contact

Center for Computational Systems Medicine
leaf

Gene summary

leaf

Malignant transformation analysis

leaf

Malignant transformation related pathway analysis

leaf

Cell-cell communication analysis

leaf

Single-cell gene regulatory network inference analysis

leaf

Somatic mutation of malignant transformation related genes

leaf

Related drugs of malignant transformation related genes

Gene: CDC73

Gene summary for CDC73

check button Gene summary.

Gene informationSpeciesHuman
Gene symbol

CDC73

Gene ID

79577

Gene namecell division cycle 73
Gene AliasC1orf28
Cytomap1q31.2
Gene Typeprotein-coding
GO ID

GO:0000082

UniProtAcc

Q6P1J9


Top

Malignant transformation analysis

check button Identification of the aberrant gene expression in precancerous and cancerous lesions by comparing the gene expression of stem-like cells in diseased tissues with normal stem cells
check button Malignant transformation involving gene list.
Entrez IDSymbolReplicatesSpeciesOrganTissueAdj P-valueLog2FCMalignancy
79577CDC73LZE4THumanEsophagusESCC3.76e-185.13e-010.0811
79577CDC73LZE5THumanEsophagusESCC1.74e-062.06e-010.0514
79577CDC73LZE7THumanEsophagusESCC1.18e-066.35e-010.0667
79577CDC73LZE8THumanEsophagusESCC3.93e-059.85e-020.067
79577CDC73LZE20THumanEsophagusESCC1.80e-122.40e-010.0662
79577CDC73LZE22D1HumanEsophagusHGIN1.62e-049.87e-020.0595
79577CDC73LZE22THumanEsophagusESCC7.34e-125.50e-010.068
79577CDC73LZE24THumanEsophagusESCC2.19e-175.52e-010.0596
79577CDC73LZE6THumanEsophagusESCC8.01e-045.36e-020.0845
79577CDC73P1T-EHumanEsophagusESCC3.12e-064.08e-010.0875
79577CDC73P2T-EHumanEsophagusESCC9.50e-326.39e-010.1177
79577CDC73P4T-EHumanEsophagusESCC1.09e-307.81e-010.1323
79577CDC73P5T-EHumanEsophagusESCC1.15e-255.99e-010.1327
79577CDC73P8T-EHumanEsophagusESCC3.36e-233.21e-010.0889
79577CDC73P9T-EHumanEsophagusESCC5.11e-263.39e-010.1131
79577CDC73P10T-EHumanEsophagusESCC8.34e-204.79e-010.116
79577CDC73P11T-EHumanEsophagusESCC1.04e-206.96e-010.1426
79577CDC73P12T-EHumanEsophagusESCC6.11e-133.65e-010.1122
79577CDC73P15T-EHumanEsophagusESCC3.64e-246.27e-010.1149
79577CDC73P16T-EHumanEsophagusESCC1.56e-287.08e-010.1153
Page: 1 2 3 4 5 6 7 

check button Transcriptomic changes along malignancy continuum.
TissueExpression DynamicsAbbreviation
EsophagusThe image shows the transcriptomic changes along malignancy continuum.log2FC in expression of this searched gene in stem-like cells from each diseased tissue sample relative to stem-like cells in normal samples in each tissue plotted against the malignancy continuum. Samples are colored based on if they are from different disease stage.
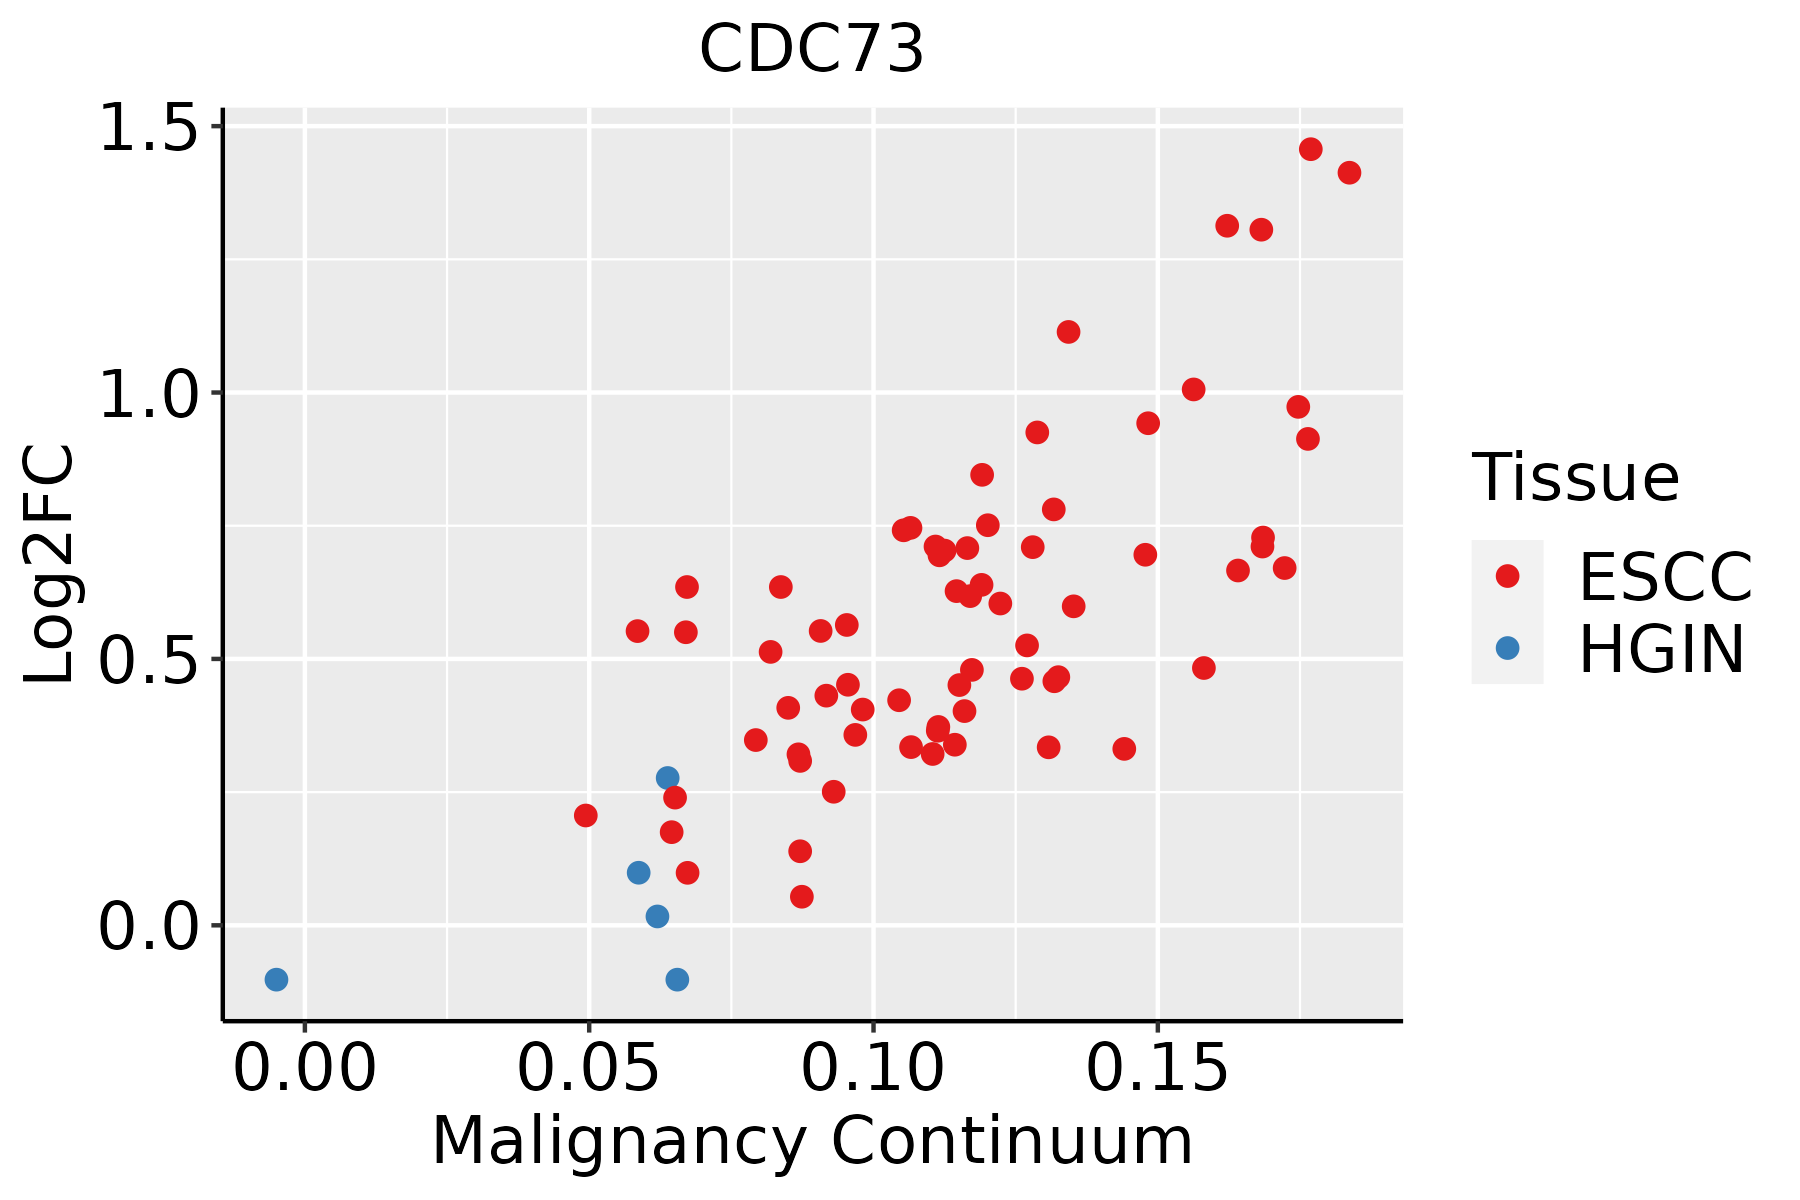
ESCC: Esophageal squamous cell carcinoma
HGIN: High-grade intraepithelial neoplasias
LGIN: Low-grade intraepithelial neoplasias
LiverThe image shows the transcriptomic changes along malignancy continuum.log2FC in expression of this searched gene in stem-like cells from each diseased tissue sample relative to stem-like cells in normal samples in each tissue plotted against the malignancy continuum. Samples are colored based on if they are from different disease stage.HCC: Hepatocellular carcinoma
NAFLD: Non-alcoholic fatty liver disease
LungThe image shows the transcriptomic changes along malignancy continuum.log2FC in expression of this searched gene in stem-like cells from each diseased tissue sample relative to stem-like cells in normal samples in each tissue plotted against the malignancy continuum. Samples are colored based on if they are from different disease stage.AAH: Atypical adenomatous hyperplasia
AIS: Adenocarcinoma in situ
IAC: Invasive lung adenocarcinoma
MIA: Minimally invasive adenocarcinoma
Oral CavityThe image shows the transcriptomic changes along malignancy continuum.log2FC in expression of this searched gene in stem-like cells from each diseased tissue sample relative to stem-like cells in normal samples in each tissue plotted against the malignancy continuum. Samples are colored based on if they are from different disease stage.
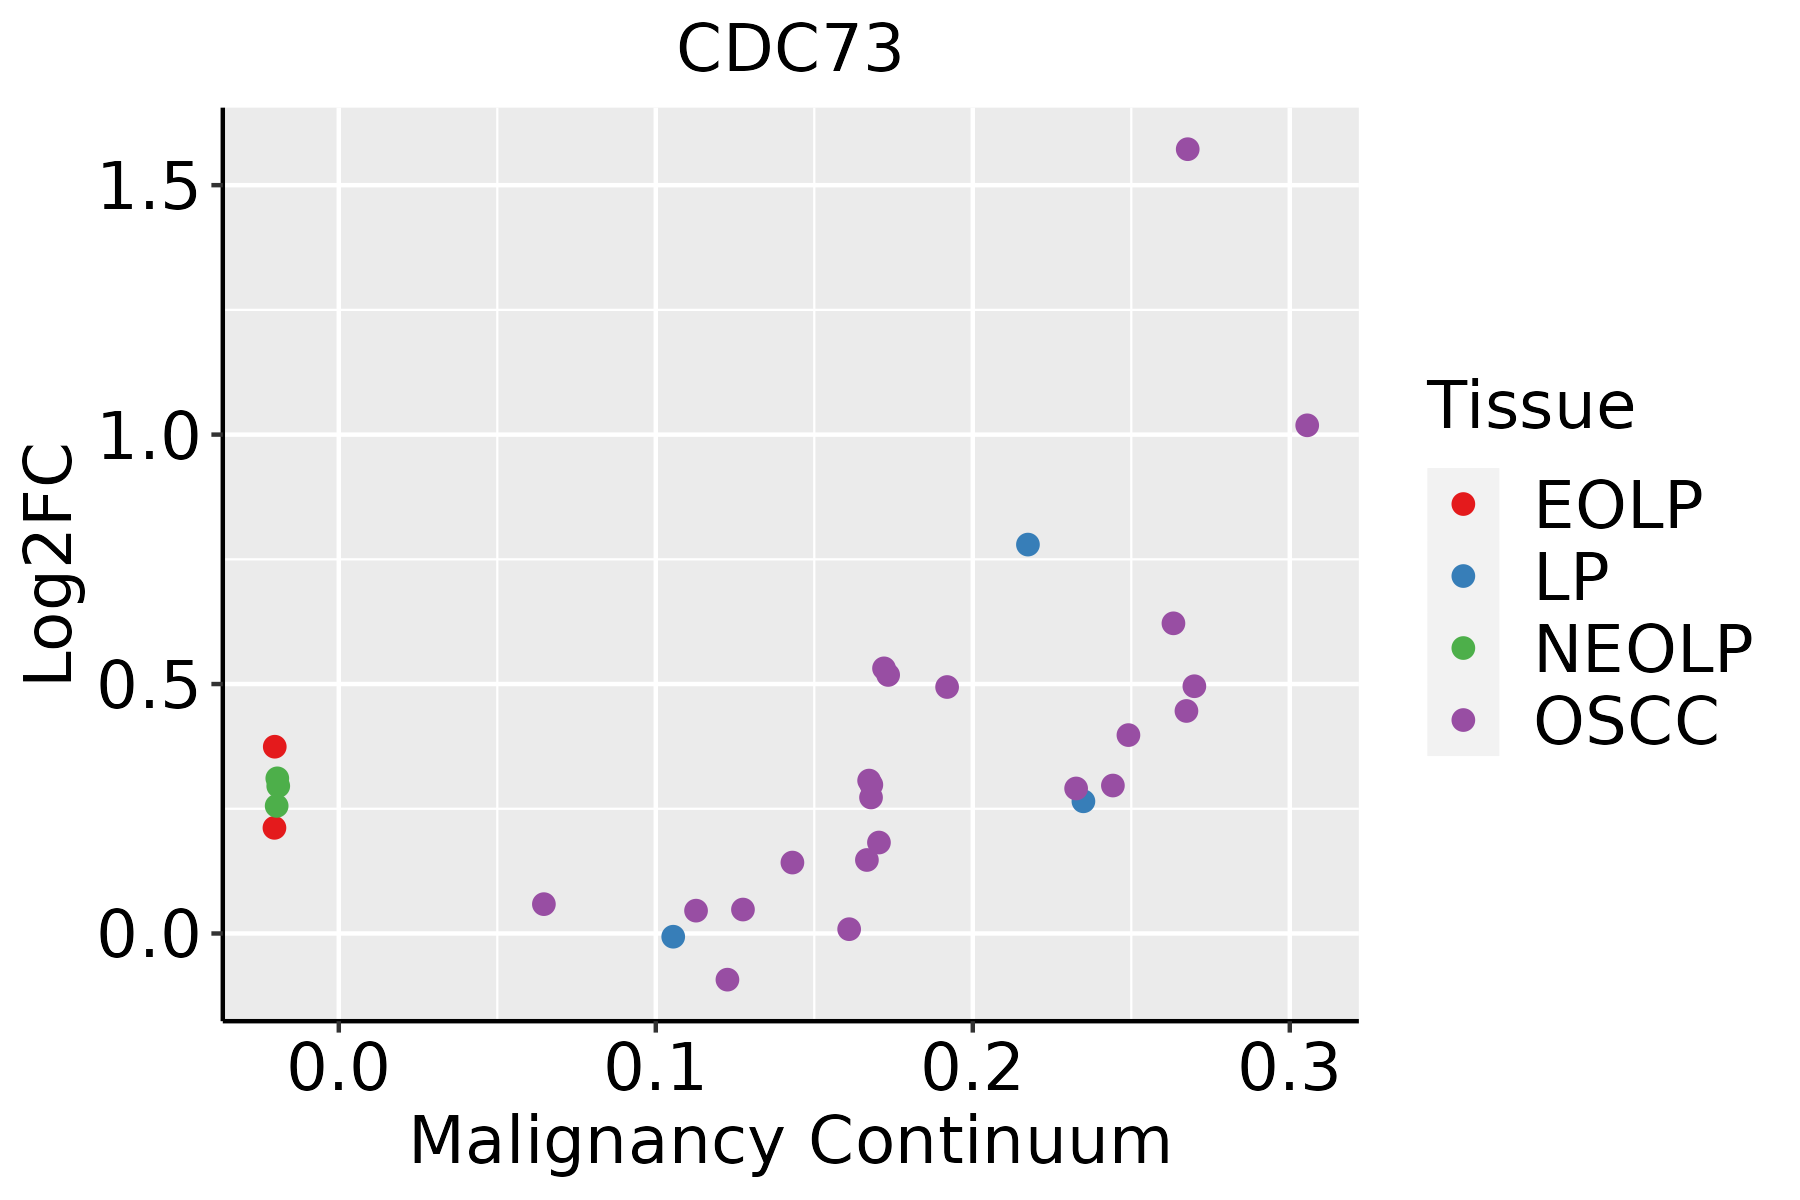
EOLP: Erosive Oral lichen planus
LP: leukoplakia
NEOLP: Non-erosive oral lichen planus
OSCC: Oral squamous cell carcinoma
ProstateThe image shows the transcriptomic changes along malignancy continuum.log2FC in expression of this searched gene in stem-like cells from each diseased tissue sample relative to stem-like cells in normal samples in each tissue plotted against the malignancy continuum. Samples are colored based on if they are from different disease stage.
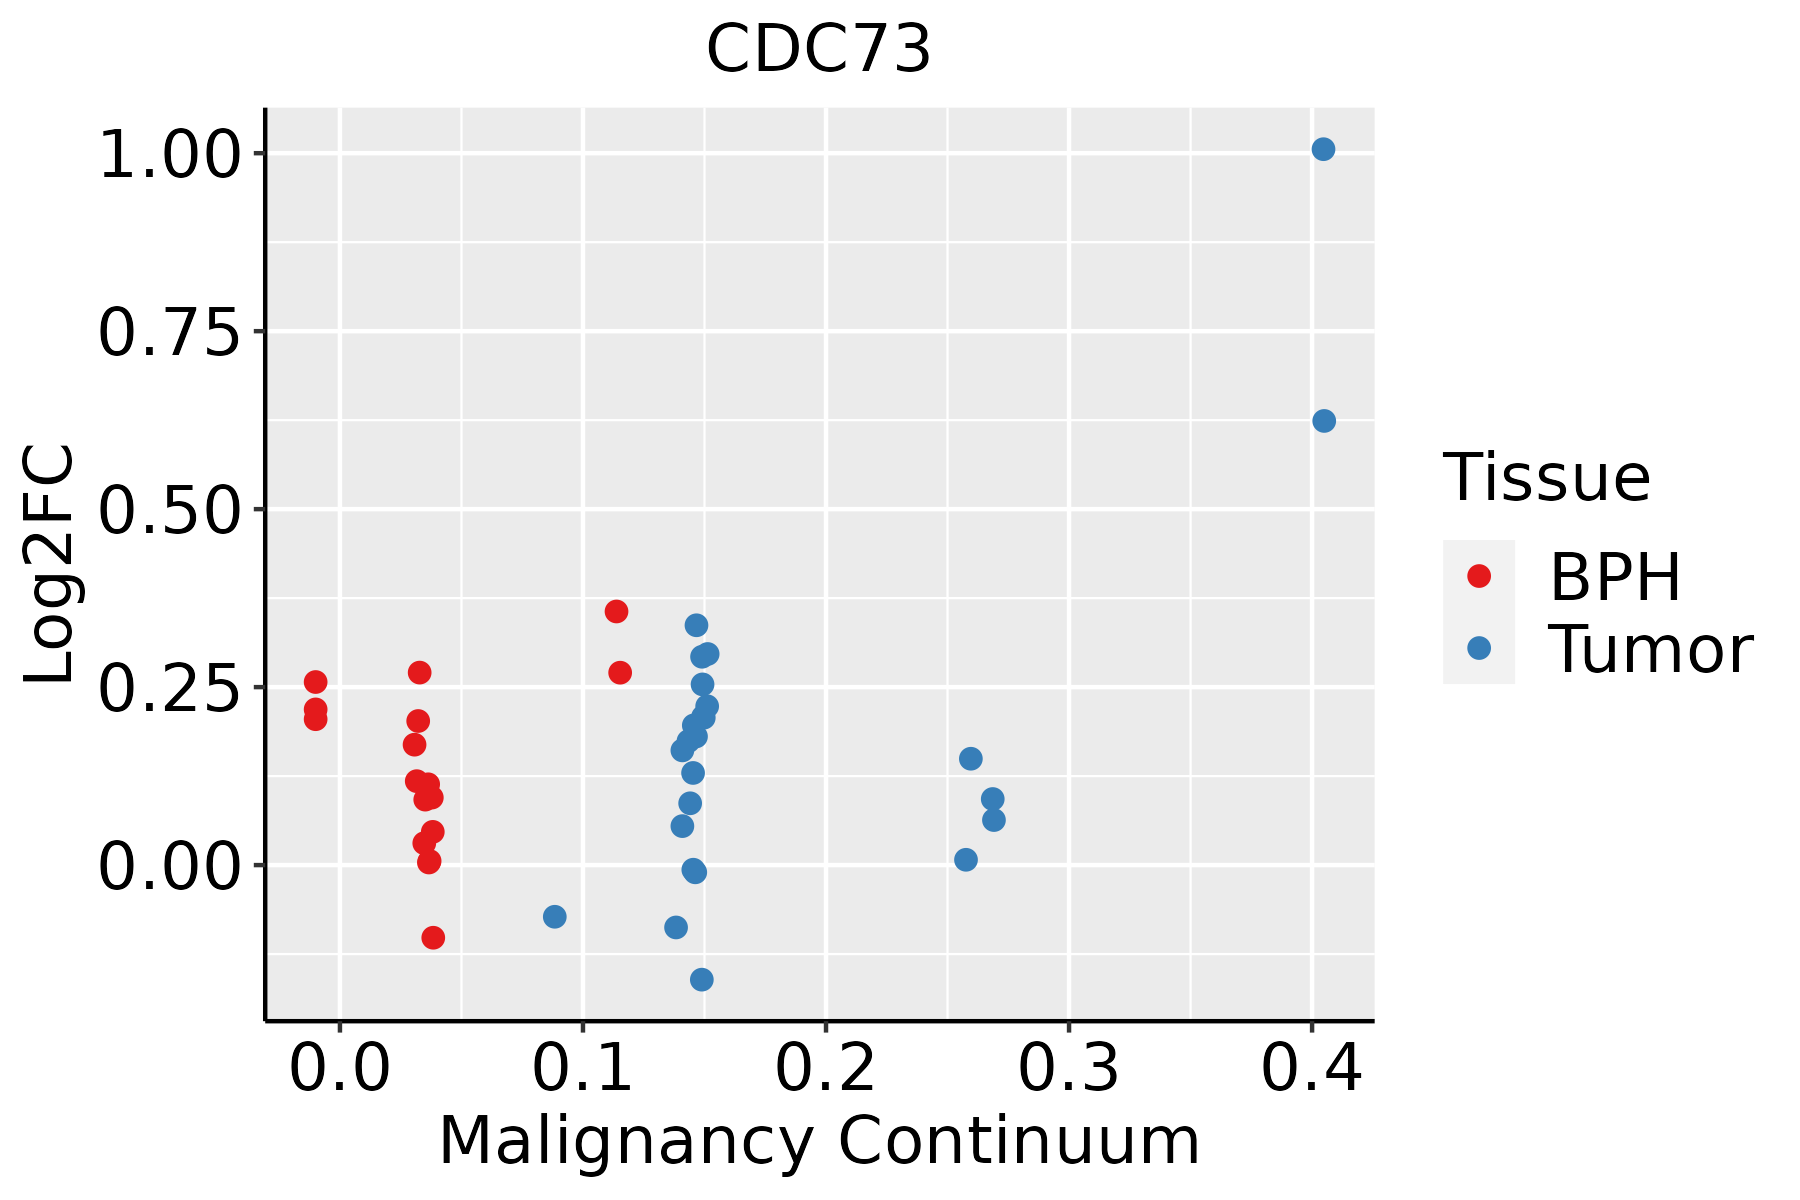
BPH: Benign Prostatic Hyperplasia
SkinThe image shows the transcriptomic changes along malignancy continuum.log2FC in expression of this searched gene in stem-like cells from each diseased tissue sample relative to stem-like cells in normal samples in each tissue plotted against the malignancy continuum. Samples are colored based on if they are from different disease stage.
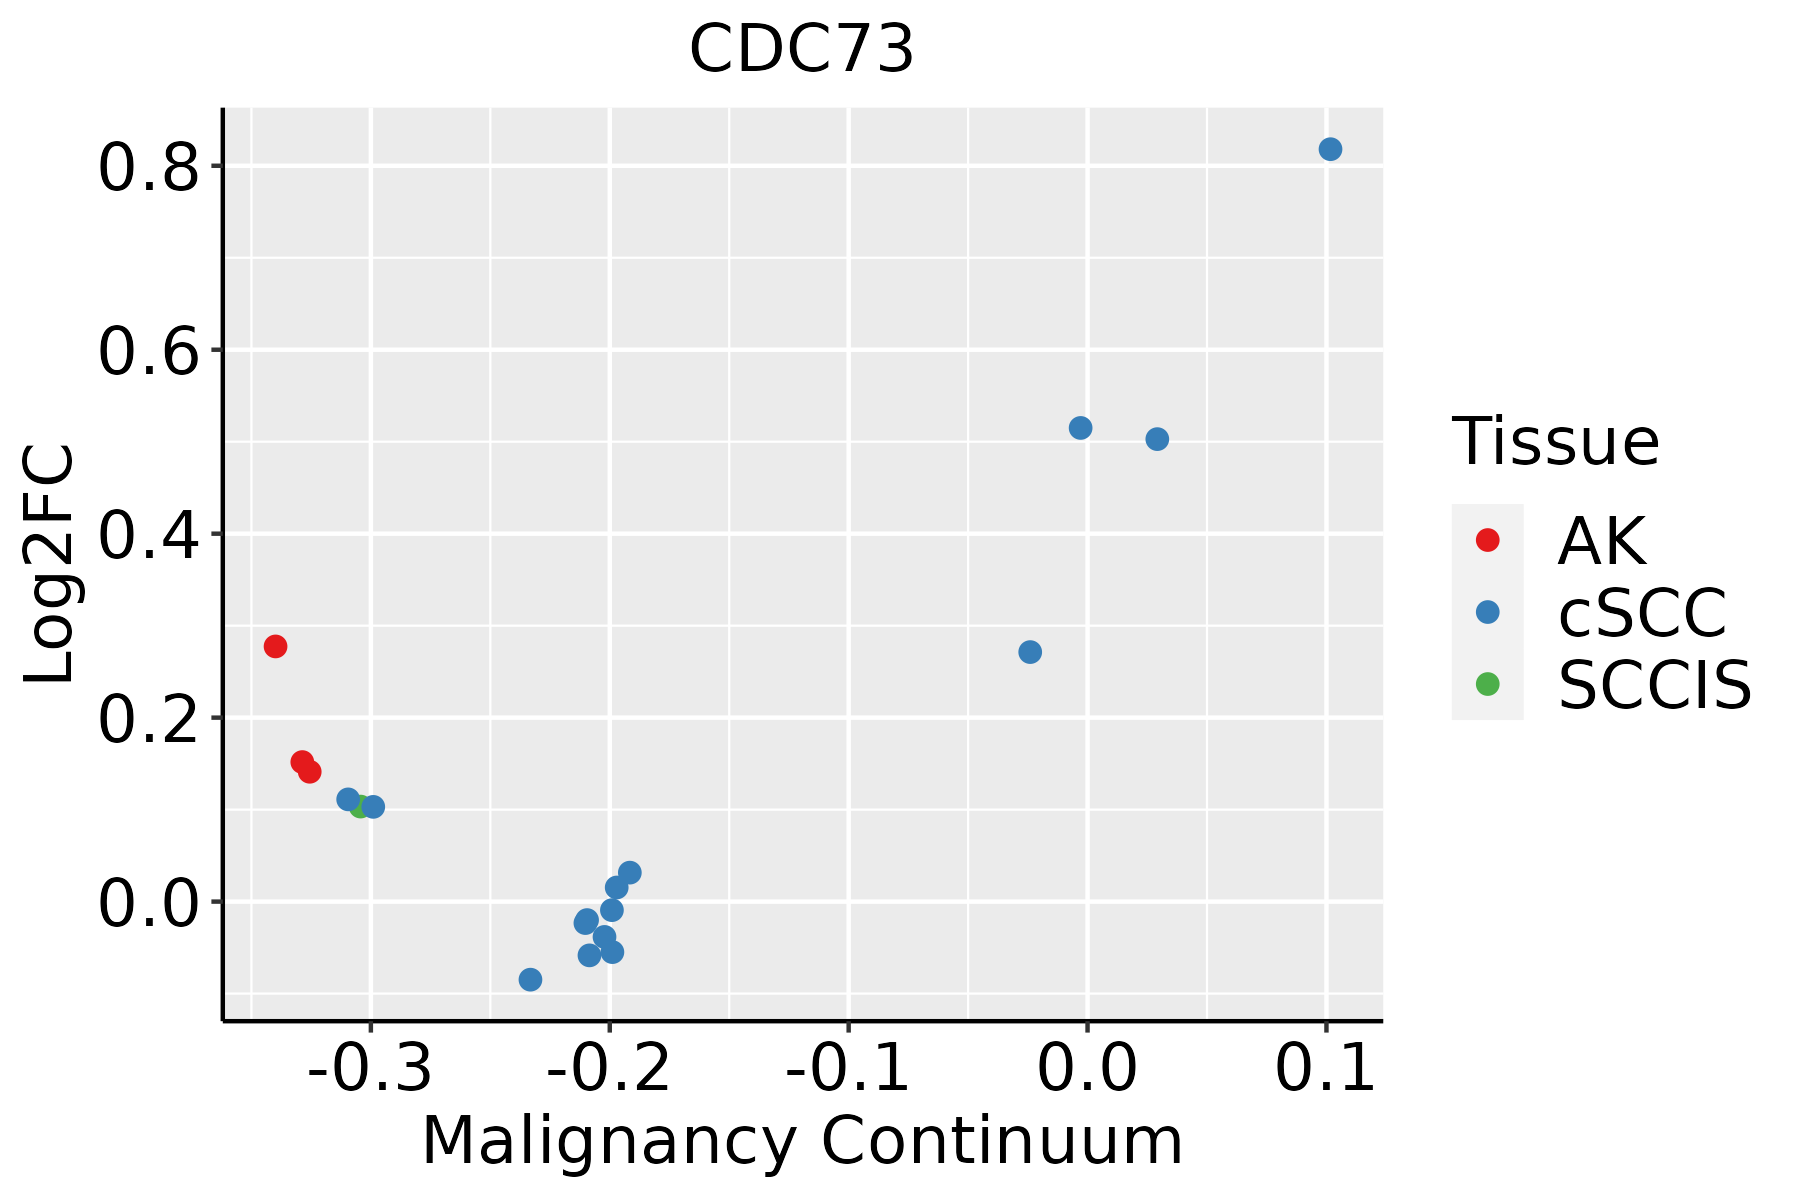
AK: Actinic keratosis
cSCC: Cutaneous squamous cell carcinoma
SCCIS:squamous cell carcinoma in situ
ThyroidThe image shows the transcriptomic changes along malignancy continuum.log2FC in expression of this searched gene in stem-like cells from each diseased tissue sample relative to stem-like cells in normal samples in each tissue plotted against the malignancy continuum. Samples are colored based on if they are from different disease stage.ATC: Anaplastic thyroid cancer
HT: Hashimoto's thyroiditis
PTC: Papillary thyroid cancer
∗log2FC in expression of this searched gene in stem-like cells from each diseased tissue sample relative to stem-like cells in normal samples in each tissue plotted against the malignancy continuum. Samples are colored based on if they are from different disease stage.

Top

Malignant transformation related pathway analysis

check buttonFind out the enriched GO biological processes and KEGG pathways involved in transition from healthy to precancer to cancer
check button Figure of enriched GO biological processes.
TissueDisease StageEnriched GO biological Processes
ColorectumADGO analysis - Figure of enriched GO biological processes: Top 15 enriched GO BP terms are showed in the bar plot of each disease state in each tissue. Each row represents a significant GO biological process which is colored according to the -log10(p.adjust).
ColorectumSERGO analysis - Figure of enriched GO biological processes: Top 15 enriched GO BP terms are showed in the bar plot of each disease state in each tissue. Each row represents a significant GO biological process which is colored according to the -log10(p.adjust).
ColorectumMSSGO analysis - Figure of enriched GO biological processes: Top 15 enriched GO BP terms are showed in the bar plot of each disease state in each tissue. Each row represents a significant GO biological process which is colored according to the -log10(p.adjust).
ColorectumMSI-HGO analysis - Figure of enriched GO biological processes: Top 15 enriched GO BP terms are showed in the bar plot of each disease state in each tissue. Each row represents a significant GO biological process which is colored according to the -log10(p.adjust).
ColorectumFAPGO analysis - Figure of enriched GO biological processes: Top 15 enriched GO BP terms are showed in the bar plot of each disease state in each tissue. Each row represents a significant GO biological process which is colored according to the -log10(p.adjust).
∗Top 15 enriched GO BP terms are showed in the bar plot of each disease state in each tissue. Each row represents a significant GO biological process which is colored according to the -log10(p.adjust).
Page: 1 2 3 4 5 6 7 8 9 

check button Enriched GO biological processes.
GO IDTissueDisease StageDescriptionGene RatioBg Ratiopvaluep.adjustCount
GO:190331125SkinAKregulation of mRNA metabolic process81/1910288/187237.27e-188.61e-1581
GO:002261328SkinAKribonucleoprotein complex biogenesis108/1910463/187238.48e-176.27e-14108
GO:005068420SkinAKregulation of mRNA processing47/1910137/187231.92e-147.57e-1247
GO:001605518SkinAKWnt signaling pathway98/1910444/187239.39e-143.09e-1198
GO:019873818SkinAKcell-cell signaling by wnt98/1910446/187231.26e-133.72e-1198
GO:007182628SkinAKribonucleoprotein complex subunit organization61/1910227/187237.85e-132.02e-1061
GO:002261828SkinAKribonucleoprotein complex assembly58/1910220/187236.75e-121.33e-0958
GO:003011118SkinAKregulation of Wnt signaling pathway73/1910328/187239.27e-111.52e-0873
GO:001604920SkinAKcell growth93/1910482/187239.55e-109.42e-0893
GO:005067319SkinAKepithelial cell proliferation86/1910437/187231.52e-091.43e-0786
GO:004477210SkinAKmitotic cell cycle phase transition83/1910424/187233.81e-093.05e-0783
GO:00198278SkinAKstem cell population maintenance37/1910131/187235.65e-094.03e-0737
GO:003164728SkinAKregulation of protein stability64/1910298/187235.93e-094.14e-0764
GO:000734616SkinAKregulation of mitotic cell cycle87/1910457/187236.50e-094.47e-0787
GO:00987279SkinAKmaintenance of cell number37/1910134/187231.10e-087.11e-0737
GO:00000828SkinAKG1/S transition of mitotic cell cycle50/1910214/187231.57e-089.40e-0750
GO:00165709SkinAKhistone modification84/1910463/187231.10e-074.95e-0684
GO:00448438SkinAKcell cycle G1/S phase transition52/1910241/187231.32e-075.80e-0652
GO:003009928SkinAKmyeloid cell differentiation72/1910381/187231.76e-077.28e-0672
GO:005067818SkinAKregulation of epithelial cell proliferation72/1910381/187231.76e-077.28e-0672
Page: 1 2 3 4 5 6 7 8 9 10 11 12 13 14 15 16 17 18 19 20 21 22 23 24 25 26 27 28 29 30 31 32 33 34 35 36 37 38 39 

check button Enriched KEGG pathways.
Pathway IDTissueDisease StageDescriptionGene RatioBg Ratiopvaluep.adjustqvalueCount
Page: 1 

Top

Cell-cell communication analysis

check buttonIdentification of potential cell-cell interactions between two cell types and their ligand-receptor pairs for different disease states
LigandReceptorLRpairPathwayTissueDisease Stage
Page: 1 

Top

Single-cell gene regulatory network inference analysis

check buttonFind out the significant the regulons (TFs) and the target genes of each regulon across cell types for different disease states
TFCell TypeTissueDisease StageTarget GeneRSSRegulon Activity
∗The dot plots of a searched regulon are shown for all cell subpopulations in each disease state of each tissue based on the regulon specific score inferred using pySCENIC and by calculating the average expression.
Page: 1 

Top

Somatic mutation of malignant transformation related genes

check buttonAnnotation of somatic variants for genes involved in malignant transformation
Hugo SymbolVariant ClassVariant ClassificationdbSNP RSHGVScHGVSpHGVSp ShortSWISSPROTBIOTYPESIFTPolyPhenTumor Sample BarcodeTissueHistologySexAgeStageTherapy TypesDrugsOutcome
CDC73SNVMissense_Mutationc.1073G>Ap.Arg358Glnp.R358QQ6P1J9protein_codingdeleterious(0.01)probably_damaging(0.949)TCGA-AN-A046-01Breastbreast invasive carcinomaFemale>=65I/IIUnknownUnknownSD
CDC73SNVMissense_Mutationc.1352N>Tp.Ala451Valp.A451VQ6P1J9protein_codingtolerated(0.06)benign(0.119)TCGA-AN-A0AK-01Breastbreast invasive carcinomaFemale>=65I/IIUnknownUnknownSD
CDC73SNVMissense_Mutationc.1019N>Cp.Val340Alap.V340AQ6P1J9protein_codingtolerated(0.78)benign(0.007)TCGA-AN-A0FW-01Breastbreast invasive carcinomaFemale>=65III/IVUnknownUnknownSD
CDC73SNVMissense_Mutationnovelc.1034N>Ap.Ser345Tyrp.S345YQ6P1J9protein_codingtolerated(0.13)probably_damaging(0.949)TCGA-AR-A2LE-01Breastbreast invasive carcinomaFemale>=65I/IIHormone TherapytamoxiphenPD
CDC73SNVMissense_Mutationnovelc.947N>Tp.His316Leup.H316LQ6P1J9protein_codingdeleterious(0.01)probably_damaging(0.986)TCGA-AR-A2LN-01Breastbreast invasive carcinomaFemale>=65I/IIHormone TherapyletrozoleSD
CDC73SNVMissense_Mutationc.1247N>Ap.Gly416Aspp.G416DQ6P1J9protein_codingdeleterious(0.03)benign(0.03)TCGA-BH-A0HF-01Breastbreast invasive carcinomaFemale>=65I/IIHormone TherapyarimidexSD
CDC73SNVMissense_Mutationnovelc.1537N>Tp.Arg513Trpp.R513WQ6P1J9protein_codingdeleterious(0.02)possibly_damaging(0.562)TCGA-BH-A5IZ-01Breastbreast invasive carcinomaFemale<65I/IIChemotherapyadriamycinCR
CDC73SNVMissense_Mutationnovelc.72N>Cp.Glu24Aspp.E24DQ6P1J9protein_codingtolerated(0.2)benign(0.003)TCGA-S3-AA17-01Breastbreast invasive carcinomaFemale<65I/IIHormone TherapyanastrozoleSD
CDC73SNVMissense_Mutationc.921N>Gp.Phe307Leup.F307LQ6P1J9protein_codingdeleterious(0)probably_damaging(1)TCGA-DR-A0ZM-01Cervixcervical & endocervical cancerFemale<65III/IVUnspecificCisplatinSD
CDC73SNVMissense_Mutationrs878855091c.787C>Tp.Arg263Cysp.R263CQ6P1J9protein_codingdeleterious(0)probably_damaging(0.964)TCGA-MA-AA42-01Cervixcervical & endocervical cancerFemale>=65I/IIUnknownUnknownSD
Page: 1 2 3 4 5 6 7 8 9 

Top

Related drugs of malignant transformation related genes

check buttonIdentification of chemicals and drugs interact with genes involved in malignant transfromation
(DGIdb 4.0)
Entrez IDSymbolCategoryInteraction TypesDrug Claim NameDrug NamePMIDs
Page: 1