| Tissue | Expression Dynamics | Abbreviation |
| Cervix | 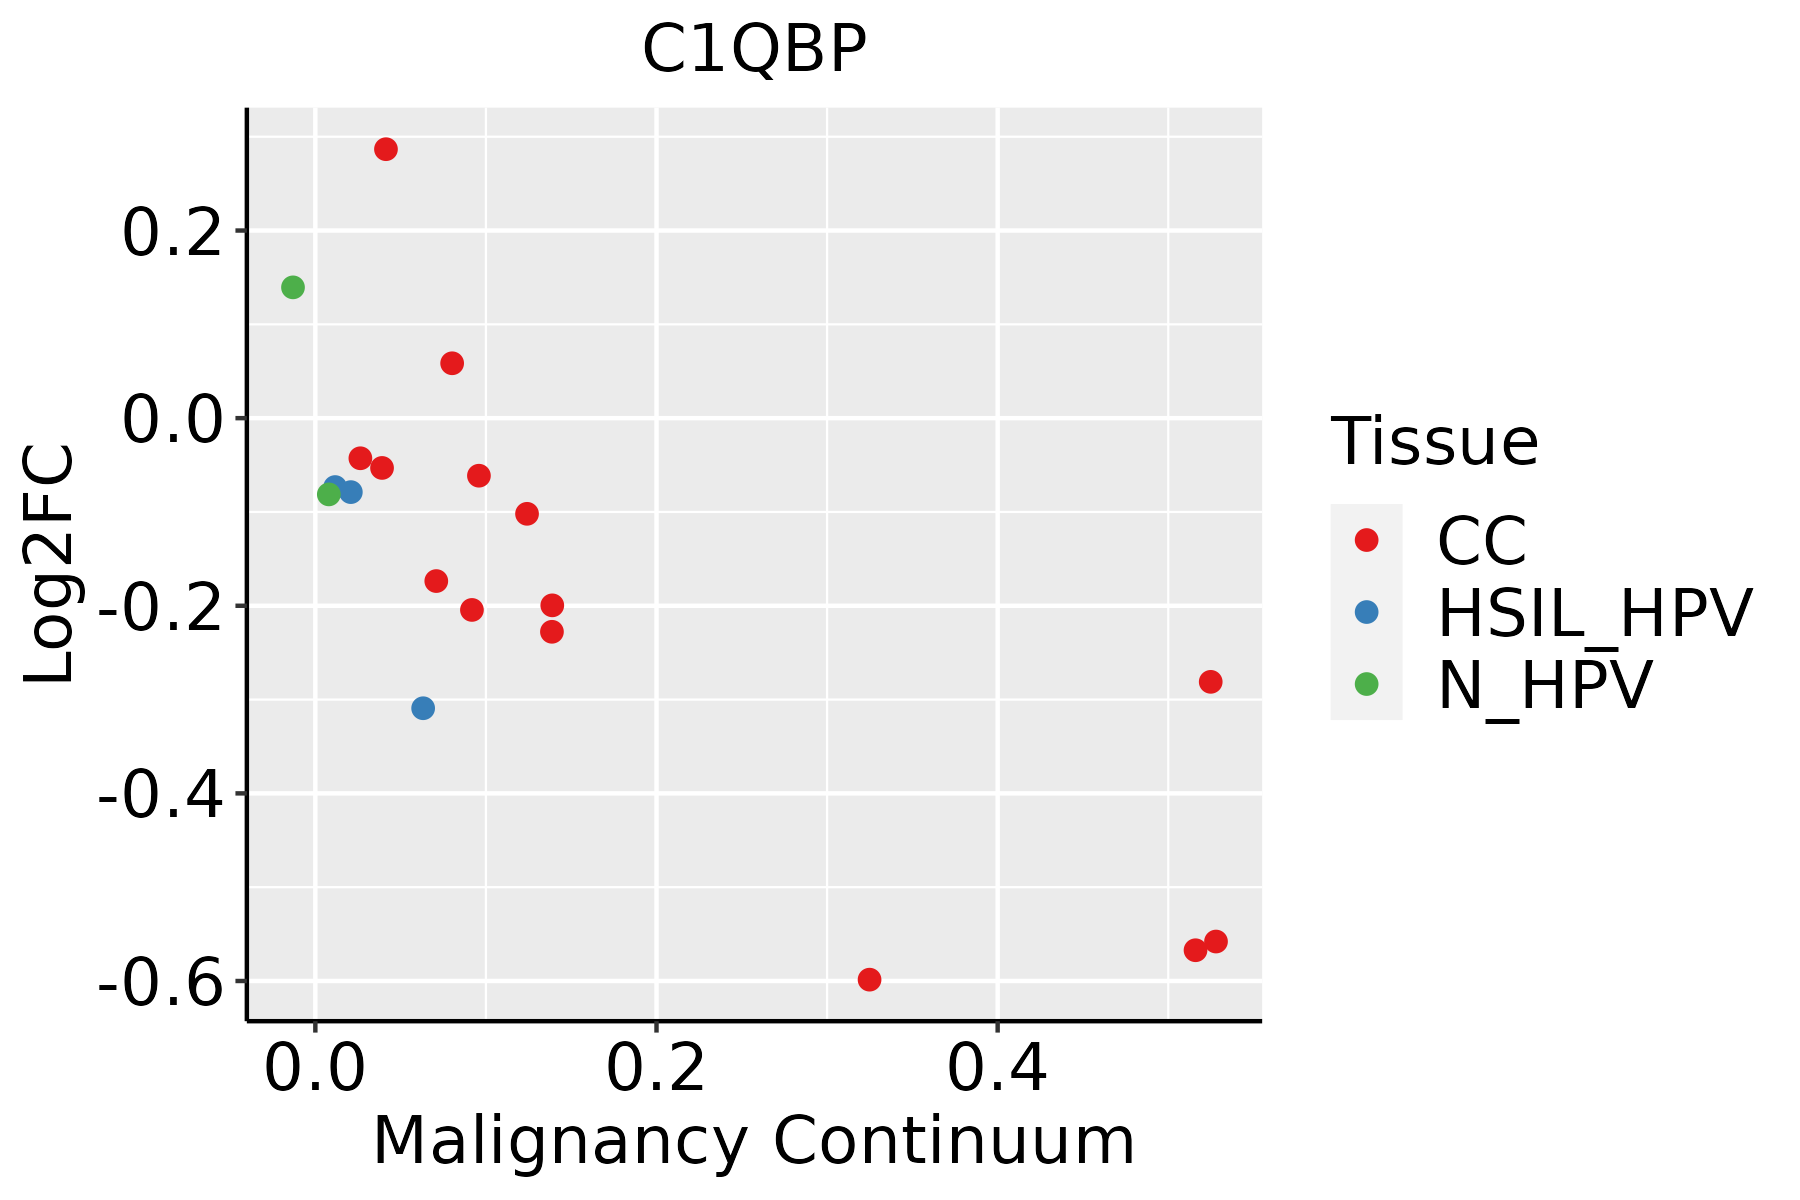 | CC: Cervix cancer |
| HSIL_HPV: HPV-infected high-grade squamous intraepithelial lesions |
| N_HPV: HPV-infected normal cervix |
| Colorectum (GSE201348) |  | FAP: Familial adenomatous polyposis |
| CRC: Colorectal cancer |
| Colorectum (HTA11) |  | AD: Adenomas |
| SER: Sessile serrated lesions |
| MSI-H: Microsatellite-high colorectal cancer |
| MSS: Microsatellite stable colorectal cancer |
| Endometrium |  | AEH: Atypical endometrial hyperplasia |
| EEC: Endometrioid Cancer |
| Esophagus | 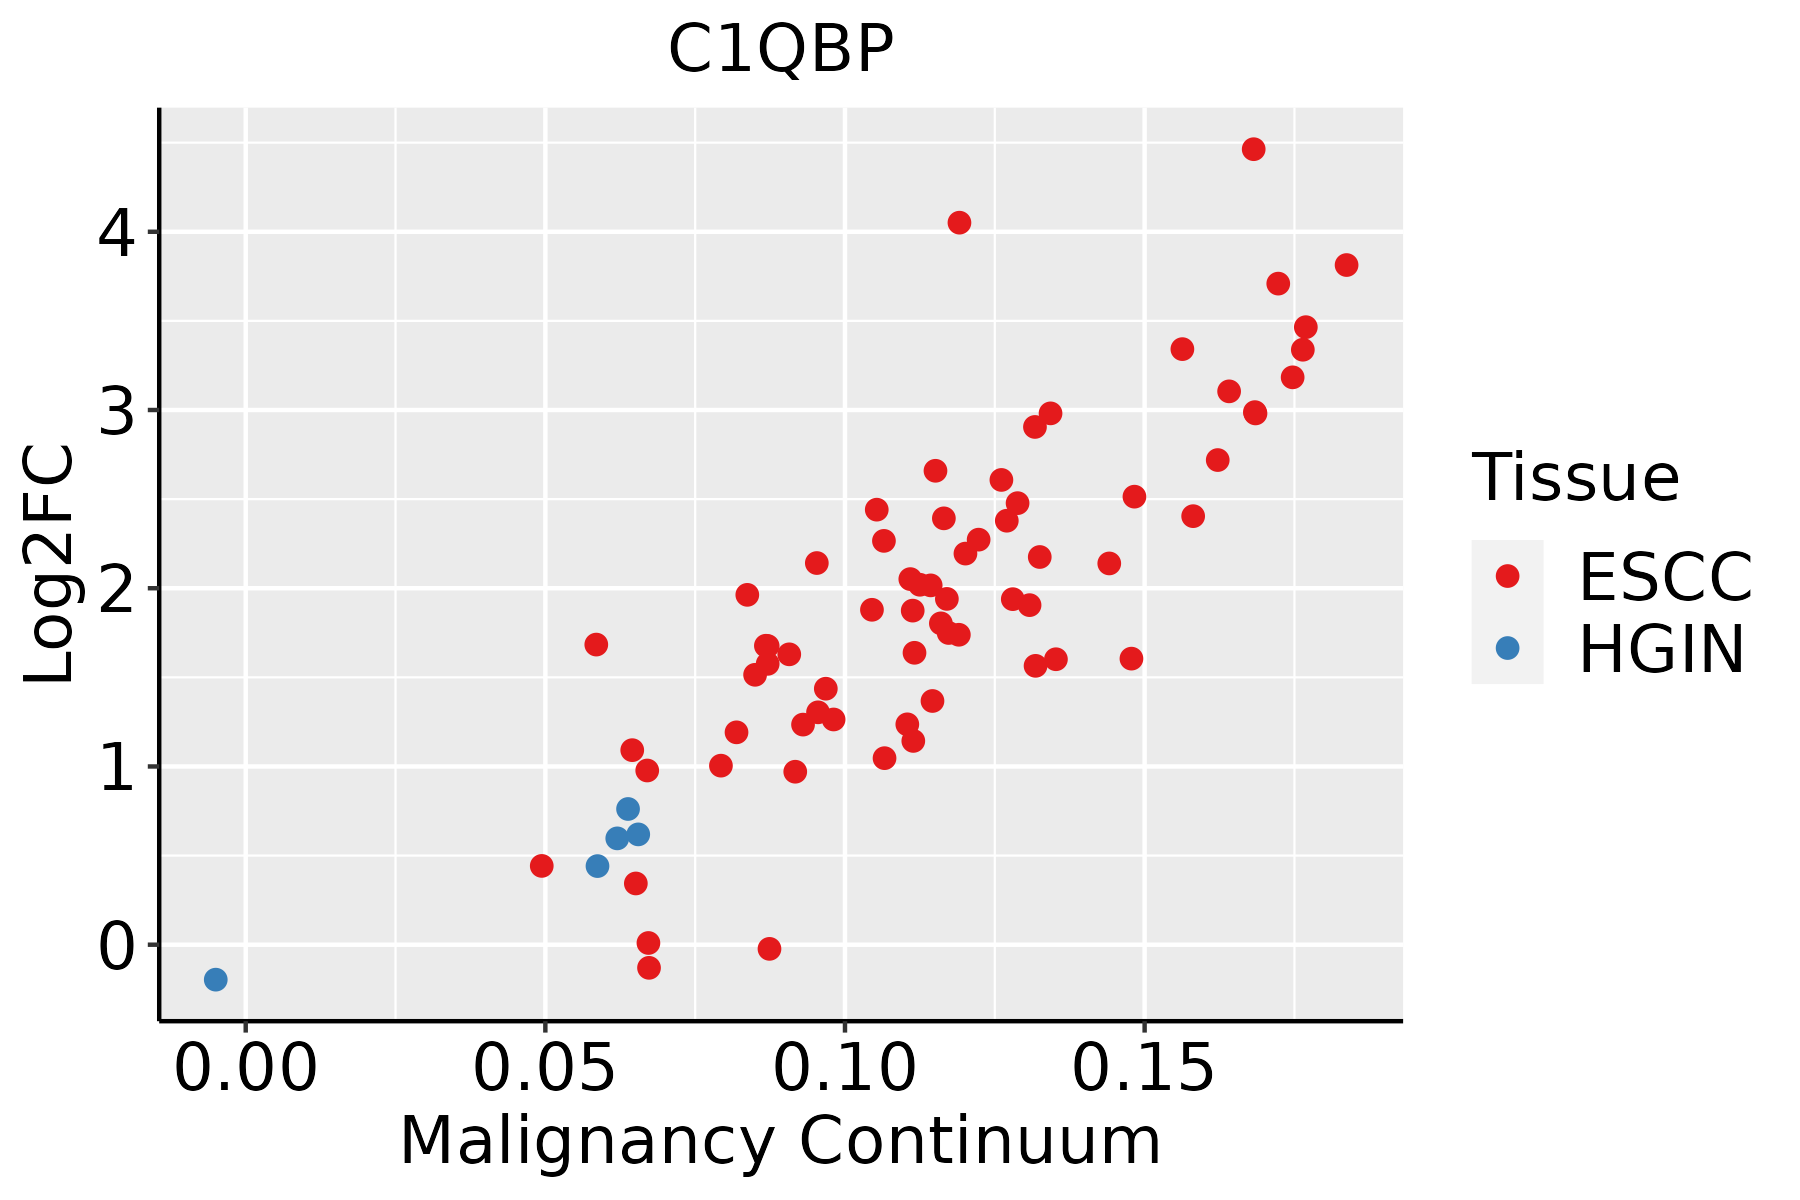 | ESCC: Esophageal squamous cell carcinoma |
| HGIN: High-grade intraepithelial neoplasias |
| LGIN: Low-grade intraepithelial neoplasias |
| GC | 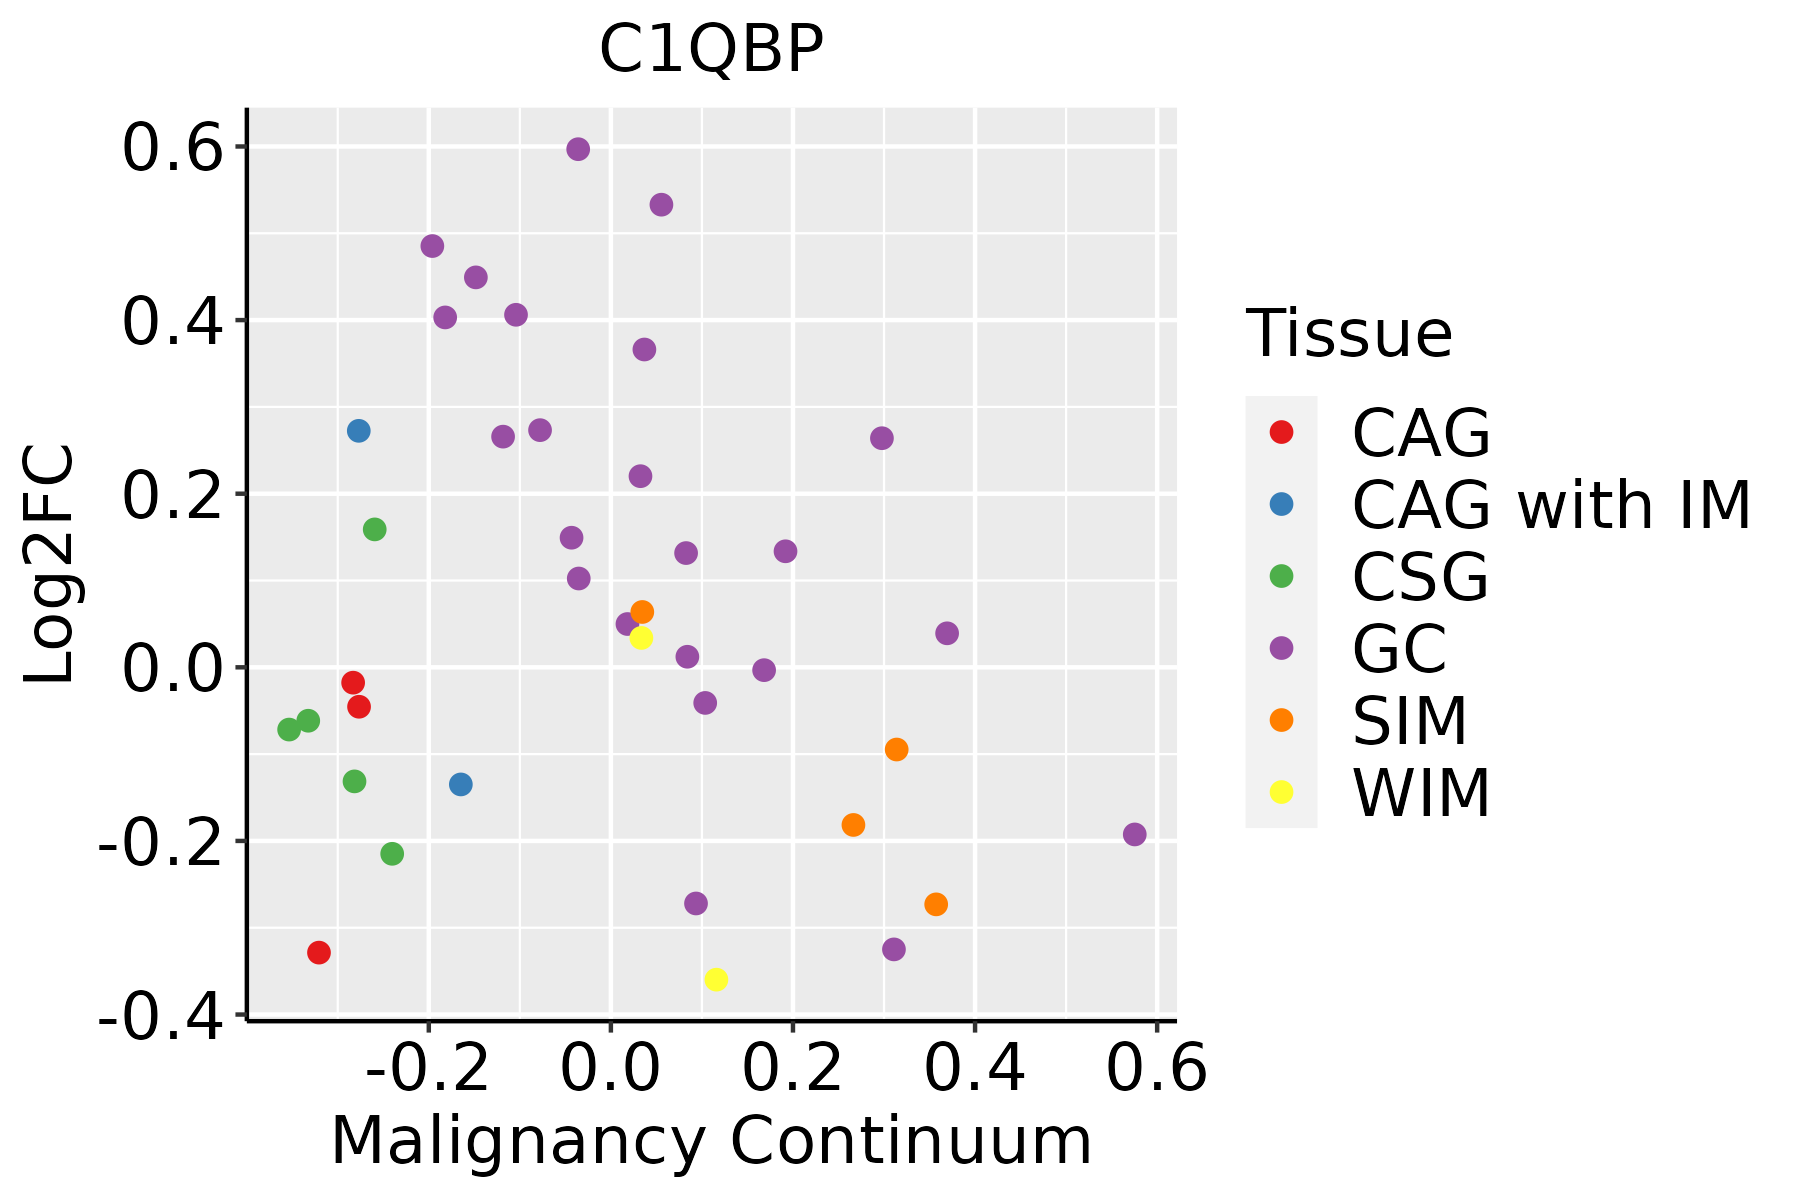 | CAG: Chronic atrophic gastritis |
| CAG with IM: Chronic atrophic gastritis with intestinal metaplasia |
| CSG: Chronic superficial gastritis |
| GC: Gastric cancer |
| SIM: Severe intestinal metaplasia |
| WIM: Wild intestinal metaplasia |
| Liver | 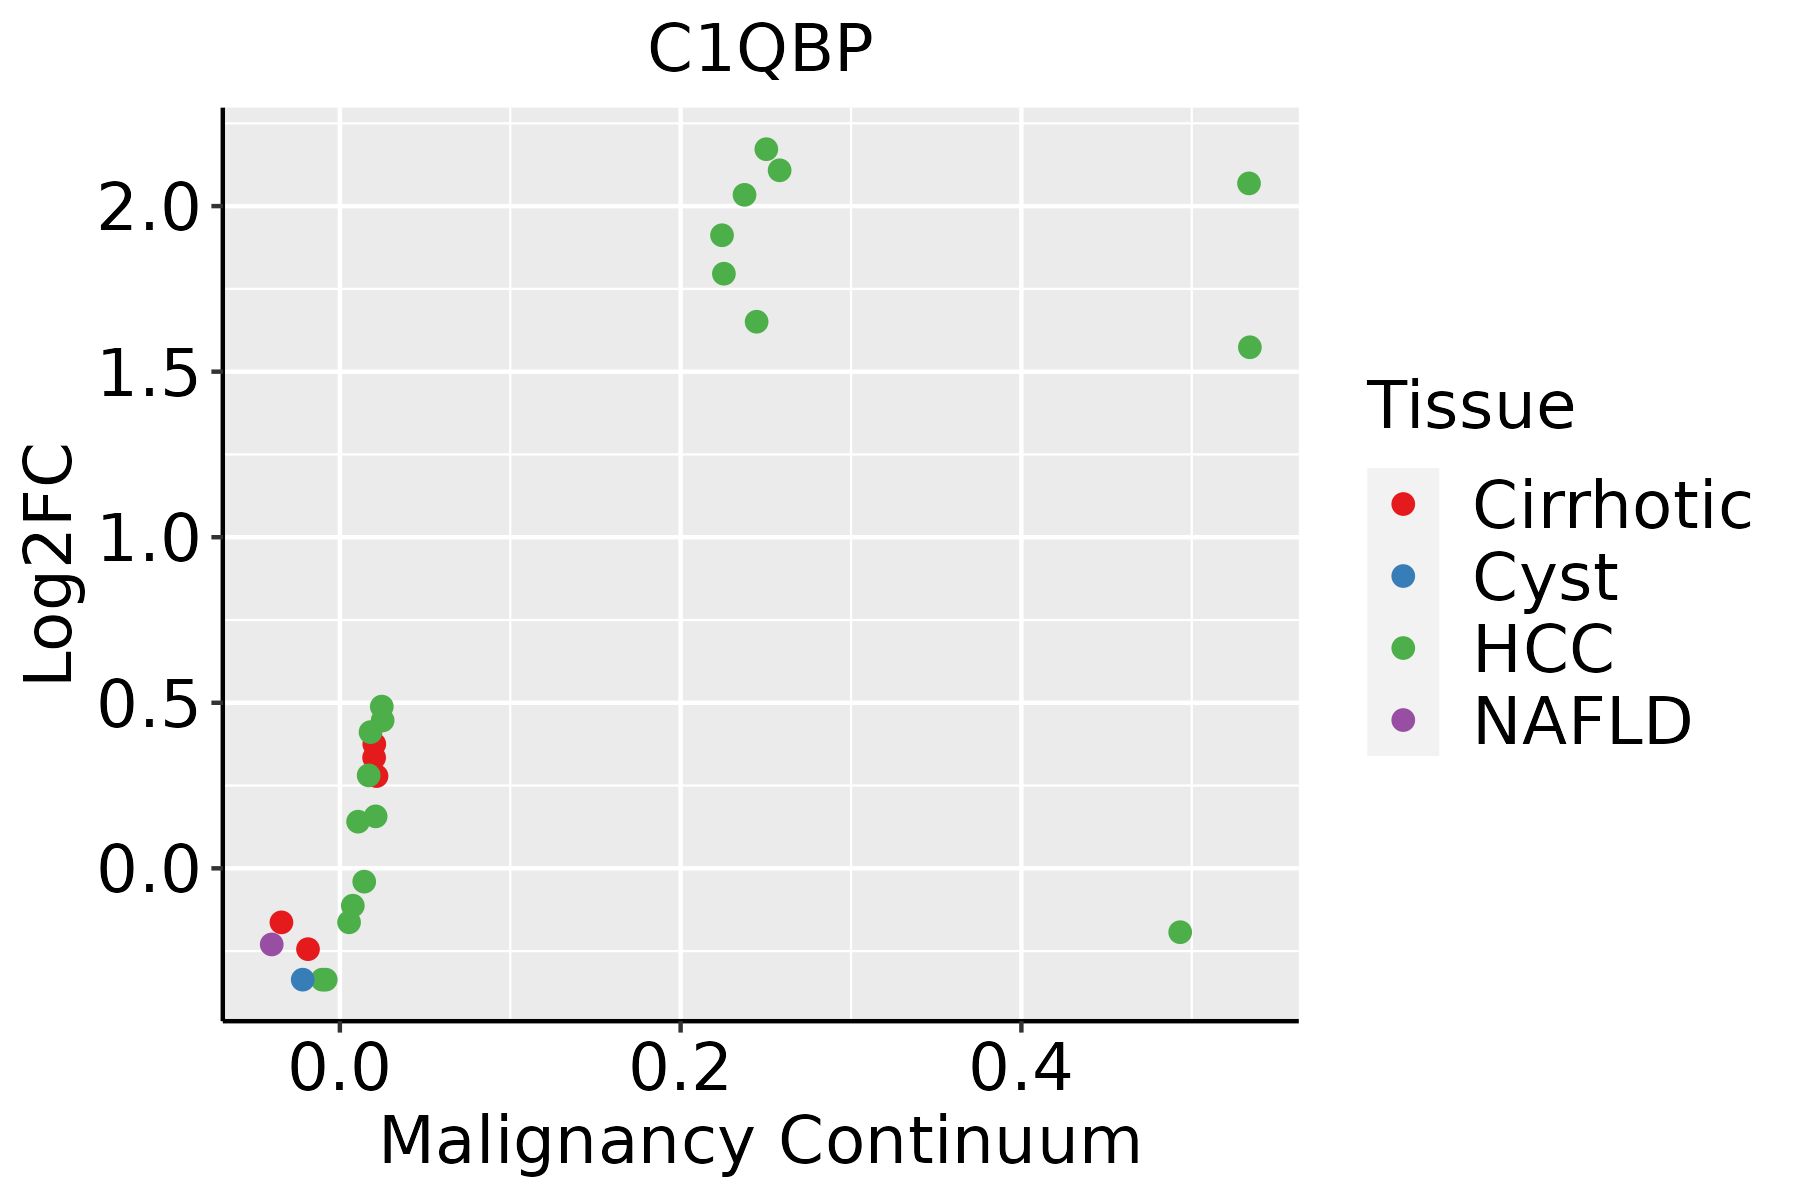 | HCC: Hepatocellular carcinoma |
| NAFLD: Non-alcoholic fatty liver disease |
| Oral Cavity |  | EOLP: Erosive Oral lichen planus |
| LP: leukoplakia |
| NEOLP: Non-erosive oral lichen planus |
| OSCC: Oral squamous cell carcinoma |
| Prostate |  | BPH: Benign Prostatic Hyperplasia |
| Skin | 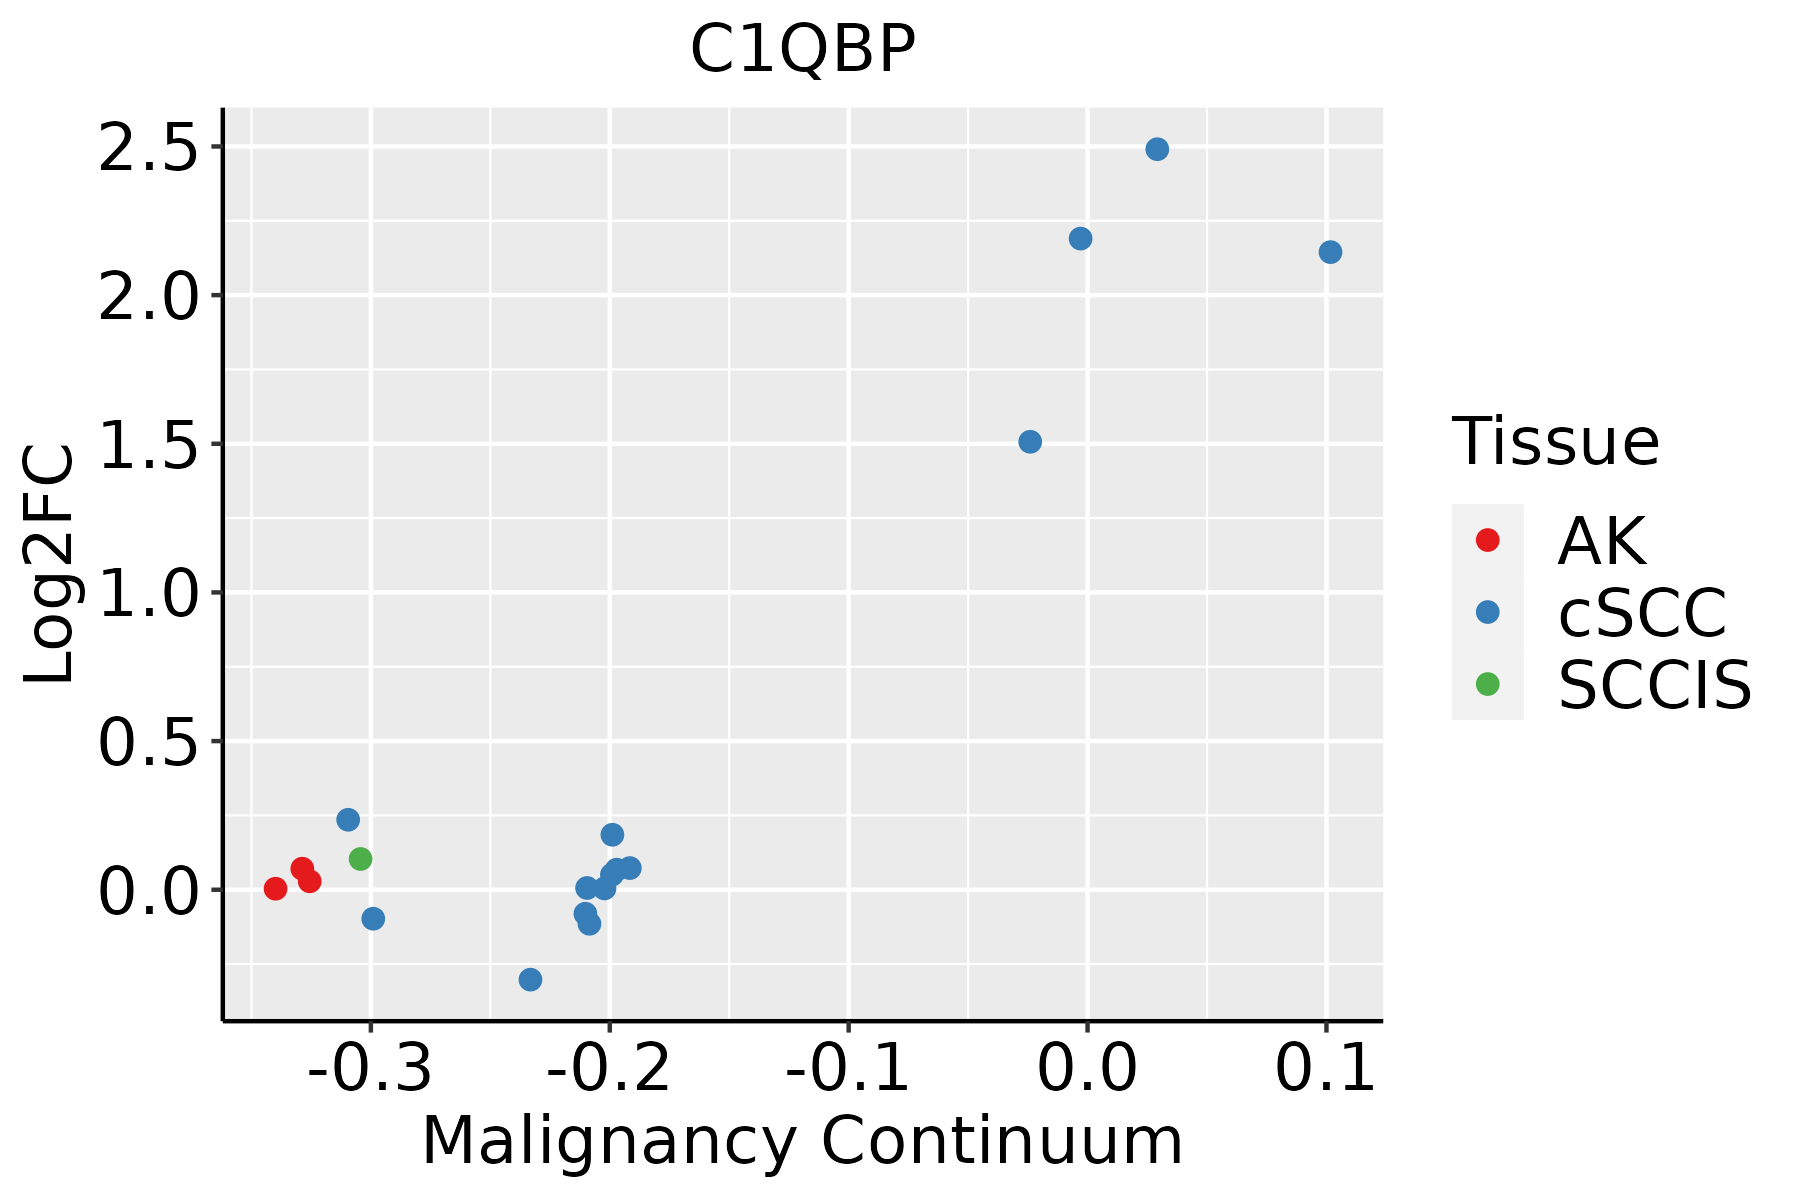 | AK: Actinic keratosis |
| cSCC: Cutaneous squamous cell carcinoma |
| SCCIS:squamous cell carcinoma in situ |
| Thyroid | 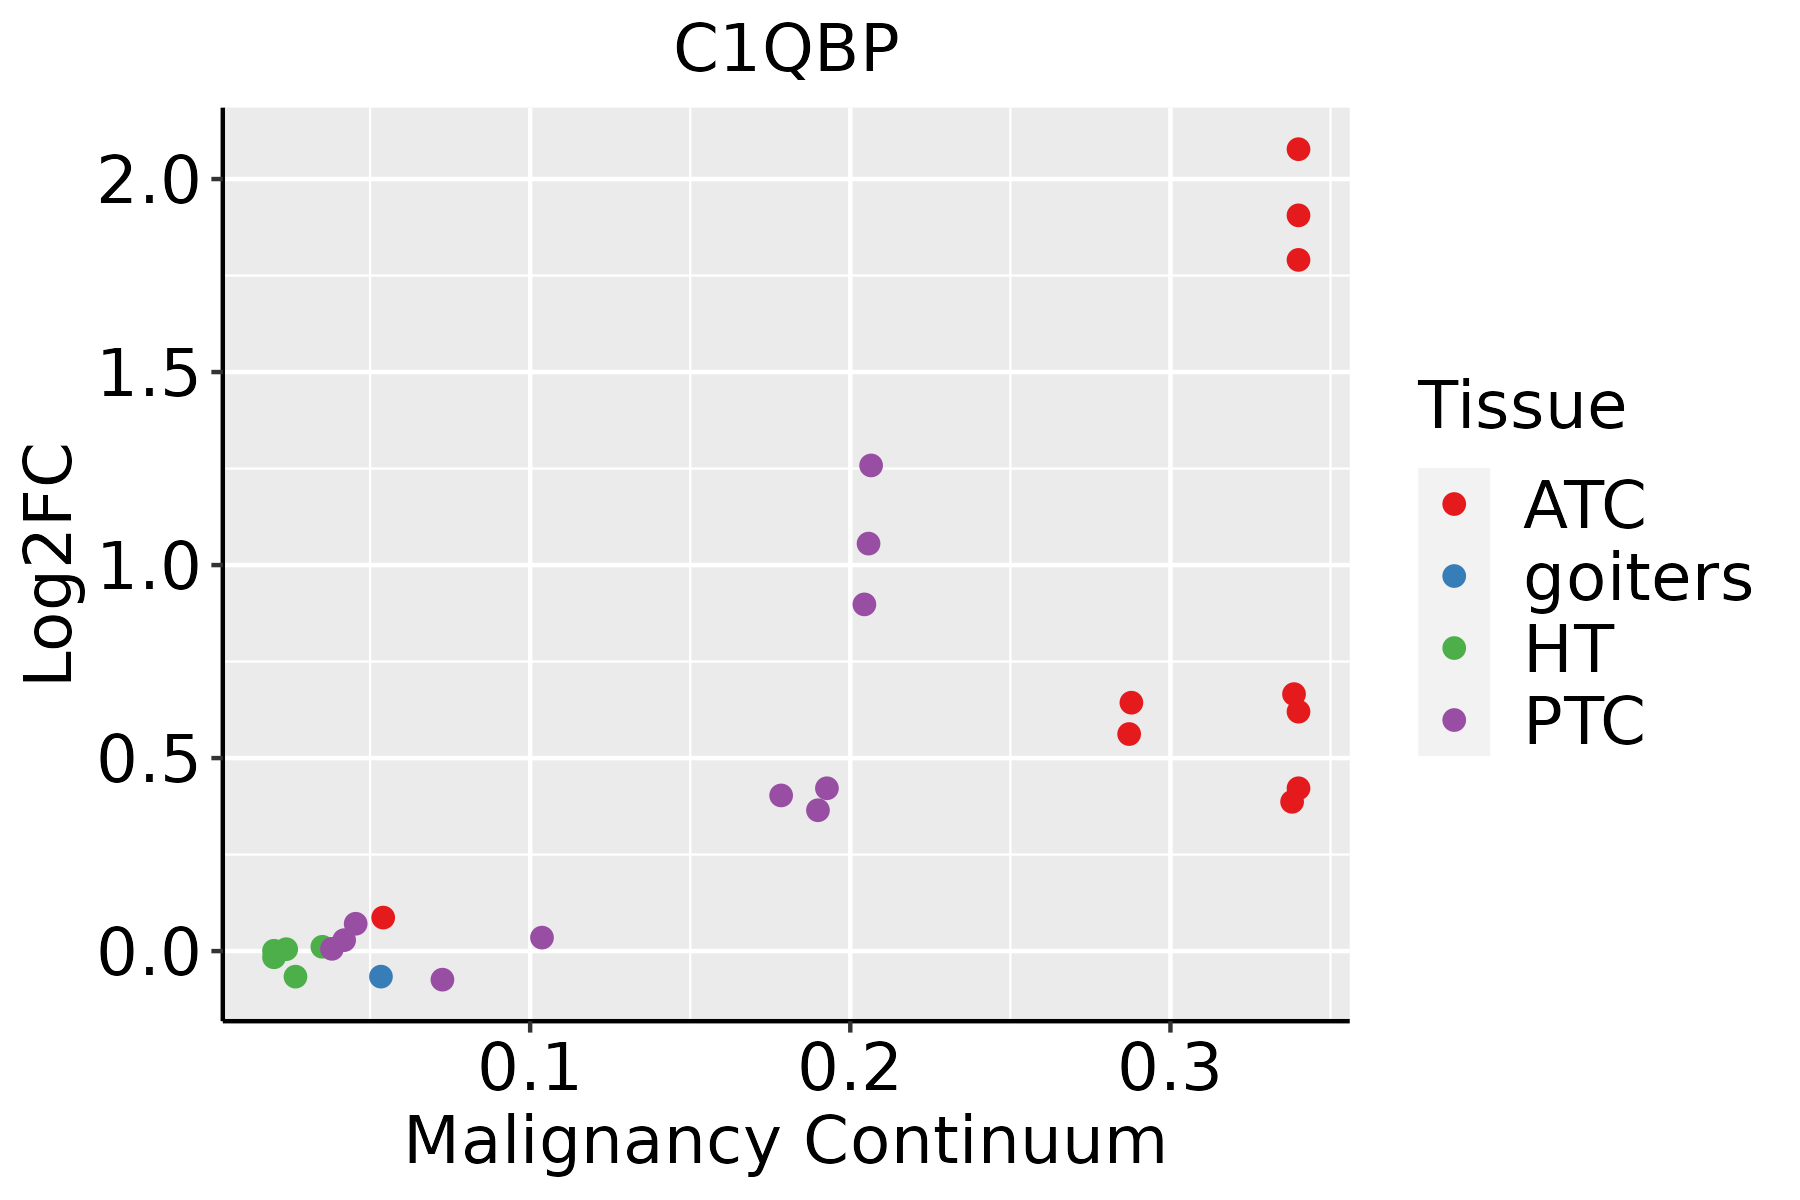 | ATC: Anaplastic thyroid cancer |
| HT: Hashimoto's thyroiditis |
| PTC: Papillary thyroid cancer |
| GO ID | Tissue | Disease Stage | Description | Gene Ratio | Bg Ratio | pvalue | p.adjust | Count |
| GO:0050777 | Liver | HCC | negative regulation of immune response | 101/7958 | 194/18723 | 4.40e-03 | 1.90e-02 | 101 |
| GO:00075651 | Liver | HCC | female pregnancy | 99/7958 | 193/18723 | 8.24e-03 | 3.23e-02 | 99 |
| GO:0039530 | Liver | HCC | MDA-5 signaling pathway | 9/7958 | 11/18723 | 9.51e-03 | 3.60e-02 | 9 |
| GO:0039532 | Liver | HCC | negative regulation of viral-induced cytoplasmic pattern recognition receptor signaling pathway | 9/7958 | 11/18723 | 9.51e-03 | 3.60e-02 | 9 |
| GO:000166721 | Liver | HCC | ameboidal-type cell migration | 226/7958 | 475/18723 | 1.35e-02 | 4.81e-02 | 226 |
| GO:002261320 | Oral cavity | OSCC | ribonucleoprotein complex biogenesis | 333/7305 | 463/18723 | 8.28e-48 | 5.24e-44 | 333 |
| GO:000838020 | Oral cavity | OSCC | RNA splicing | 308/7305 | 434/18723 | 2.43e-42 | 7.70e-39 | 308 |
| GO:004225420 | Oral cavity | OSCC | ribosome biogenesis | 230/7305 | 299/18723 | 3.22e-41 | 6.80e-38 | 230 |
| GO:000037519 | Oral cavity | OSCC | RNA splicing, via transesterification reactions | 225/7305 | 324/18723 | 5.20e-29 | 2.99e-26 | 225 |
| GO:000037719 | Oral cavity | OSCC | RNA splicing, via transesterification reactions with bulged adenosine as nucleophile | 221/7305 | 320/18723 | 5.50e-28 | 2.18e-25 | 221 |
| GO:000039819 | Oral cavity | OSCC | mRNA splicing, via spliceosome | 221/7305 | 320/18723 | 5.50e-28 | 2.18e-25 | 221 |
| GO:190331118 | Oral cavity | OSCC | regulation of mRNA metabolic process | 197/7305 | 288/18723 | 2.83e-24 | 7.16e-22 | 197 |
| GO:005068417 | Oral cavity | OSCC | regulation of mRNA processing | 104/7305 | 137/18723 | 1.32e-18 | 1.58e-16 | 104 |
| GO:000641720 | Oral cavity | OSCC | regulation of translation | 274/7305 | 468/18723 | 4.39e-18 | 4.63e-16 | 274 |
| GO:004348420 | Oral cavity | OSCC | regulation of RNA splicing | 108/7305 | 148/18723 | 4.25e-17 | 3.69e-15 | 108 |
| GO:004572719 | Oral cavity | OSCC | positive regulation of translation | 101/7305 | 136/18723 | 5.85e-17 | 4.94e-15 | 101 |
| GO:003425019 | Oral cavity | OSCC | positive regulation of cellular amide metabolic process | 115/7305 | 162/18723 | 1.28e-16 | 1.05e-14 | 115 |
| GO:000961515 | Oral cavity | OSCC | response to virus | 215/7305 | 367/18723 | 1.63e-14 | 9.41e-13 | 215 |
| GO:01400533 | Oral cavity | OSCC | mitochondrial gene expression | 78/7305 | 108/18723 | 2.37e-12 | 9.86e-11 | 78 |
| GO:004802420 | Oral cavity | OSCC | regulation of mRNA splicing, via spliceosome | 74/7305 | 101/18723 | 2.66e-12 | 1.09e-10 | 74 |
| Hugo Symbol | Variant Class | Variant Classification | dbSNP RS | HGVSc | HGVSp | HGVSp Short | SWISSPROT | BIOTYPE | SIFT | PolyPhen | Tumor Sample Barcode | Tissue | Histology | Sex | Age | Stage | Therapy Types | Drugs | Outcome |
| C1QBP | SNV | Missense_Mutation | novel | c.529N>C | p.Asp177His | p.D177H | Q07021 | protein_coding | tolerated(0.13) | possibly_damaging(0.807) | TCGA-HM-A4S6-01 | Cervix | cervical & endocervical cancer | Female | <65 | III/IV | Chemotherapy | cisplatin | CR |
| C1QBP | SNV | Missense_Mutation | | c.352N>A | p.Ala118Thr | p.A118T | Q07021 | protein_coding | deleterious(0.04) | possibly_damaging(0.601) | TCGA-QG-A5Z2-01 | Colorectum | colon adenocarcinoma | Male | <65 | I/II | Unknown | Unknown | SD |
| C1QBP | SNV | Missense_Mutation | novel | c.304N>A | p.Leu102Ile | p.L102I | Q07021 | protein_coding | tolerated(0.22) | possibly_damaging(0.562) | TCGA-A5-A0G2-01 | Endometrium | uterine corpus endometrioid carcinoma | Female | <65 | III/IV | Unknown | Unknown | SD |
| C1QBP | SNV | Missense_Mutation | novel | c.814N>A | p.Leu272Ile | p.L272I | Q07021 | protein_coding | deleterious(0) | probably_damaging(0.999) | TCGA-A5-A2K5-01 | Endometrium | uterine corpus endometrioid carcinoma | Female | >=65 | I/II | Unknown | Unknown | SD |
| C1QBP | SNV | Missense_Mutation | | c.245N>C | p.Phe82Ser | p.F82S | Q07021 | protein_coding | deleterious(0) | possibly_damaging(0.764) | TCGA-AP-A059-01 | Endometrium | uterine corpus endometrioid carcinoma | Female | >=65 | I/II | Unknown | Unknown | SD |
| C1QBP | SNV | Missense_Mutation | rs115819590 | c.643N>A | p.Gly215Ser | p.G215S | Q07021 | protein_coding | tolerated_low_confidence(0.09) | benign(0.107) | TCGA-AP-A1DK-01 | Endometrium | uterine corpus endometrioid carcinoma | Female | <65 | I/II | Unknown | Unknown | SD |
| C1QBP | SNV | Missense_Mutation | novel | c.751A>G | p.Thr251Ala | p.T251A | Q07021 | protein_coding | tolerated(0.1) | possibly_damaging(0.559) | TCGA-D1-A175-01 | Endometrium | uterine corpus endometrioid carcinoma | Female | <65 | I/II | Chemotherapy | paclitaxel | SD |
| C1QBP | SNV | Missense_Mutation | novel | c.677N>C | p.Leu226Pro | p.L226P | Q07021 | protein_coding | deleterious(0) | probably_damaging(0.988) | TCGA-E6-A1LX-01 | Endometrium | uterine corpus endometrioid carcinoma | Female | <65 | I/II | Unknown | Unknown | SD |
| C1QBP | SNV | Missense_Mutation | novel | c.296N>G | p.His99Arg | p.H99R | Q07021 | protein_coding | tolerated(0.38) | benign(0.055) | TCGA-FI-A2D5-01 | Endometrium | uterine corpus endometrioid carcinoma | Female | <65 | III/IV | Chemotherapy | carboplatinum | PD |
| C1QBP | SNV | Missense_Mutation | | c.481N>A | p.Glu161Lys | p.E161K | Q07021 | protein_coding | deleterious(0.02) | possibly_damaging(0.684) | TCGA-18-5595-01 | Lung | lung squamous cell carcinoma | Male | <65 | I/II | Unknown | Unknown | SD |


