| Tissue | Expression Dynamics | Abbreviation |
| Breast |  | IDC: Invasive ductal carcinoma |
| DCIS: Ductal carcinoma in situ |
| Precancer(BRCA1-mut): Precancerous lesion from BRCA1 mutation carriers |
| Colorectum (GSE201348) |  | FAP: Familial adenomatous polyposis |
| CRC: Colorectal cancer |
| Colorectum (HTA11) |  | AD: Adenomas |
| SER: Sessile serrated lesions |
| MSI-H: Microsatellite-high colorectal cancer |
| MSS: Microsatellite stable colorectal cancer |
| Endometrium | 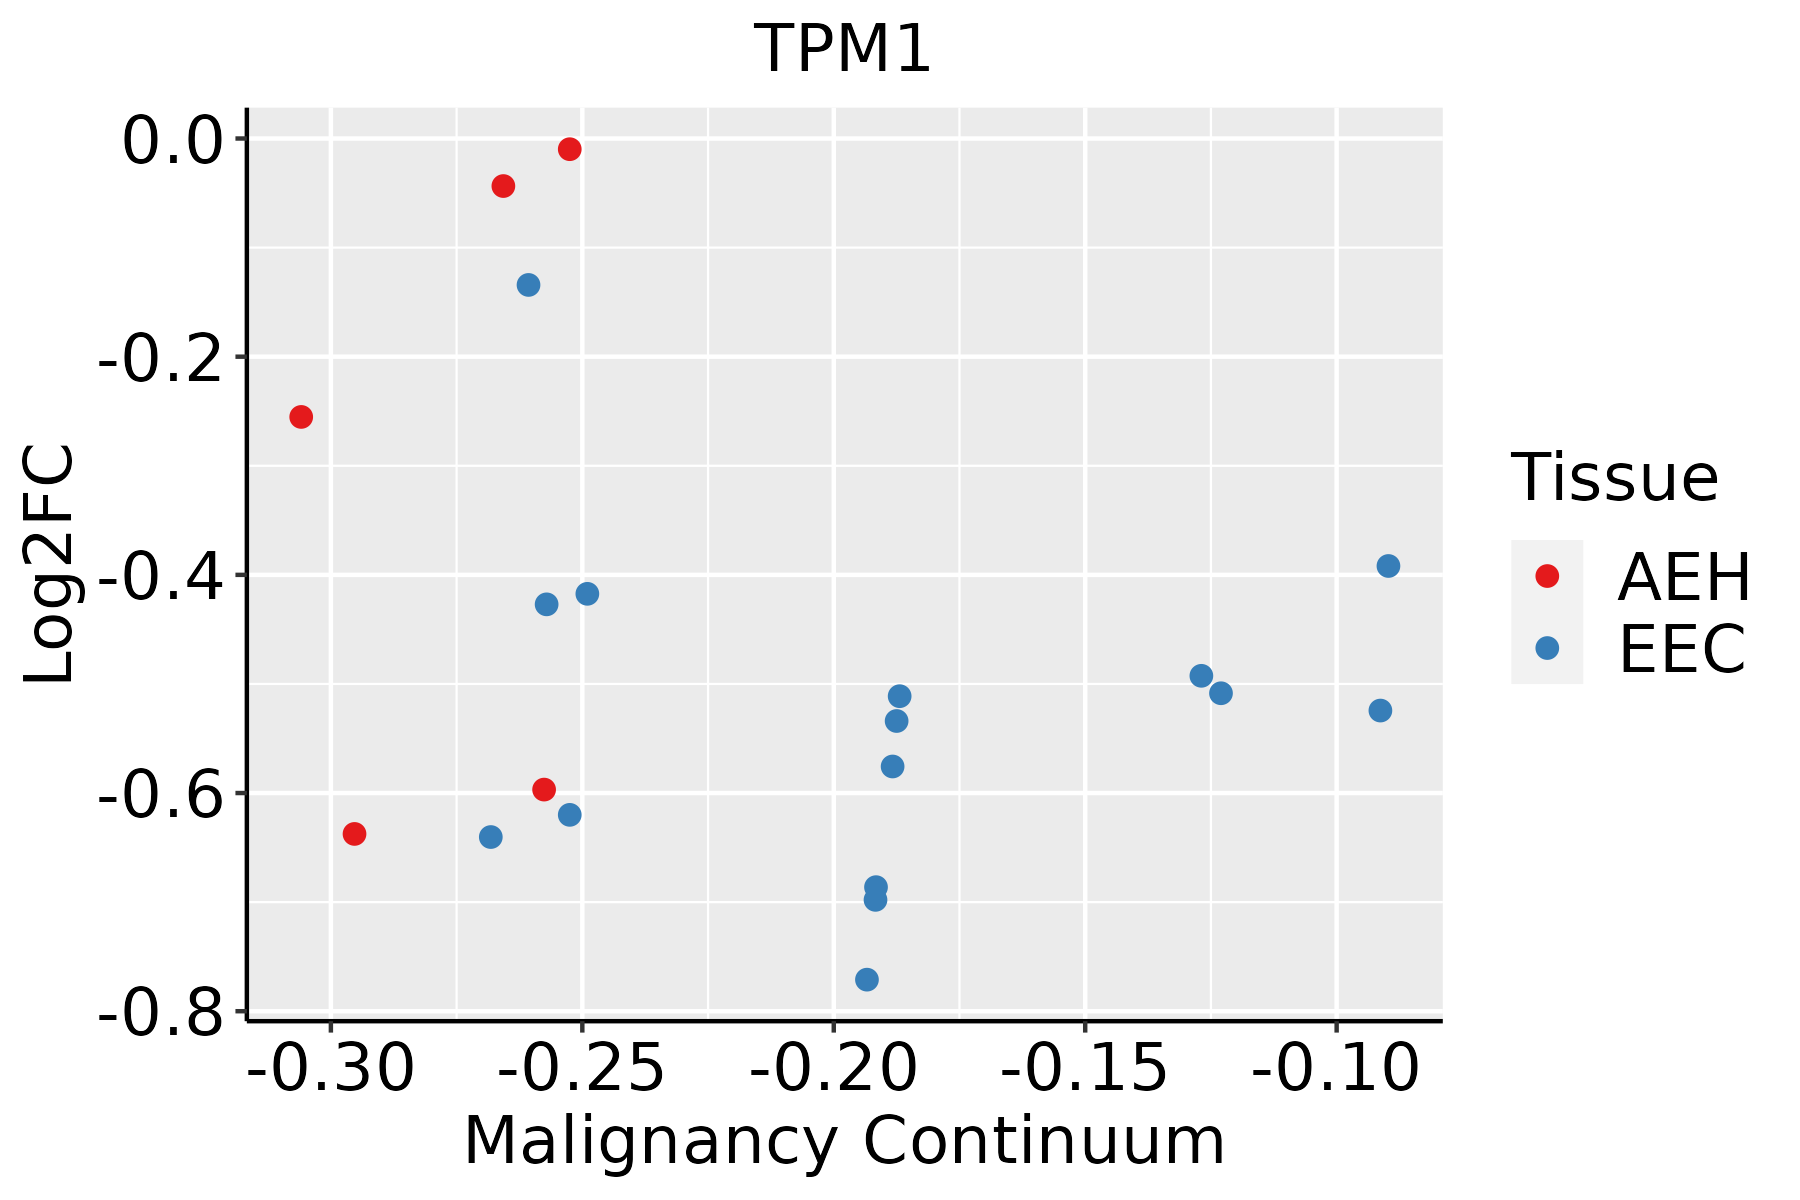 | AEH: Atypical endometrial hyperplasia |
| EEC: Endometrioid Cancer |
| Esophagus | 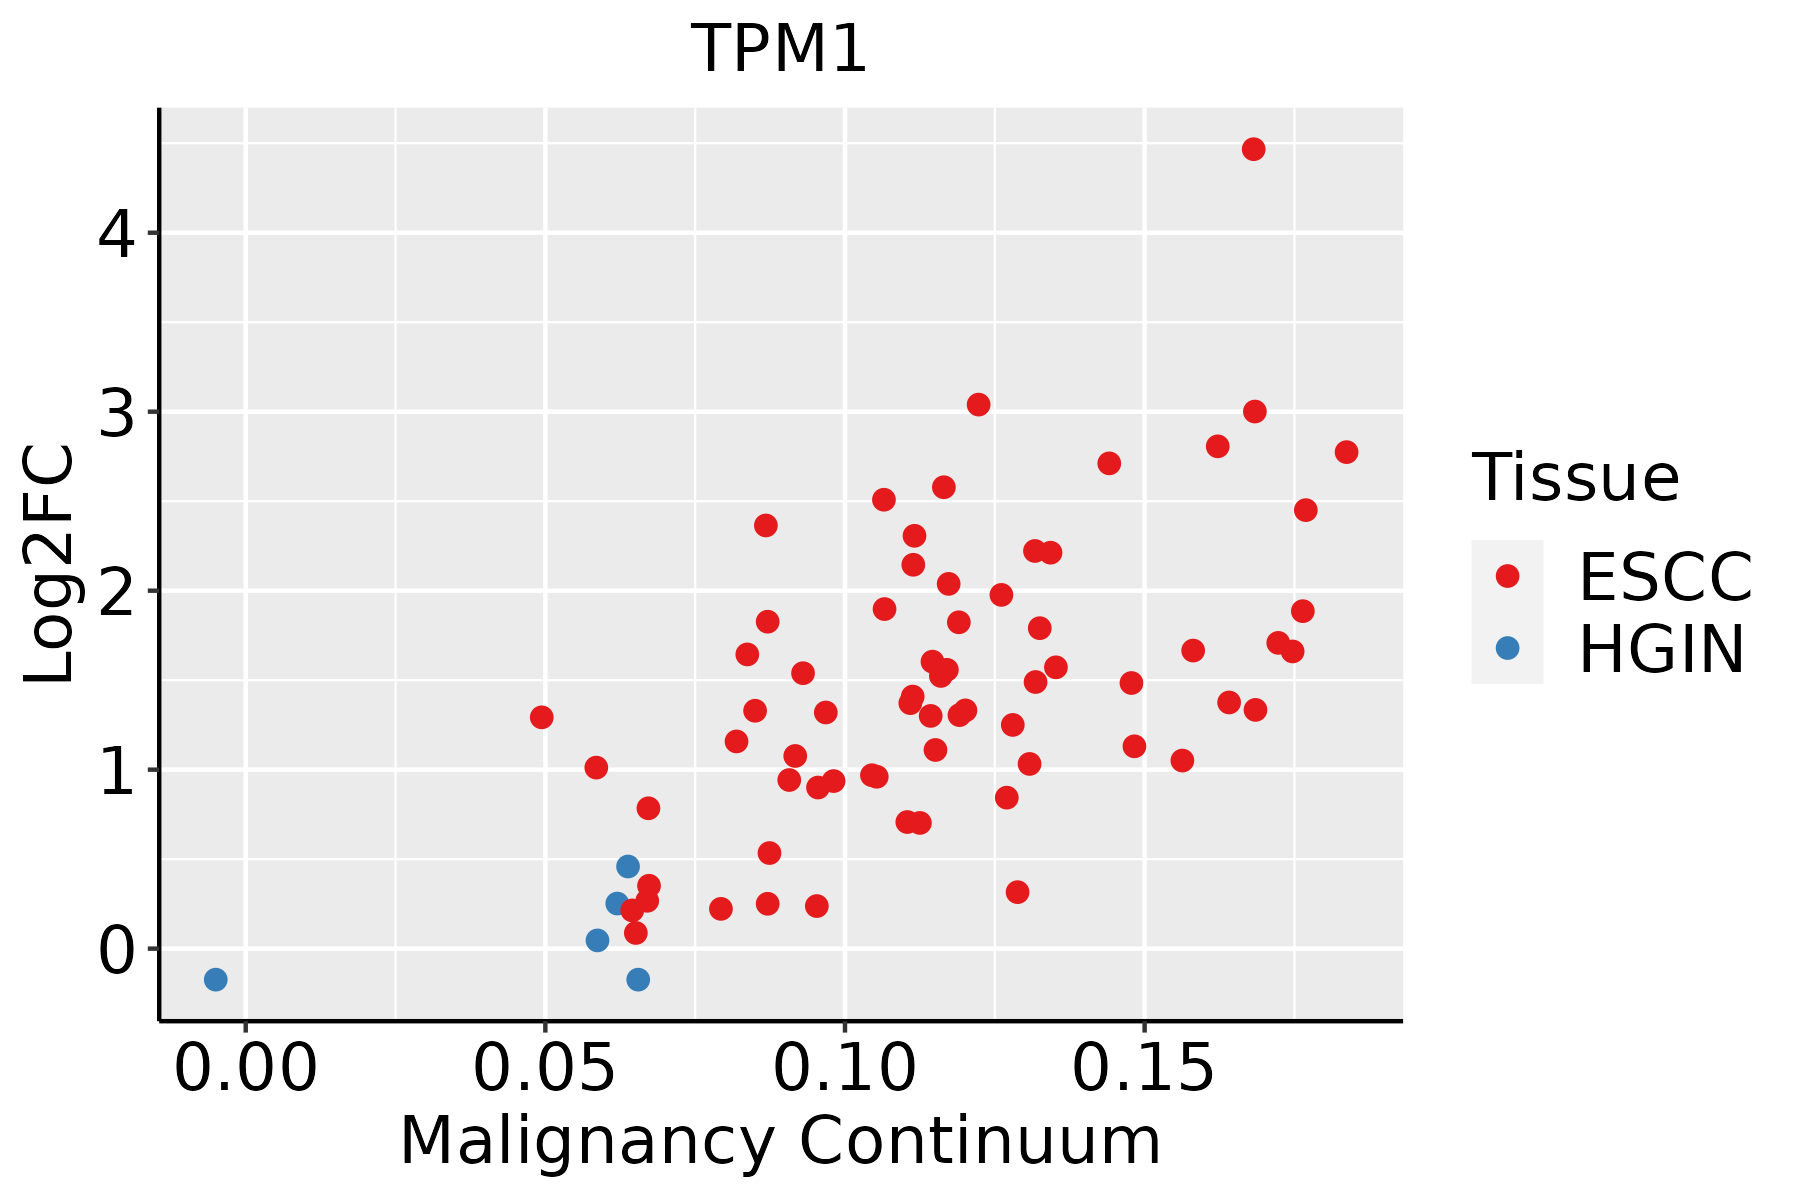 | ESCC: Esophageal squamous cell carcinoma |
| HGIN: High-grade intraepithelial neoplasias |
| LGIN: Low-grade intraepithelial neoplasias |
| GC | 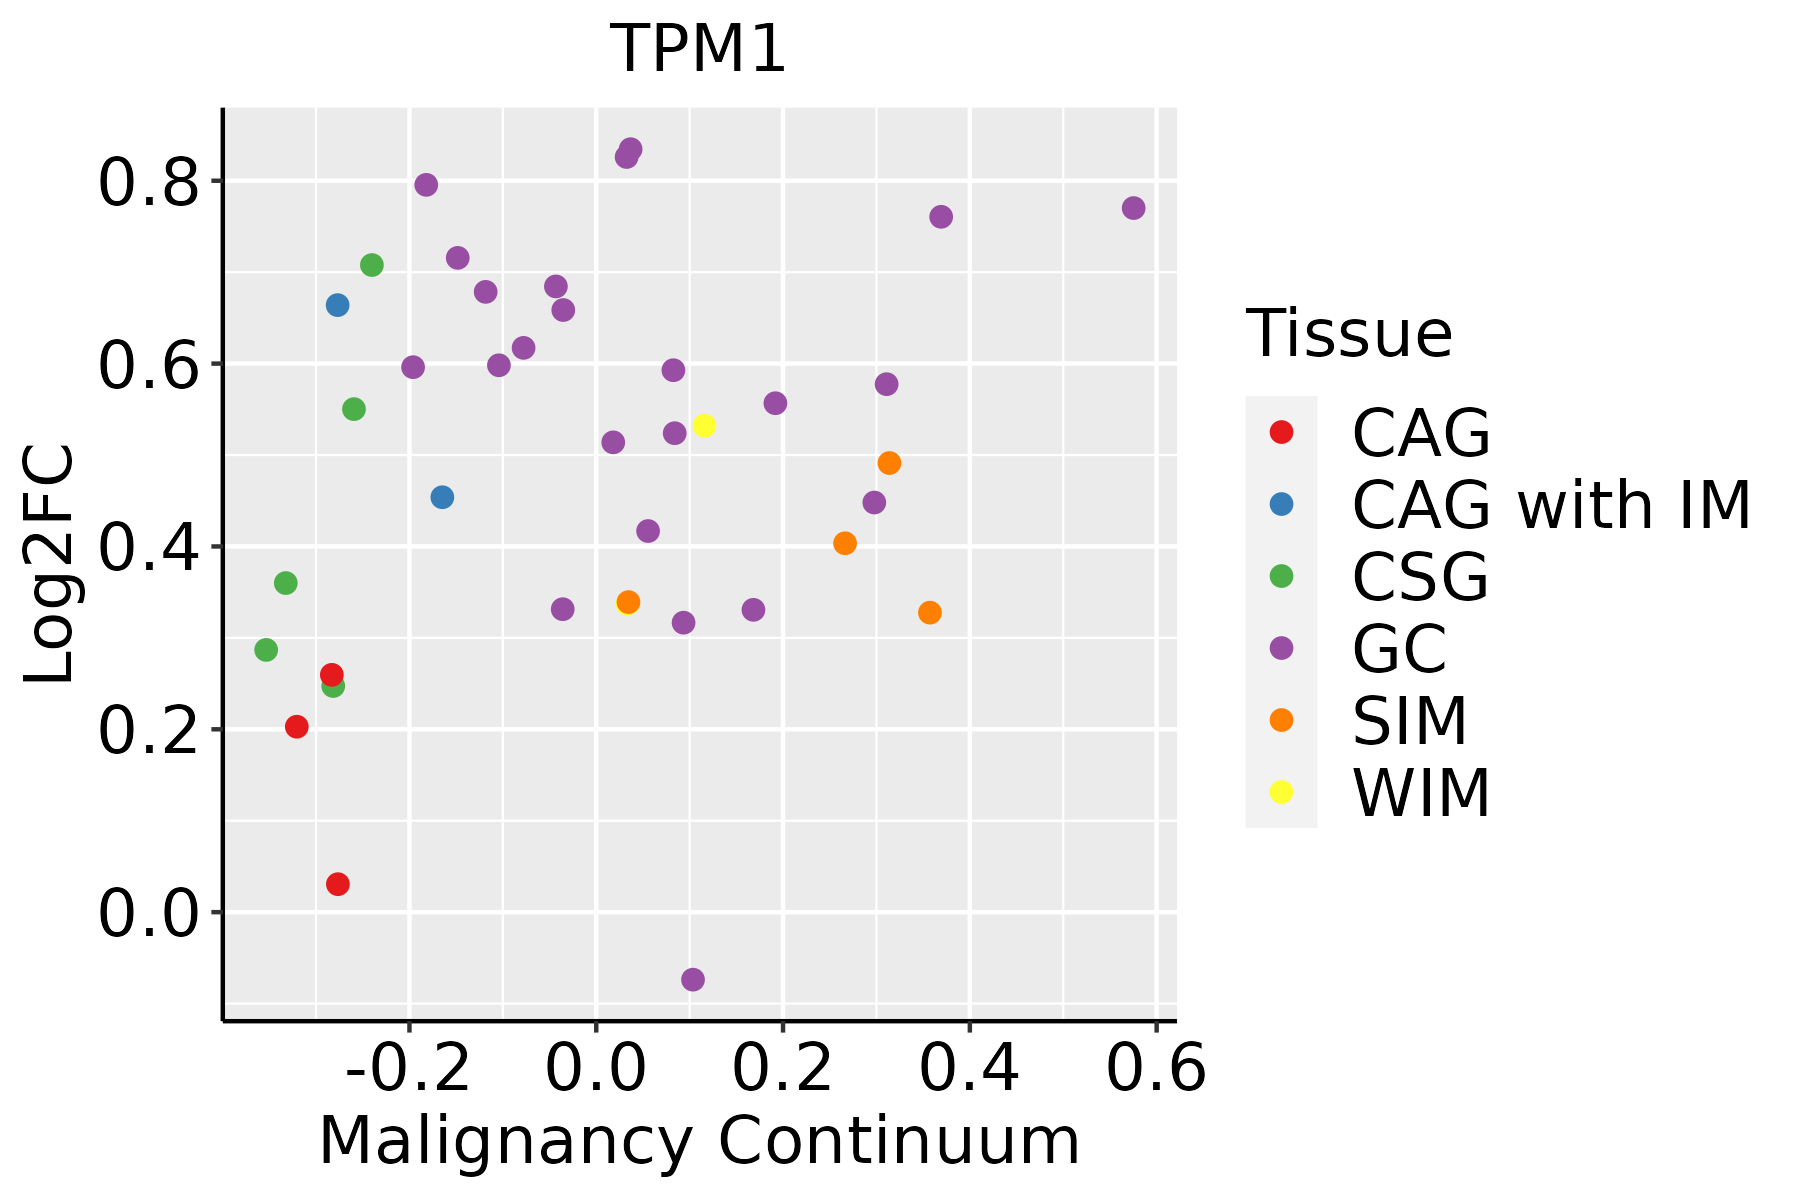 | CAG: Chronic atrophic gastritis |
| CAG with IM: Chronic atrophic gastritis with intestinal metaplasia |
| CSG: Chronic superficial gastritis |
| GC: Gastric cancer |
| SIM: Severe intestinal metaplasia |
| WIM: Wild intestinal metaplasia |
| Liver |  | HCC: Hepatocellular carcinoma |
| NAFLD: Non-alcoholic fatty liver disease |
| Lung | 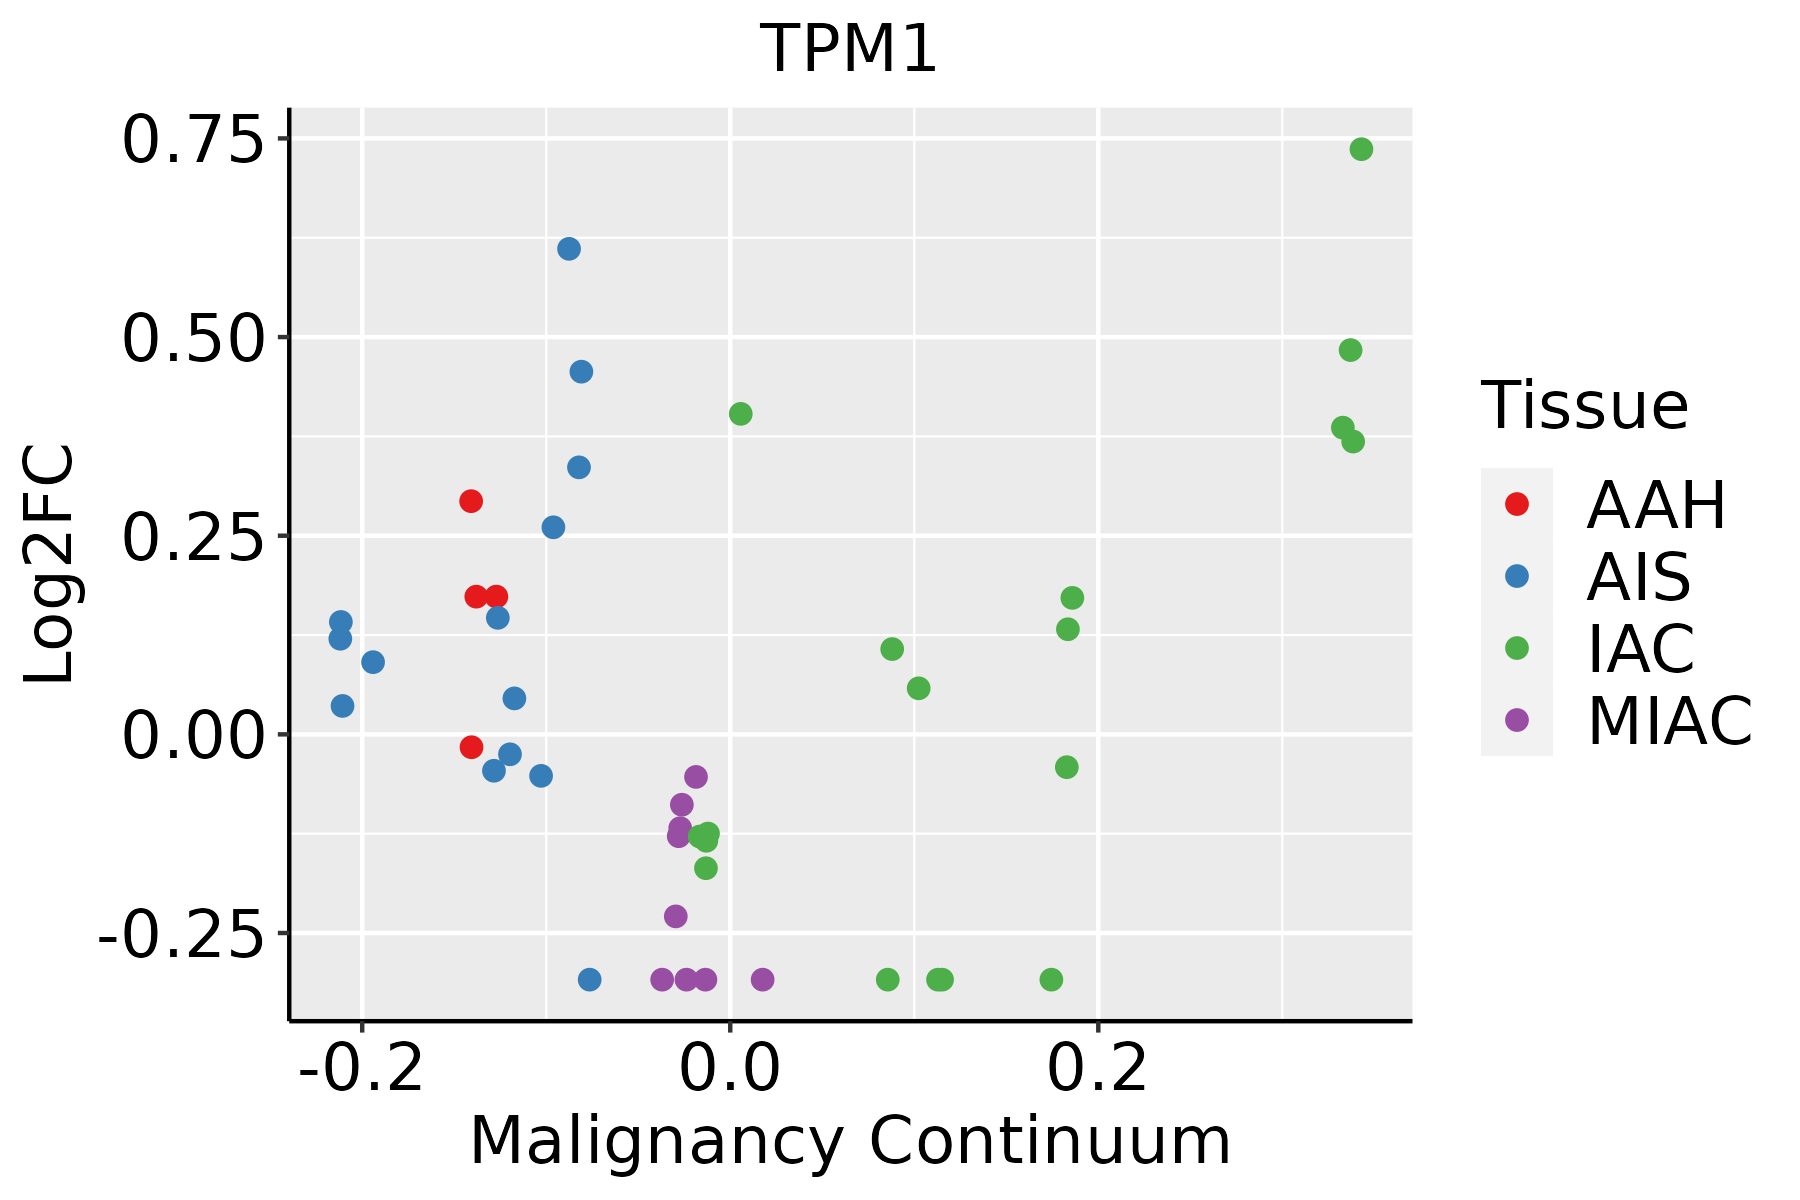 | AAH: Atypical adenomatous hyperplasia |
| AIS: Adenocarcinoma in situ |
| IAC: Invasive lung adenocarcinoma |
| MIA: Minimally invasive adenocarcinoma |
| Oral Cavity | 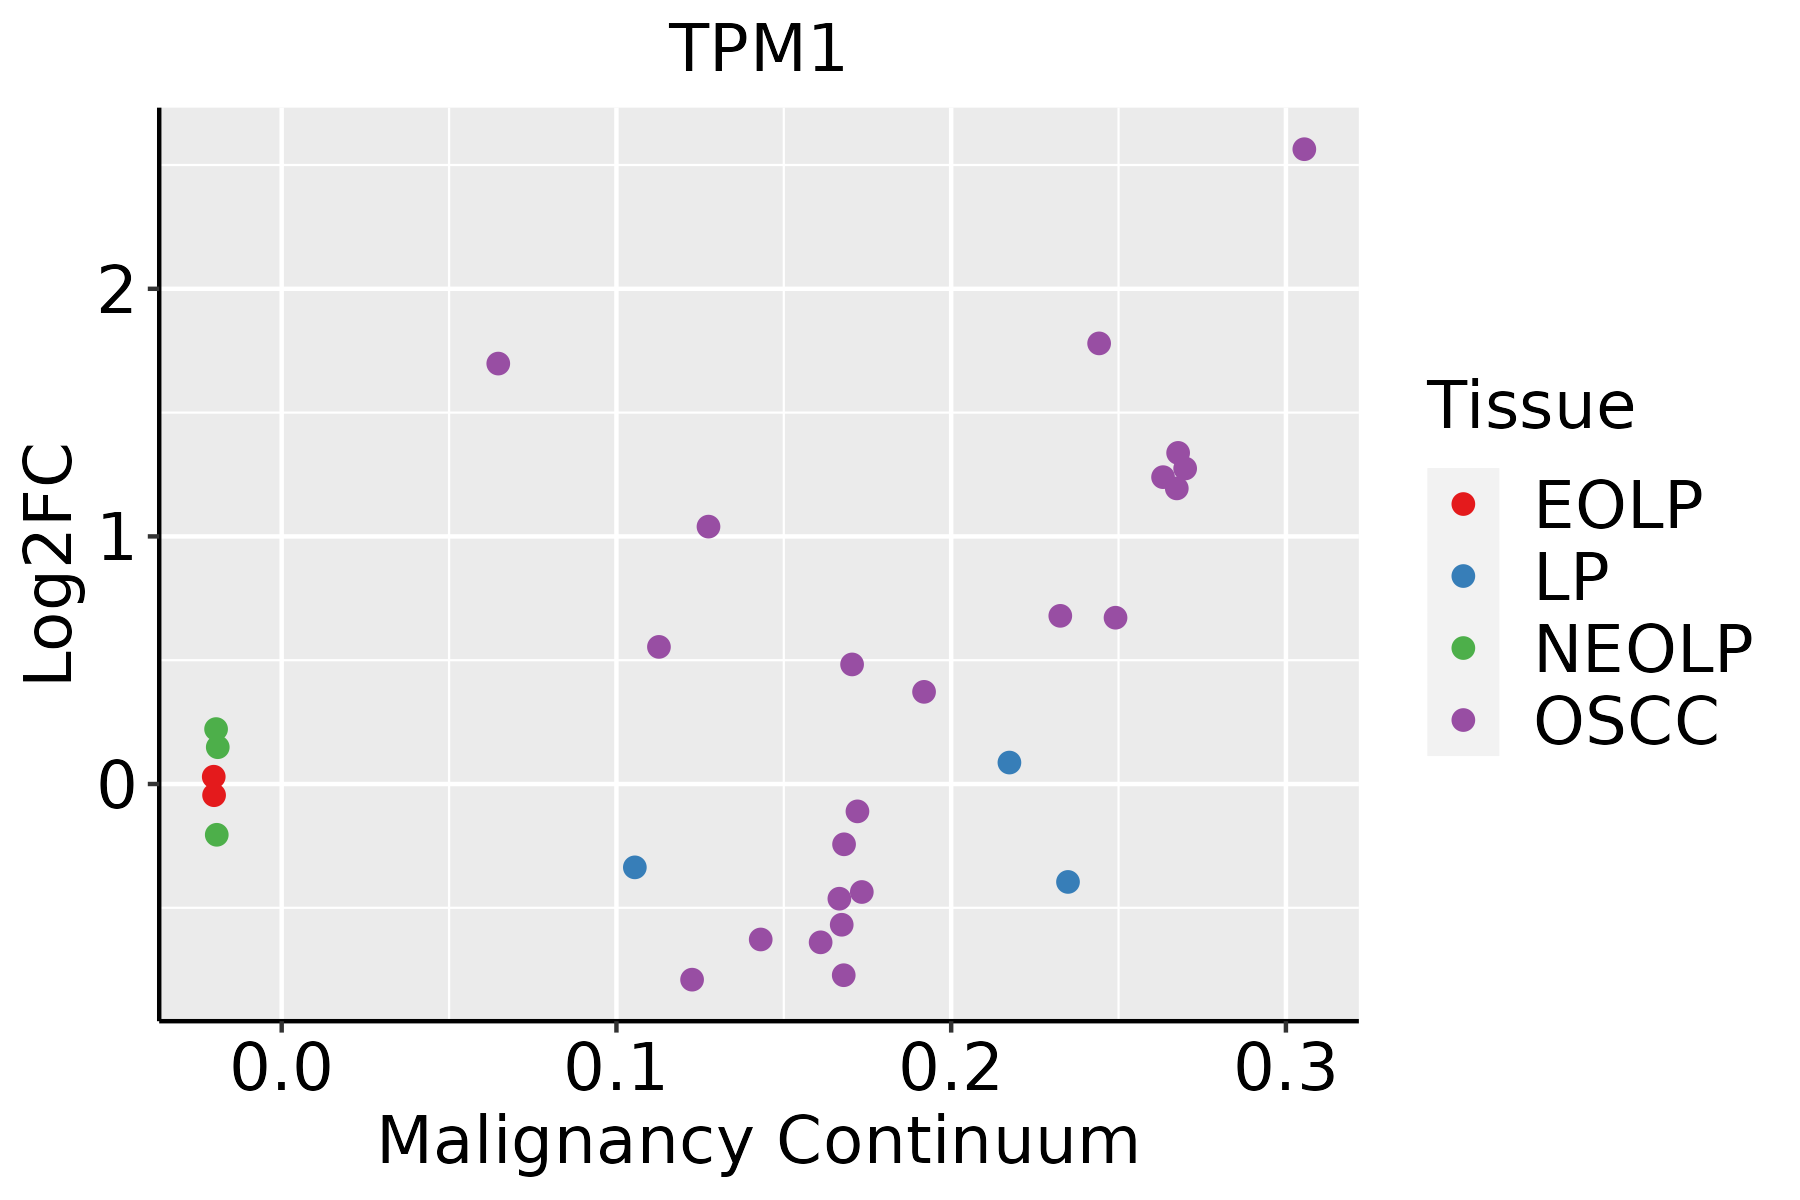 | EOLP: Erosive Oral lichen planus |
| LP: leukoplakia |
| NEOLP: Non-erosive oral lichen planus |
| OSCC: Oral squamous cell carcinoma |
| Prostate | 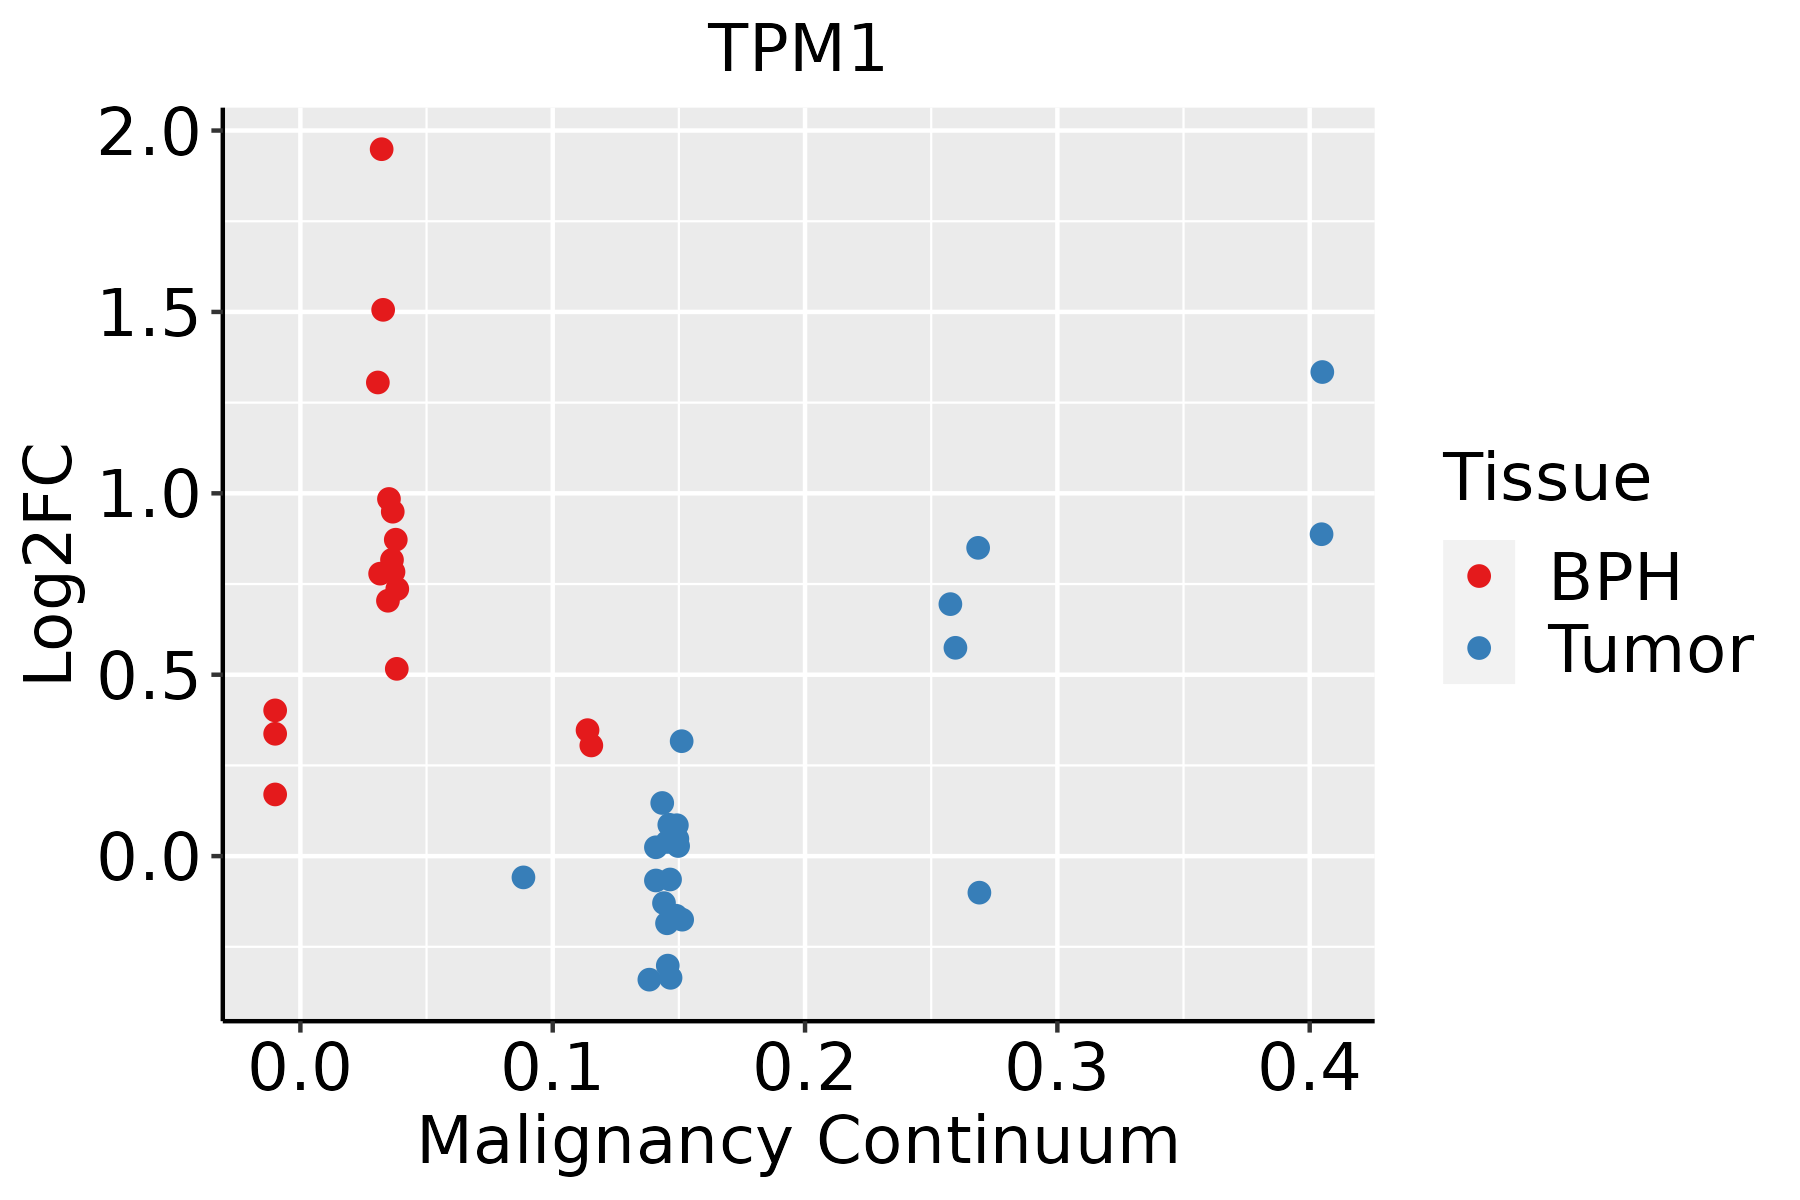 | BPH: Benign Prostatic Hyperplasia |
| Skin |  | AK: Actinic keratosis |
| cSCC: Cutaneous squamous cell carcinoma |
| SCCIS:squamous cell carcinoma in situ |
| Thyroid |  | ATC: Anaplastic thyroid cancer |
| HT: Hashimoto's thyroiditis |
| PTC: Papillary thyroid cancer |
| GO ID | Tissue | Disease Stage | Description | Gene Ratio | Bg Ratio | pvalue | p.adjust | Count |
| GO:003459913 | Lung | AIS | cellular response to oxidative stress | 49/1849 | 288/18723 | 1.10e-04 | 2.57e-03 | 49 |
| GO:003004812 | Lung | AIS | actin filament-based movement | 25/1849 | 127/18723 | 5.99e-04 | 9.14e-03 | 25 |
| GO:00426921 | Lung | AIS | muscle cell differentiation | 58/1849 | 384/18723 | 7.00e-04 | 1.03e-02 | 58 |
| GO:003152912 | Lung | AIS | ruffle organization | 14/1849 | 56/18723 | 8.61e-04 | 1.17e-02 | 14 |
| GO:00400131 | Lung | AIS | negative regulation of locomotion | 57/1849 | 391/18723 | 1.80e-03 | 2.03e-02 | 57 |
| GO:00605371 | Lung | AIS | muscle tissue development | 58/1849 | 403/18723 | 2.22e-03 | 2.37e-02 | 58 |
| GO:190290513 | Lung | AIS | positive regulation of supramolecular fiber organization | 34/1849 | 209/18723 | 2.50e-03 | 2.57e-02 | 34 |
| GO:00149091 | Lung | AIS | smooth muscle cell migration | 19/1849 | 97/18723 | 2.74e-03 | 2.75e-02 | 19 |
| GO:00512711 | Lung | AIS | negative regulation of cellular component movement | 53/1849 | 367/18723 | 3.11e-03 | 3.00e-02 | 53 |
| GO:20001461 | Lung | AIS | negative regulation of cell motility | 52/1849 | 359/18723 | 3.18e-03 | 3.05e-02 | 52 |
| GO:000301211 | Lung | AIS | muscle system process | 63/1849 | 452/18723 | 3.18e-03 | 3.05e-02 | 63 |
| GO:00303361 | Lung | AIS | negative regulation of cell migration | 50/1849 | 344/18723 | 3.51e-03 | 3.33e-02 | 50 |
| GO:000030213 | Lung | AIS | response to reactive oxygen species | 35/1849 | 222/18723 | 3.69e-03 | 3.46e-02 | 35 |
| GO:00109271 | Lung | AIS | cellular component assembly involved in morphogenesis | 20/1849 | 107/18723 | 3.79e-03 | 3.52e-02 | 20 |
| GO:00511461 | Lung | AIS | striated muscle cell differentiation | 42/1849 | 283/18723 | 4.88e-03 | 4.24e-02 | 42 |
| GO:0014812 | Lung | AIS | muscle cell migration | 20/1849 | 110/18723 | 5.24e-03 | 4.49e-02 | 20 |
| GO:00149101 | Lung | AIS | regulation of smooth muscle cell migration | 17/1849 | 89/18723 | 5.80e-03 | 4.83e-02 | 17 |
| GO:000697920 | Oral cavity | OSCC | response to oxidative stress | 273/7305 | 446/18723 | 8.35e-22 | 1.65e-19 | 273 |
| GO:006219720 | Oral cavity | OSCC | cellular response to chemical stress | 204/7305 | 337/18723 | 6.89e-16 | 5.19e-14 | 204 |
| GO:000030220 | Oral cavity | OSCC | response to reactive oxygen species | 143/7305 | 222/18723 | 1.32e-14 | 7.88e-13 | 143 |
| Pathway ID | Tissue | Disease Stage | Description | Gene Ratio | Bg Ratio | pvalue | p.adjust | qvalue | Count |
| hsa0426022 | Breast | IDC | Cardiac muscle contraction | 23/867 | 87/8465 | 1.39e-05 | 1.61e-04 | 1.21e-04 | 23 |
| hsa0426032 | Breast | IDC | Cardiac muscle contraction | 23/867 | 87/8465 | 1.39e-05 | 1.61e-04 | 1.21e-04 | 23 |
| hsa0426042 | Breast | DCIS | Cardiac muscle contraction | 22/846 | 87/8465 | 3.08e-05 | 3.43e-04 | 2.53e-04 | 22 |
| hsa0426052 | Breast | DCIS | Cardiac muscle contraction | 22/846 | 87/8465 | 3.08e-05 | 3.43e-04 | 2.53e-04 | 22 |
| hsa04260 | Colorectum | AD | Cardiac muscle contraction | 32/2092 | 87/8465 | 7.92e-03 | 3.13e-02 | 2.00e-02 | 32 |
| hsa042601 | Colorectum | AD | Cardiac muscle contraction | 32/2092 | 87/8465 | 7.92e-03 | 3.13e-02 | 2.00e-02 | 32 |
| hsa042602 | Colorectum | SER | Cardiac muscle contraction | 31/1580 | 87/8465 | 1.30e-04 | 1.30e-03 | 9.47e-04 | 31 |
| hsa042603 | Colorectum | SER | Cardiac muscle contraction | 31/1580 | 87/8465 | 1.30e-04 | 1.30e-03 | 9.47e-04 | 31 |
| hsa042604 | Colorectum | MSS | Cardiac muscle contraction | 31/1875 | 87/8465 | 2.73e-03 | 1.32e-02 | 8.12e-03 | 31 |
| hsa042605 | Colorectum | MSS | Cardiac muscle contraction | 31/1875 | 87/8465 | 2.73e-03 | 1.32e-02 | 8.12e-03 | 31 |
| hsa04261 | Colorectum | FAP | Adrenergic signaling in cardiomyocytes | 38/1404 | 154/8465 | 6.16e-03 | 2.34e-02 | 1.42e-02 | 38 |
| hsa042608 | Colorectum | FAP | Cardiac muscle contraction | 24/1404 | 87/8465 | 6.49e-03 | 2.43e-02 | 1.48e-02 | 24 |
| hsa042611 | Colorectum | FAP | Adrenergic signaling in cardiomyocytes | 38/1404 | 154/8465 | 6.16e-03 | 2.34e-02 | 1.42e-02 | 38 |
| hsa042609 | Colorectum | FAP | Cardiac muscle contraction | 24/1404 | 87/8465 | 6.49e-03 | 2.43e-02 | 1.48e-02 | 24 |
| hsa0426020 | Endometrium | AEH | Cardiac muscle contraction | 27/1197 | 87/8465 | 3.93e-05 | 3.99e-04 | 2.92e-04 | 27 |
| hsa048144 | Endometrium | AEH | Motor proteins | 42/1197 | 193/8465 | 2.41e-03 | 1.42e-02 | 1.04e-02 | 42 |
| hsa04260110 | Endometrium | AEH | Cardiac muscle contraction | 27/1197 | 87/8465 | 3.93e-05 | 3.99e-04 | 2.92e-04 | 27 |
| hsa0481411 | Endometrium | AEH | Motor proteins | 42/1197 | 193/8465 | 2.41e-03 | 1.42e-02 | 1.04e-02 | 42 |
| hsa0426023 | Endometrium | EEC | Cardiac muscle contraction | 28/1237 | 87/8465 | 2.49e-05 | 2.73e-04 | 2.03e-04 | 28 |
| hsa048142 | Endometrium | EEC | Motor proteins | 42/1237 | 193/8465 | 4.43e-03 | 2.39e-02 | 1.78e-02 | 42 |
| Hugo Symbol | Variant Class | Variant Classification | dbSNP RS | HGVSc | HGVSp | HGVSp Short | SWISSPROT | BIOTYPE | SIFT | PolyPhen | Tumor Sample Barcode | Tissue | Histology | Sex | Age | Stage | Therapy Types | Drugs | Outcome |
| TPM1 | SNV | Missense_Mutation | | c.463G>C | p.Ala155Pro | p.A155P | P09493 | protein_coding | deleterious(0) | probably_damaging(0.998) | TCGA-A8-A08F-01 | Breast | breast invasive carcinoma | Female | <65 | III/IV | Chemotherapy | 5-fluorouracil | CR |
| TPM1 | SNV | Missense_Mutation | | c.499N>G | p.Arg167Gly | p.R167G | P09493 | protein_coding | deleterious(0.04) | benign(0.38) | TCGA-A8-A08Z-01 | Breast | breast invasive carcinoma | Female | >=65 | III/IV | Unknown | Unknown | SD |
| TPM1 | SNV | Missense_Mutation | novel | c.355N>T | p.Ala119Ser | p.A119S | P09493 | protein_coding | deleterious(0.04) | possibly_damaging(0.513) | TCGA-BH-A0C0-01 | Breast | breast invasive carcinoma | Female | <65 | I/II | Chemotherapy | carboplatin | SD |
| TPM1 | SNV | Missense_Mutation | | c.708G>C | p.Glu236Asp | p.E236D | P09493 | protein_coding | deleterious(0.01) | benign(0.424) | TCGA-C8-A26Y-01 | Breast | breast invasive carcinoma | Female | >=65 | I/II | Unknown | Unknown | SD |
| TPM1 | insertion | Nonsense_Mutation | novel | c.355_356insTTTAAGTT | p.Ala119ValfsTer2 | p.A119Vfs*2 | P09493 | protein_coding | | | TCGA-A2-A0CU-01 | Breast | breast invasive carcinoma | Female | >=65 | I/II | Hormone Therapy | tamoxiphen | SD |
| TPM1 | insertion | Nonsense_Mutation | novel | c.356_357insCTTTGTAAGGATCCTATGATAAAGTGGCTTGA | p.Ala120PhefsTer6 | p.A120Ffs*6 | P09493 | protein_coding | | | TCGA-A2-A0CU-01 | Breast | breast invasive carcinoma | Female | >=65 | I/II | Hormone Therapy | tamoxiphen | SD |
| TPM1 | deletion | Frame_Shift_Del | | c.180delC | p.Ser61LeufsTer25 | p.S61Lfs*25 | P09493 | protein_coding | | | TCGA-BH-A0B1-01 | Breast | breast invasive carcinoma | Female | >=65 | I/II | Chemotherapy | adriamycin | SD |
| TPM1 | insertion | Frame_Shift_Ins | novel | c.356_357insCAACTCTGTATTGTGGATCCATA | p.Ala120AsnfsTer16 | p.A120Nfs*16 | P09493 | protein_coding | | | TCGA-BH-A0C0-01 | Breast | breast invasive carcinoma | Female | <65 | I/II | Chemotherapy | carboplatin | SD |
| TPM1 | SNV | Missense_Mutation | novel | c.849N>A | p.Asn283Lys | p.N283K | P09493 | protein_coding | tolerated(0.11) | benign(0.026) | TCGA-AA-3877-01 | Colorectum | colon adenocarcinoma | Female | >=65 | I/II | Unknown | Unknown | SD |
| TPM1 | SNV | Missense_Mutation | novel | c.544N>T | p.Arg182Trp | p.R182W | P09493 | protein_coding | deleterious(0.01) | probably_damaging(0.932) | TCGA-AA-3984-01 | Colorectum | colon adenocarcinoma | Female | <65 | I/II | Unknown | Unknown | SD |


