
|
|||||
|
 | |
| |
| |
| |
| |
| |
|
Gene: PRDX5 |
Gene summary for PRDX5 |
| Gene information | Species | Human | Gene symbol | PRDX5 | Gene ID | 25824 |
| Gene name | peroxiredoxin 5 | |
| Gene Alias | ACR1 | |
| Cytomap | 11q13.1 | |
| Gene Type | protein-coding | GO ID | GO:0000302 | UniProtAcc | P30044 |
Top |
Malignant transformation analysis |
| Identification of the aberrant gene expression in precancerous and cancerous lesions by comparing the gene expression of stem-like cells in diseased tissues with normal stem cells |
| Entrez ID | Symbol | Replicates | Species | Organ | Tissue | Adj P-value | Log2FC | Malignancy |
| 25824 | PRDX5 | GSM4909280 | Human | Breast | Precancer | 2.09e-02 | -6.13e-01 | 0.0305 |
| 25824 | PRDX5 | GSM4909282 | Human | Breast | IDC | 2.88e-02 | -2.19e-01 | -0.0288 |
| 25824 | PRDX5 | GSM4909285 | Human | Breast | IDC | 4.63e-04 | -1.16e-01 | 0.21 |
| 25824 | PRDX5 | GSM4909286 | Human | Breast | IDC | 4.22e-12 | -1.75e-01 | 0.1081 |
| 25824 | PRDX5 | GSM4909293 | Human | Breast | IDC | 8.99e-04 | -3.03e-02 | 0.1581 |
| 25824 | PRDX5 | GSM4909296 | Human | Breast | IDC | 1.14e-09 | 2.34e-01 | 0.1524 |
| 25824 | PRDX5 | GSM4909297 | Human | Breast | IDC | 4.42e-19 | -2.97e-01 | 0.1517 |
| 25824 | PRDX5 | GSM4909298 | Human | Breast | IDC | 1.70e-12 | -3.23e-01 | 0.1551 |
| 25824 | PRDX5 | GSM4909308 | Human | Breast | IDC | 4.98e-06 | 3.30e-01 | 0.158 |
| 25824 | PRDX5 | GSM4909311 | Human | Breast | IDC | 2.54e-44 | -3.99e-01 | 0.1534 |
| 25824 | PRDX5 | GSM4909312 | Human | Breast | IDC | 2.90e-10 | -2.38e-01 | 0.1552 |
| 25824 | PRDX5 | GSM4909319 | Human | Breast | IDC | 2.19e-57 | -1.90e-01 | 0.1563 |
| 25824 | PRDX5 | GSM4909320 | Human | Breast | IDC | 6.37e-04 | -2.06e-01 | 0.1575 |
| 25824 | PRDX5 | GSM4909321 | Human | Breast | IDC | 4.00e-14 | 6.88e-02 | 0.1559 |
| 25824 | PRDX5 | brca2 | Human | Breast | Precancer | 3.14e-03 | 2.47e-01 | -0.024 |
| 25824 | PRDX5 | M2 | Human | Breast | IDC | 1.59e-03 | 2.90e-01 | 0.21 |
| 25824 | PRDX5 | NCCBC14 | Human | Breast | DCIS | 4.31e-07 | -2.21e-01 | 0.2021 |
| 25824 | PRDX5 | NCCBC2 | Human | Breast | DCIS | 1.39e-02 | -5.48e-02 | 0.1554 |
| 25824 | PRDX5 | NCCBC5 | Human | Breast | DCIS | 4.46e-12 | -2.91e-01 | 0.2046 |
| 25824 | PRDX5 | P1 | Human | Breast | IDC | 1.80e-29 | -6.25e-01 | 0.1527 |
| Page: 1 2 3 4 5 6 7 8 9 10 11 12 13 14 15 16 |
| Tissue | Expression Dynamics | Abbreviation |
| Breast |  | IDC: Invasive ductal carcinoma |
| DCIS: Ductal carcinoma in situ | ||
| Precancer(BRCA1-mut): Precancerous lesion from BRCA1 mutation carriers | ||
| Cervix |  | CC: Cervix cancer |
| HSIL_HPV: HPV-infected high-grade squamous intraepithelial lesions | ||
| N_HPV: HPV-infected normal cervix | ||
| Colorectum (GSE201348) |  | FAP: Familial adenomatous polyposis |
| CRC: Colorectal cancer | ||
| Colorectum (HTA11) |  | AD: Adenomas |
| SER: Sessile serrated lesions | ||
| MSI-H: Microsatellite-high colorectal cancer | ||
| MSS: Microsatellite stable colorectal cancer | ||
| Endometrium | 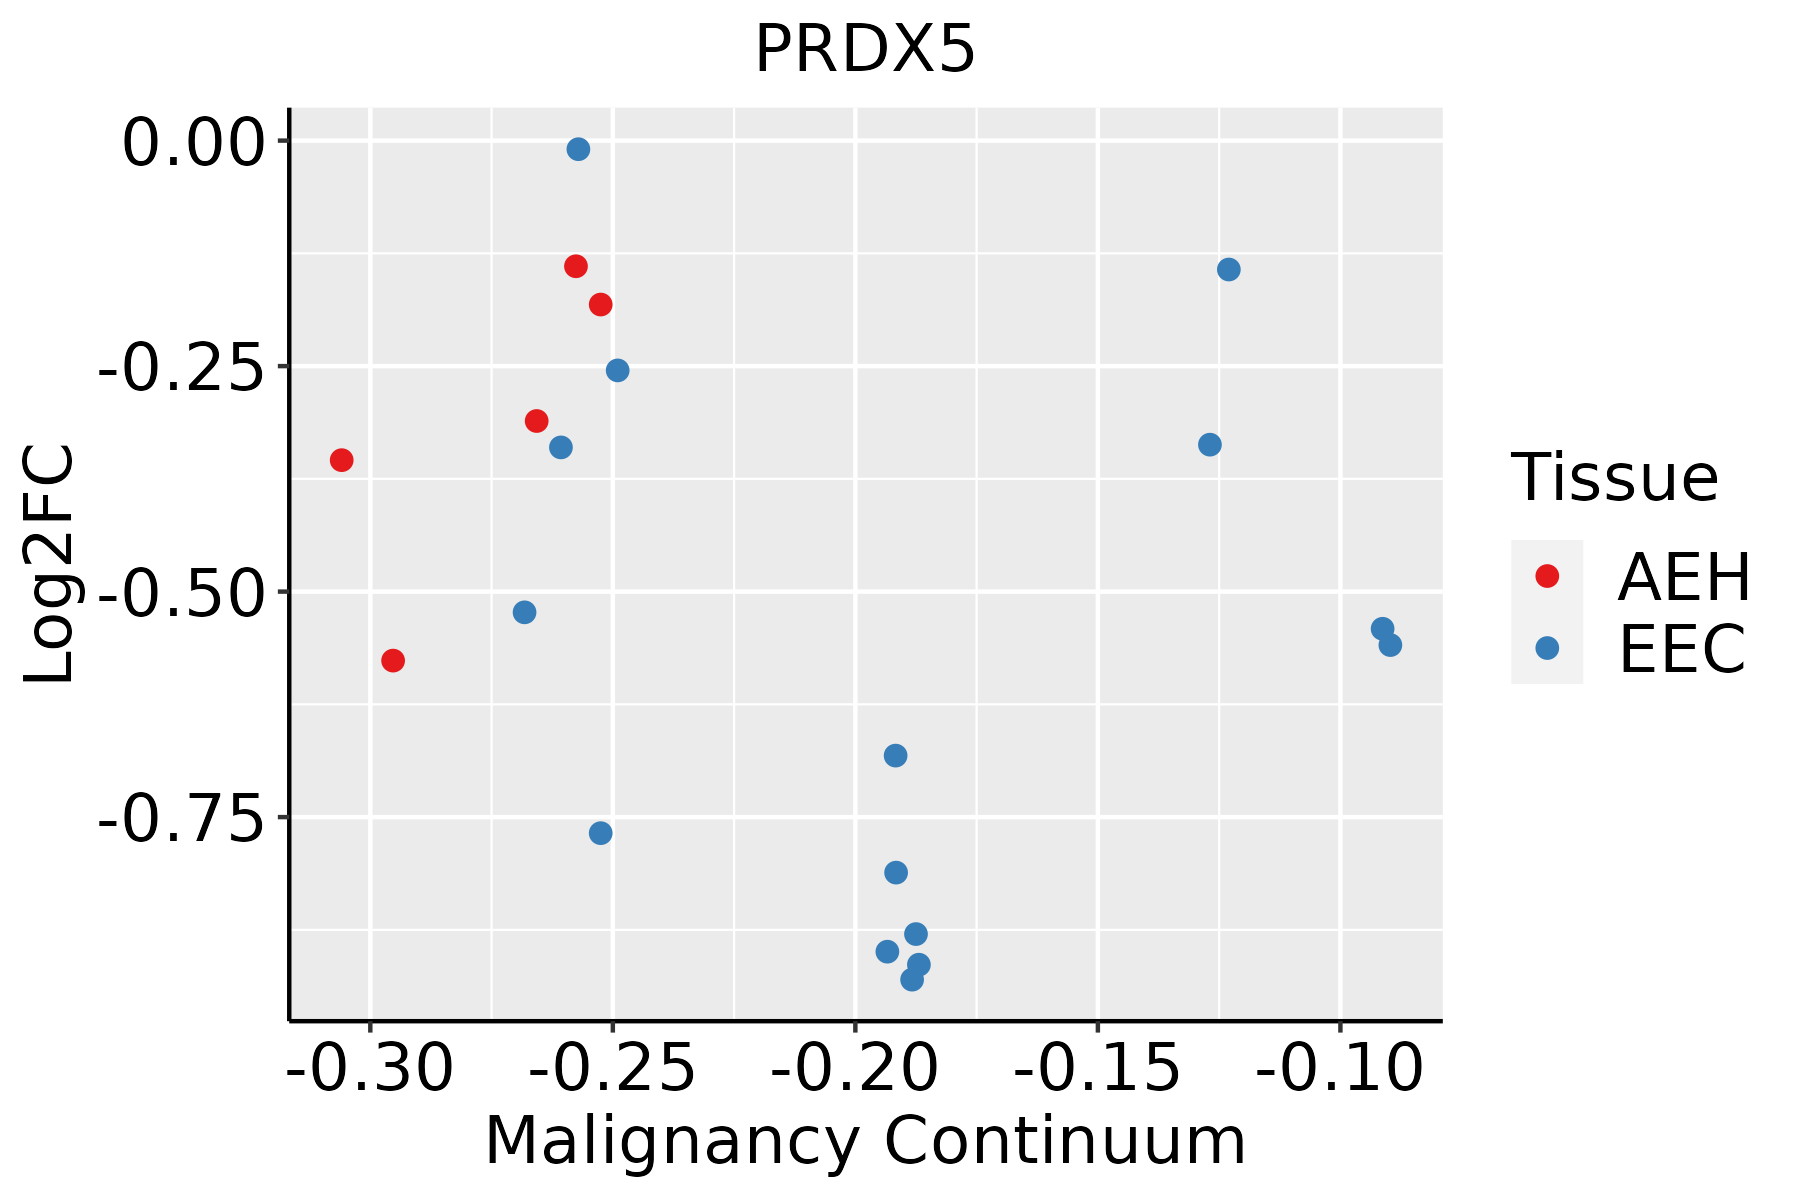 | AEH: Atypical endometrial hyperplasia |
| EEC: Endometrioid Cancer | ||
| Esophagus | 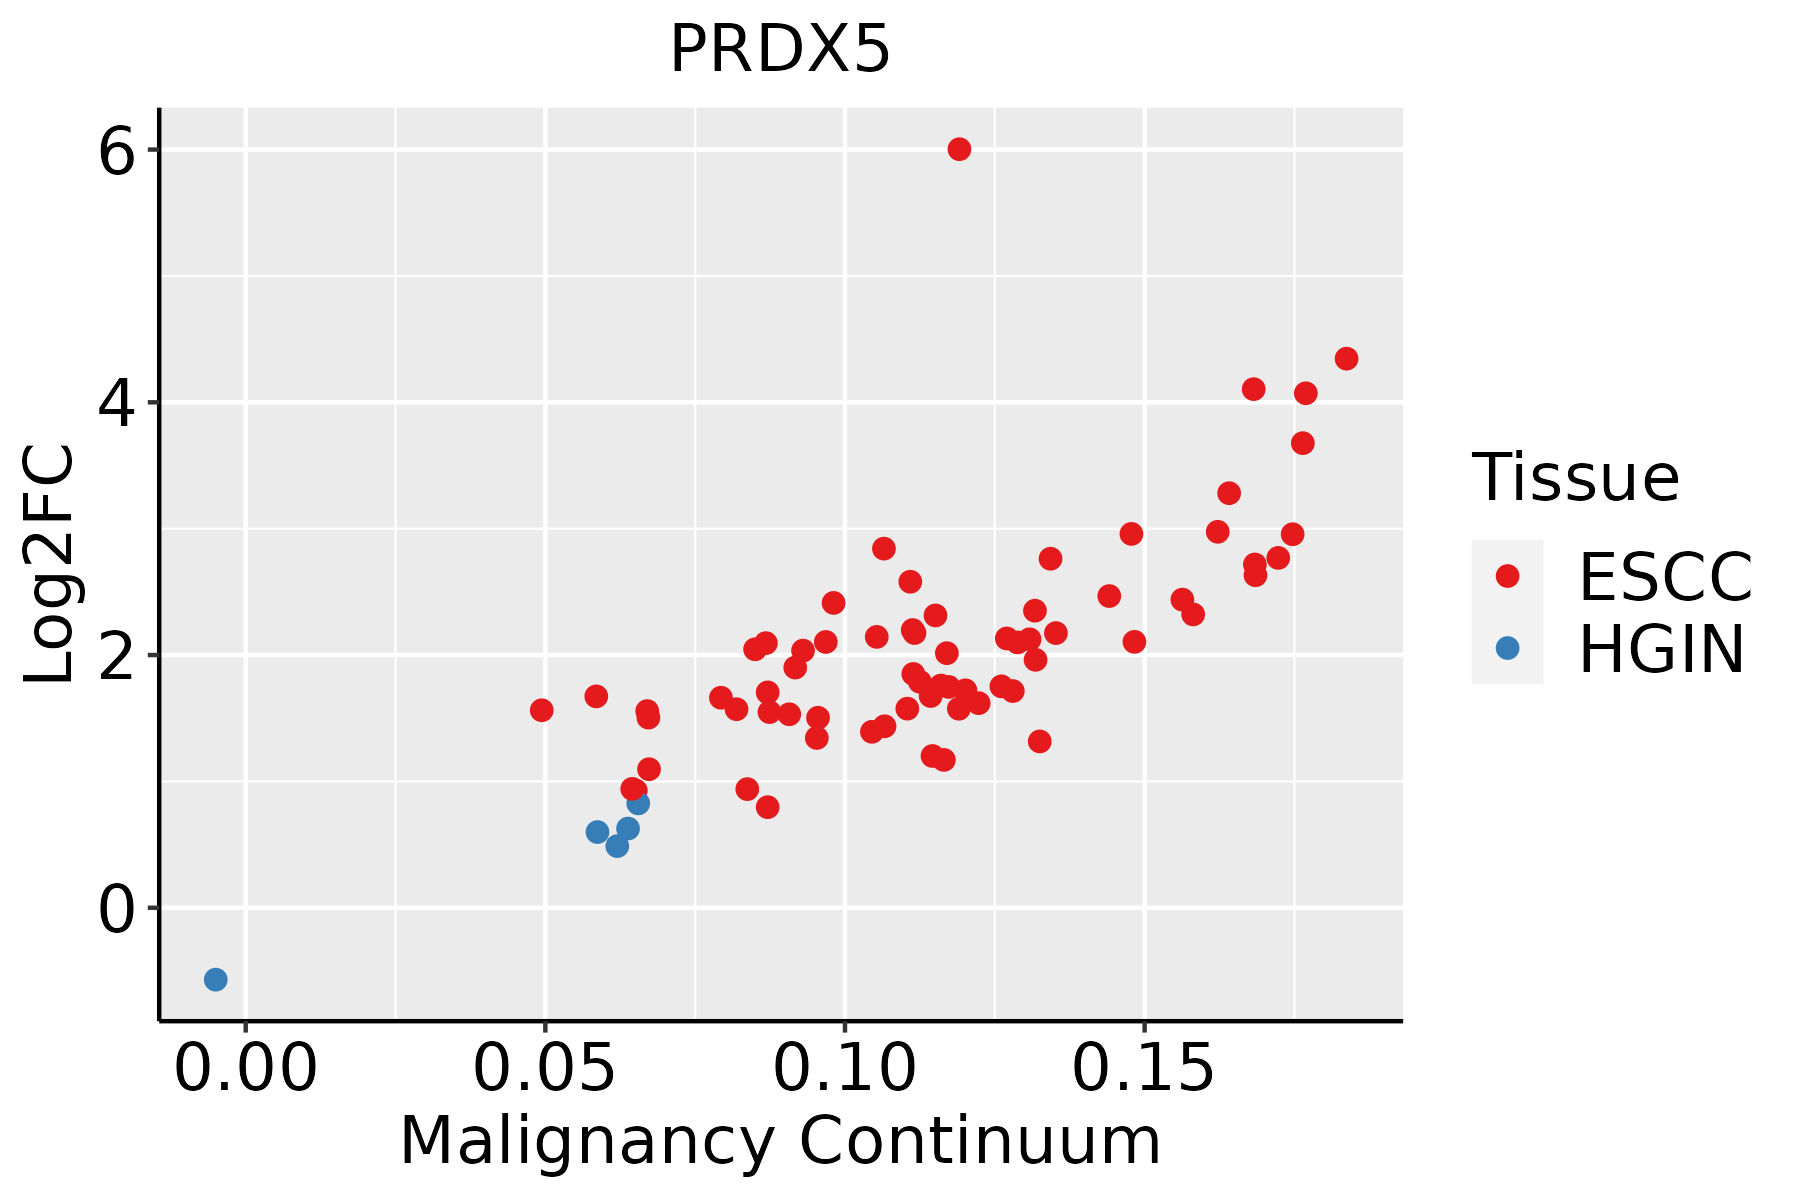 | ESCC: Esophageal squamous cell carcinoma |
| HGIN: High-grade intraepithelial neoplasias | ||
| LGIN: Low-grade intraepithelial neoplasias | ||
| GC | 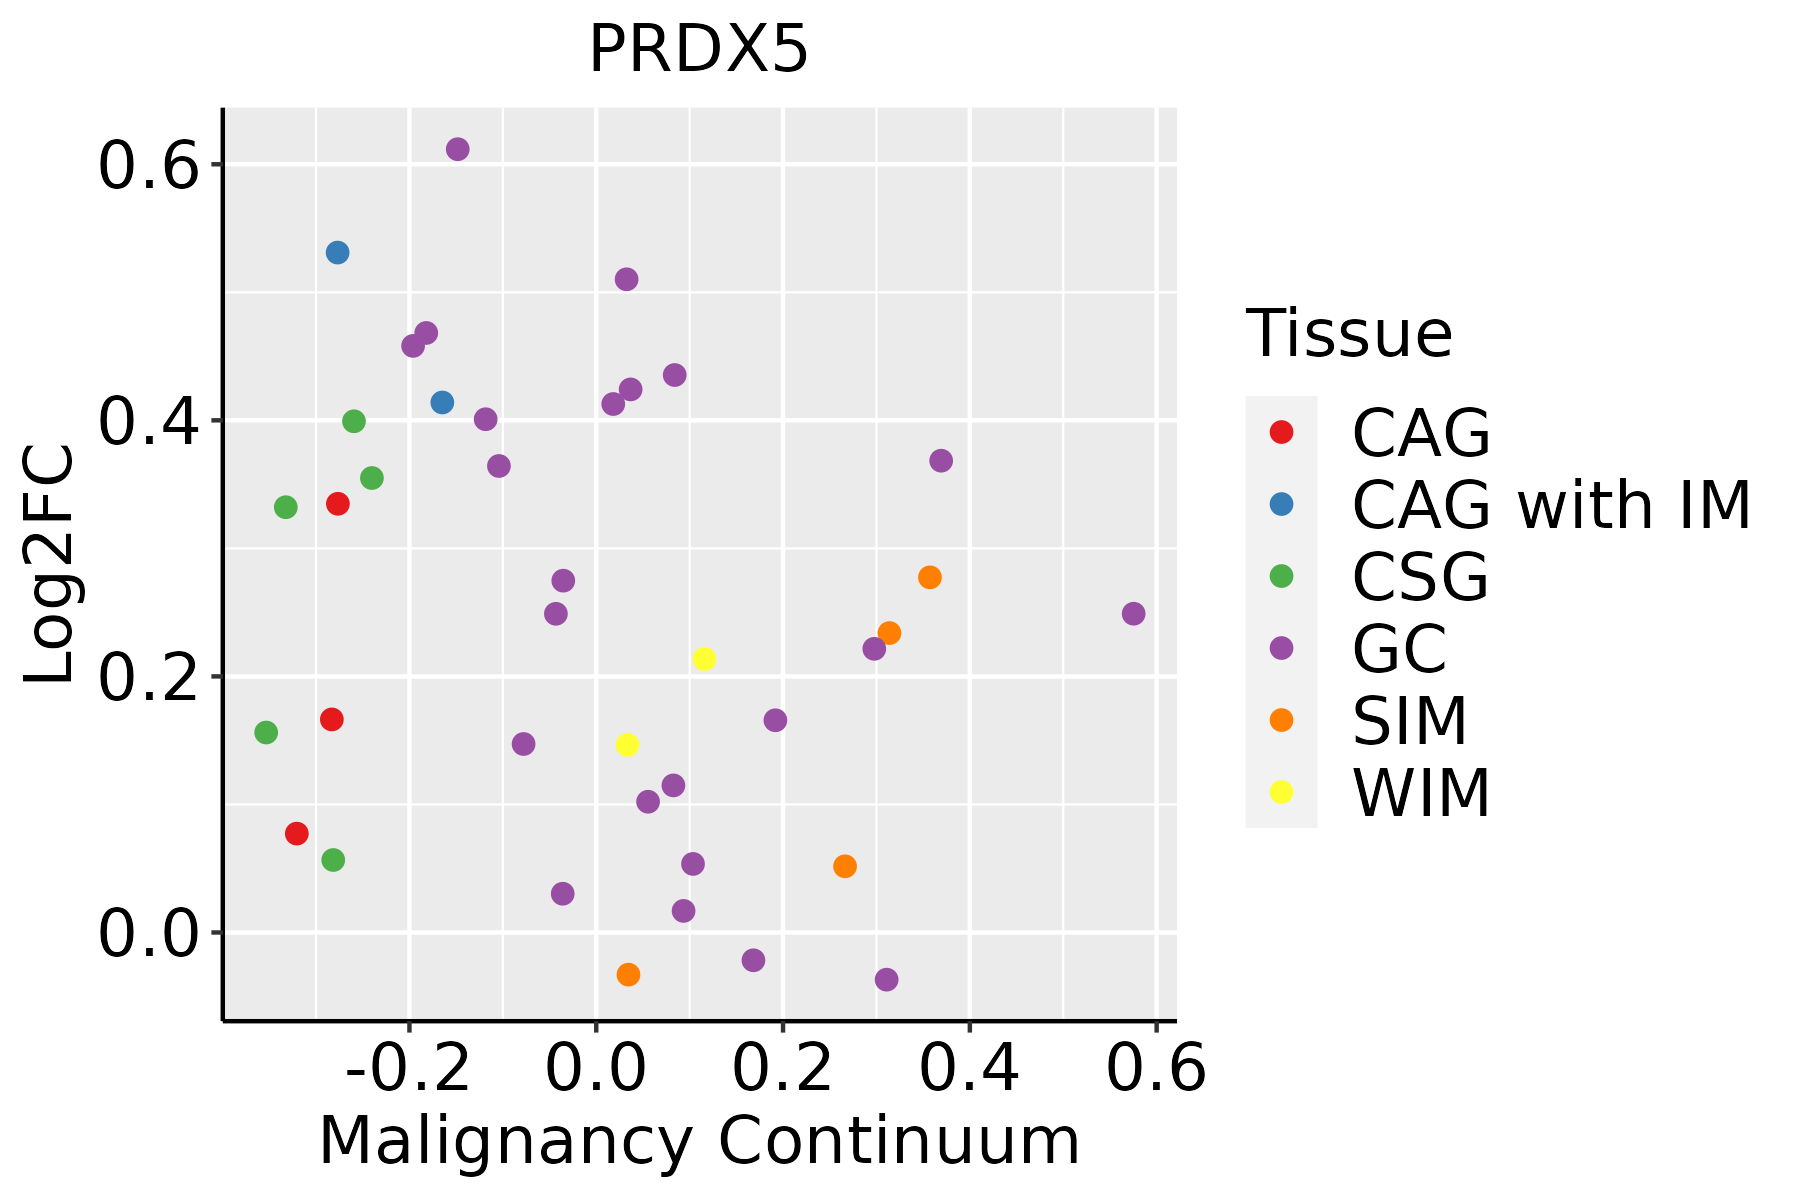 | CAG: Chronic atrophic gastritis |
| CAG with IM: Chronic atrophic gastritis with intestinal metaplasia | ||
| CSG: Chronic superficial gastritis | ||
| GC: Gastric cancer | ||
| SIM: Severe intestinal metaplasia | ||
| WIM: Wild intestinal metaplasia | ||
| Liver | 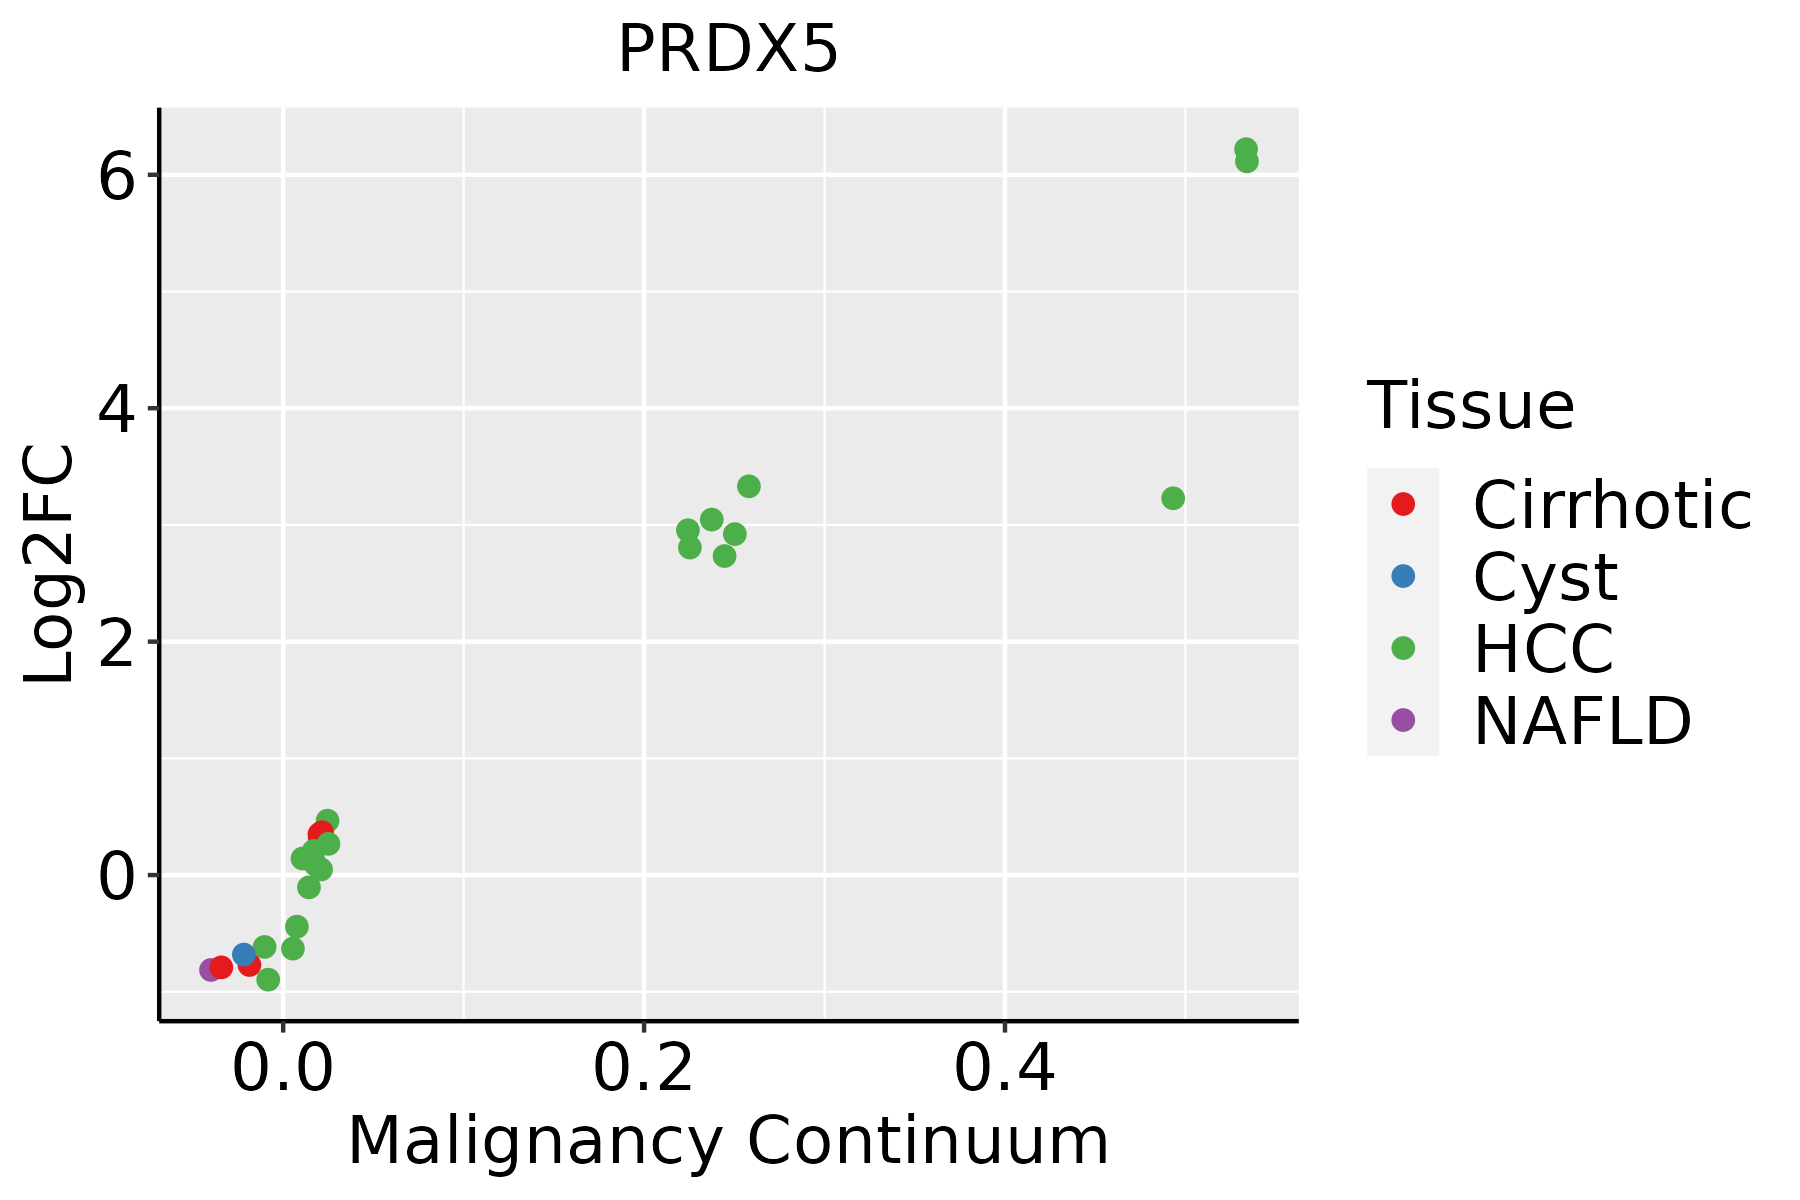 | HCC: Hepatocellular carcinoma |
| NAFLD: Non-alcoholic fatty liver disease | ||
| Oral Cavity | 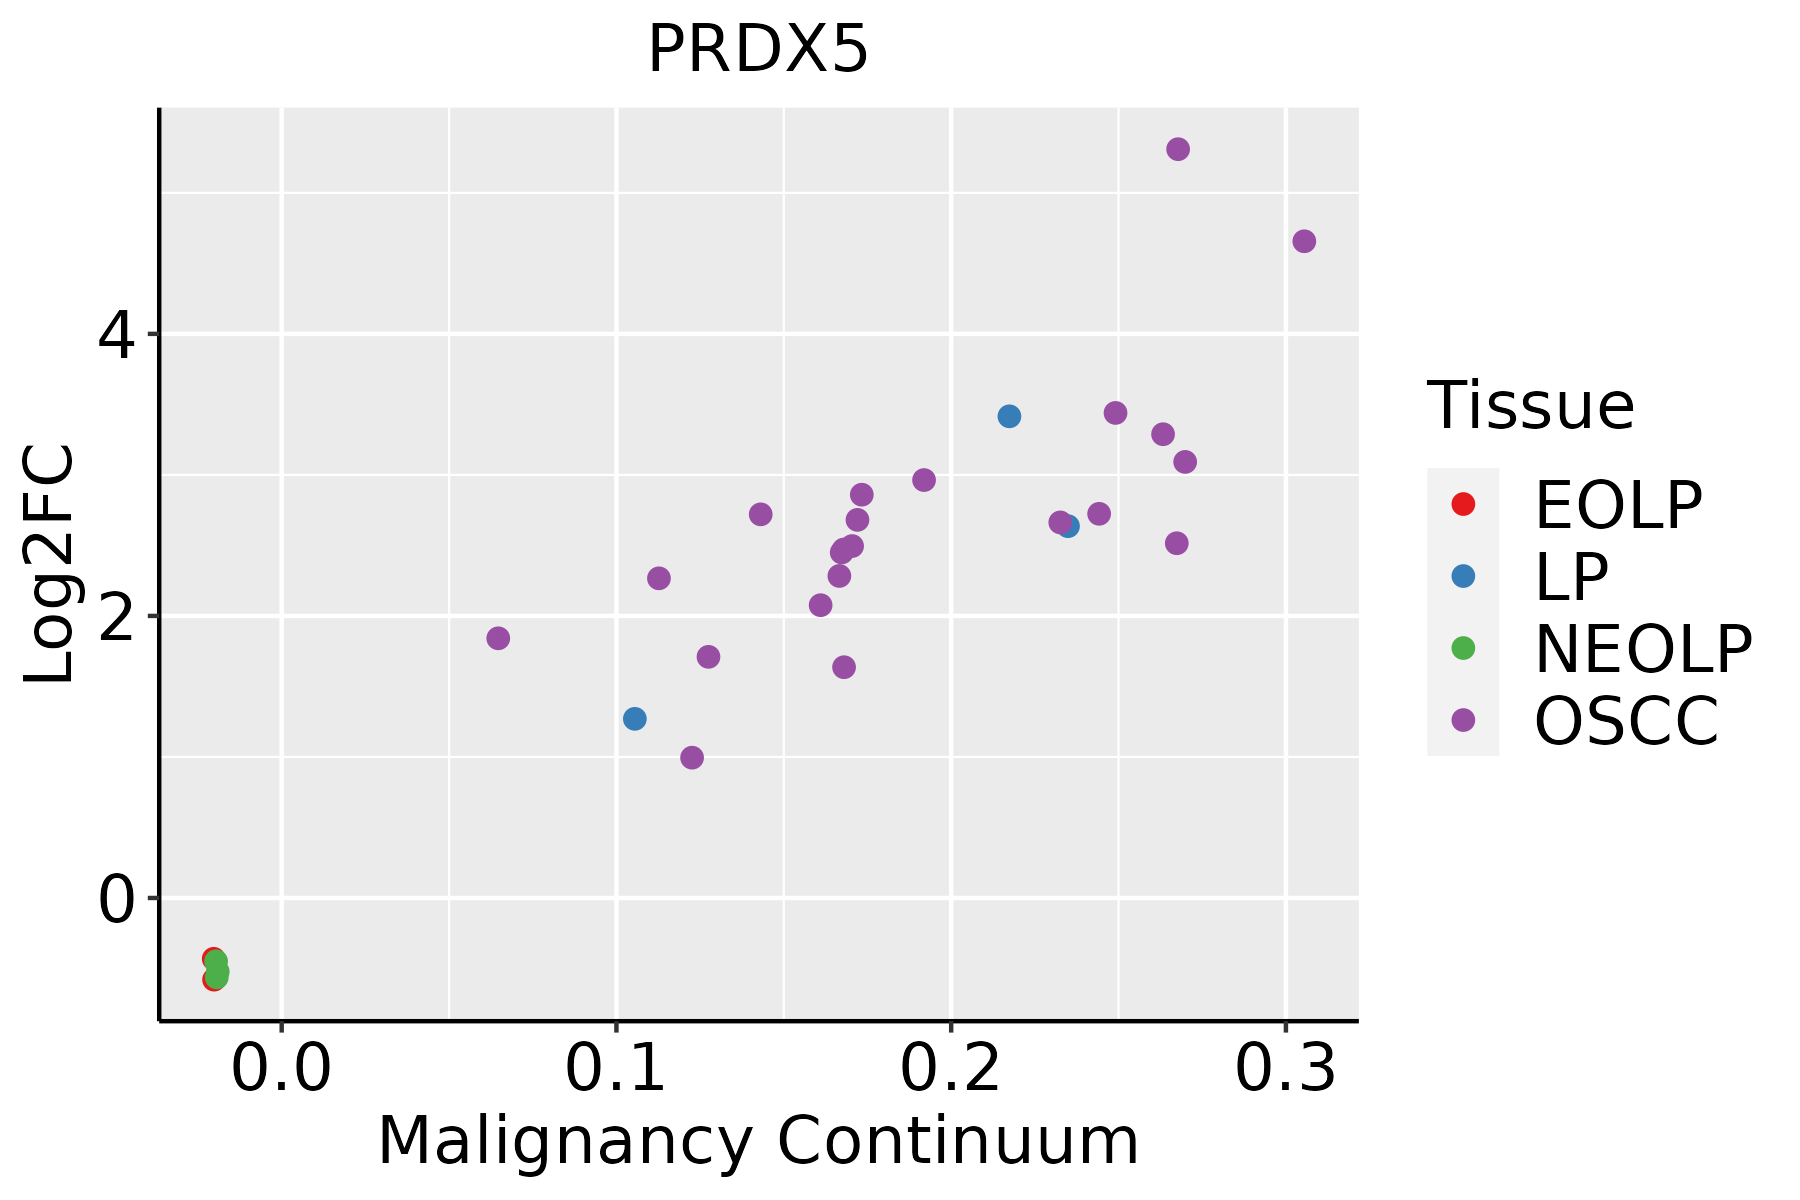 | EOLP: Erosive Oral lichen planus |
| LP: leukoplakia | ||
| NEOLP: Non-erosive oral lichen planus | ||
| OSCC: Oral squamous cell carcinoma | ||
| Prostate | 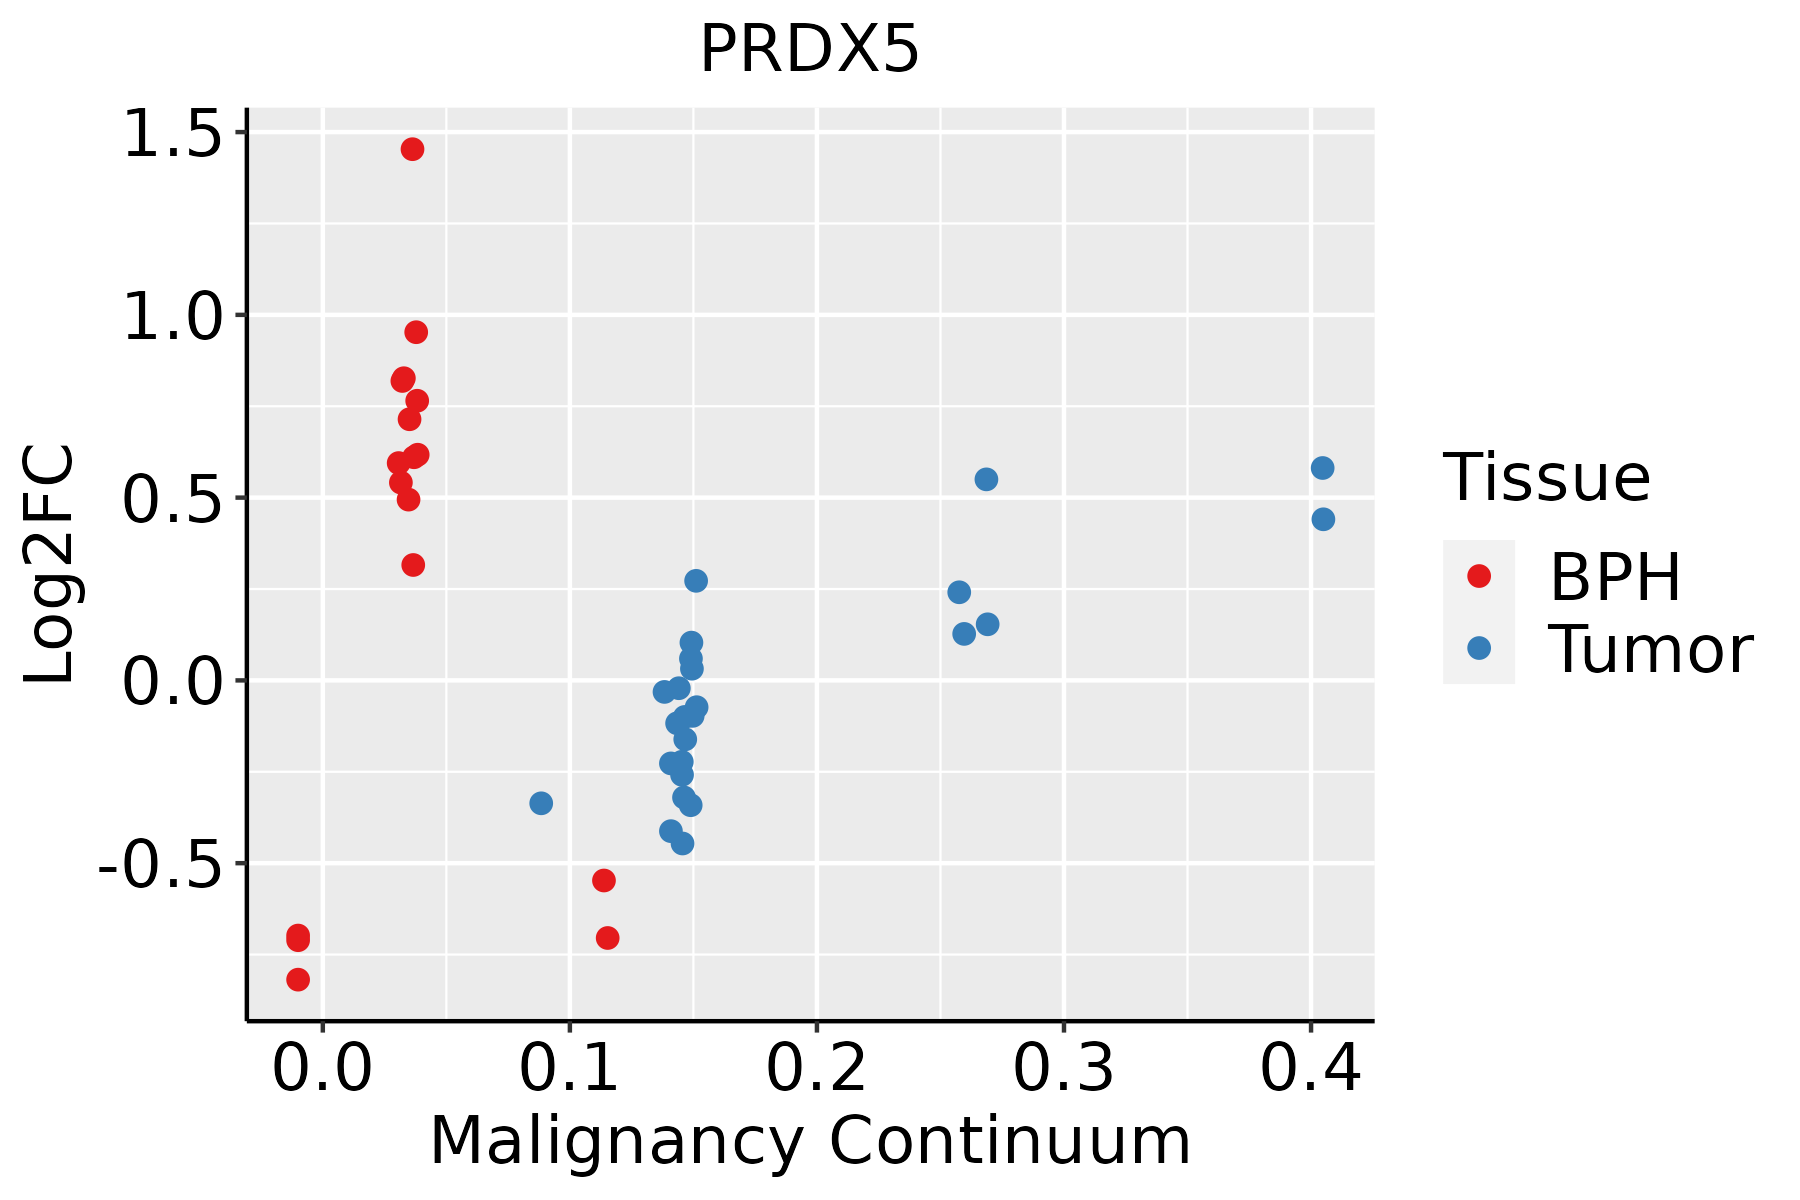 | BPH: Benign Prostatic Hyperplasia |
| Skin | 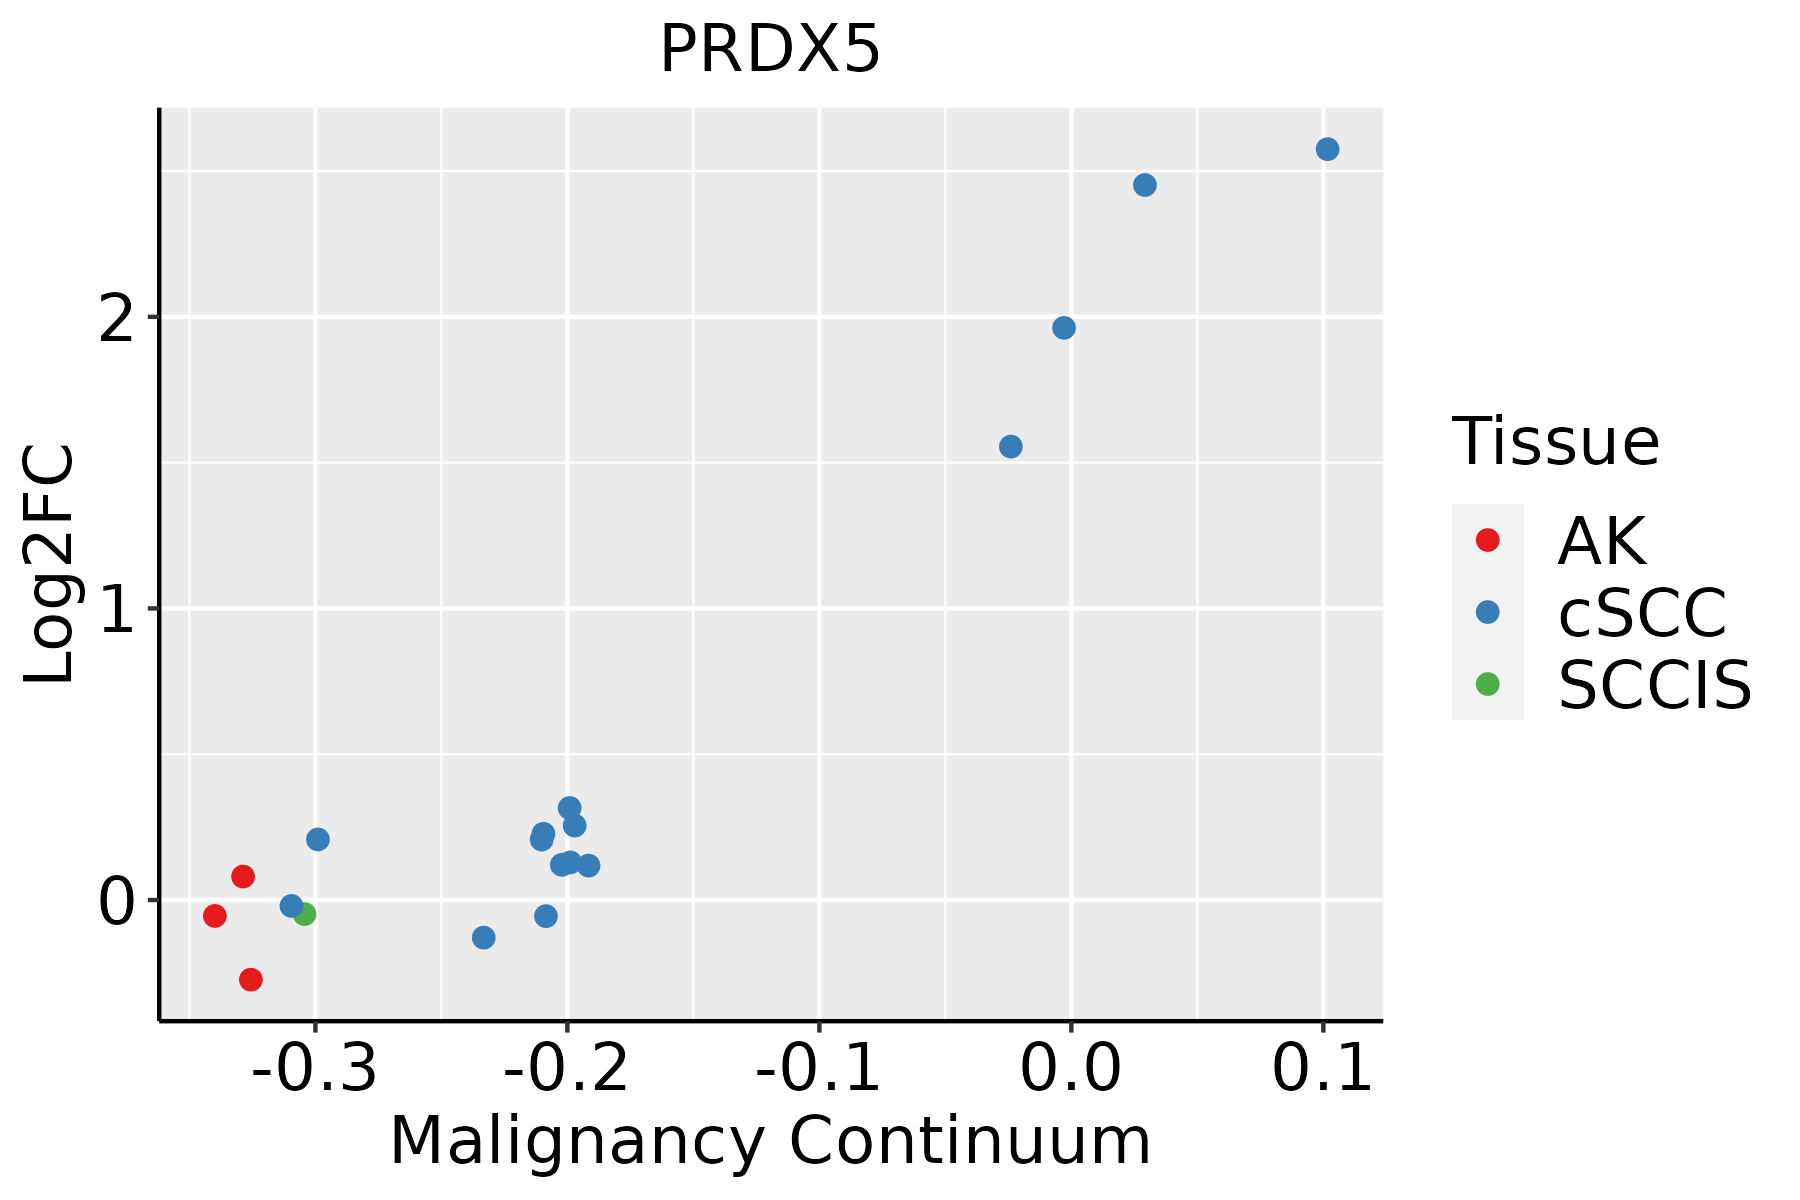 | AK: Actinic keratosis |
| cSCC: Cutaneous squamous cell carcinoma | ||
| SCCIS:squamous cell carcinoma in situ | ||
| Thyroid | 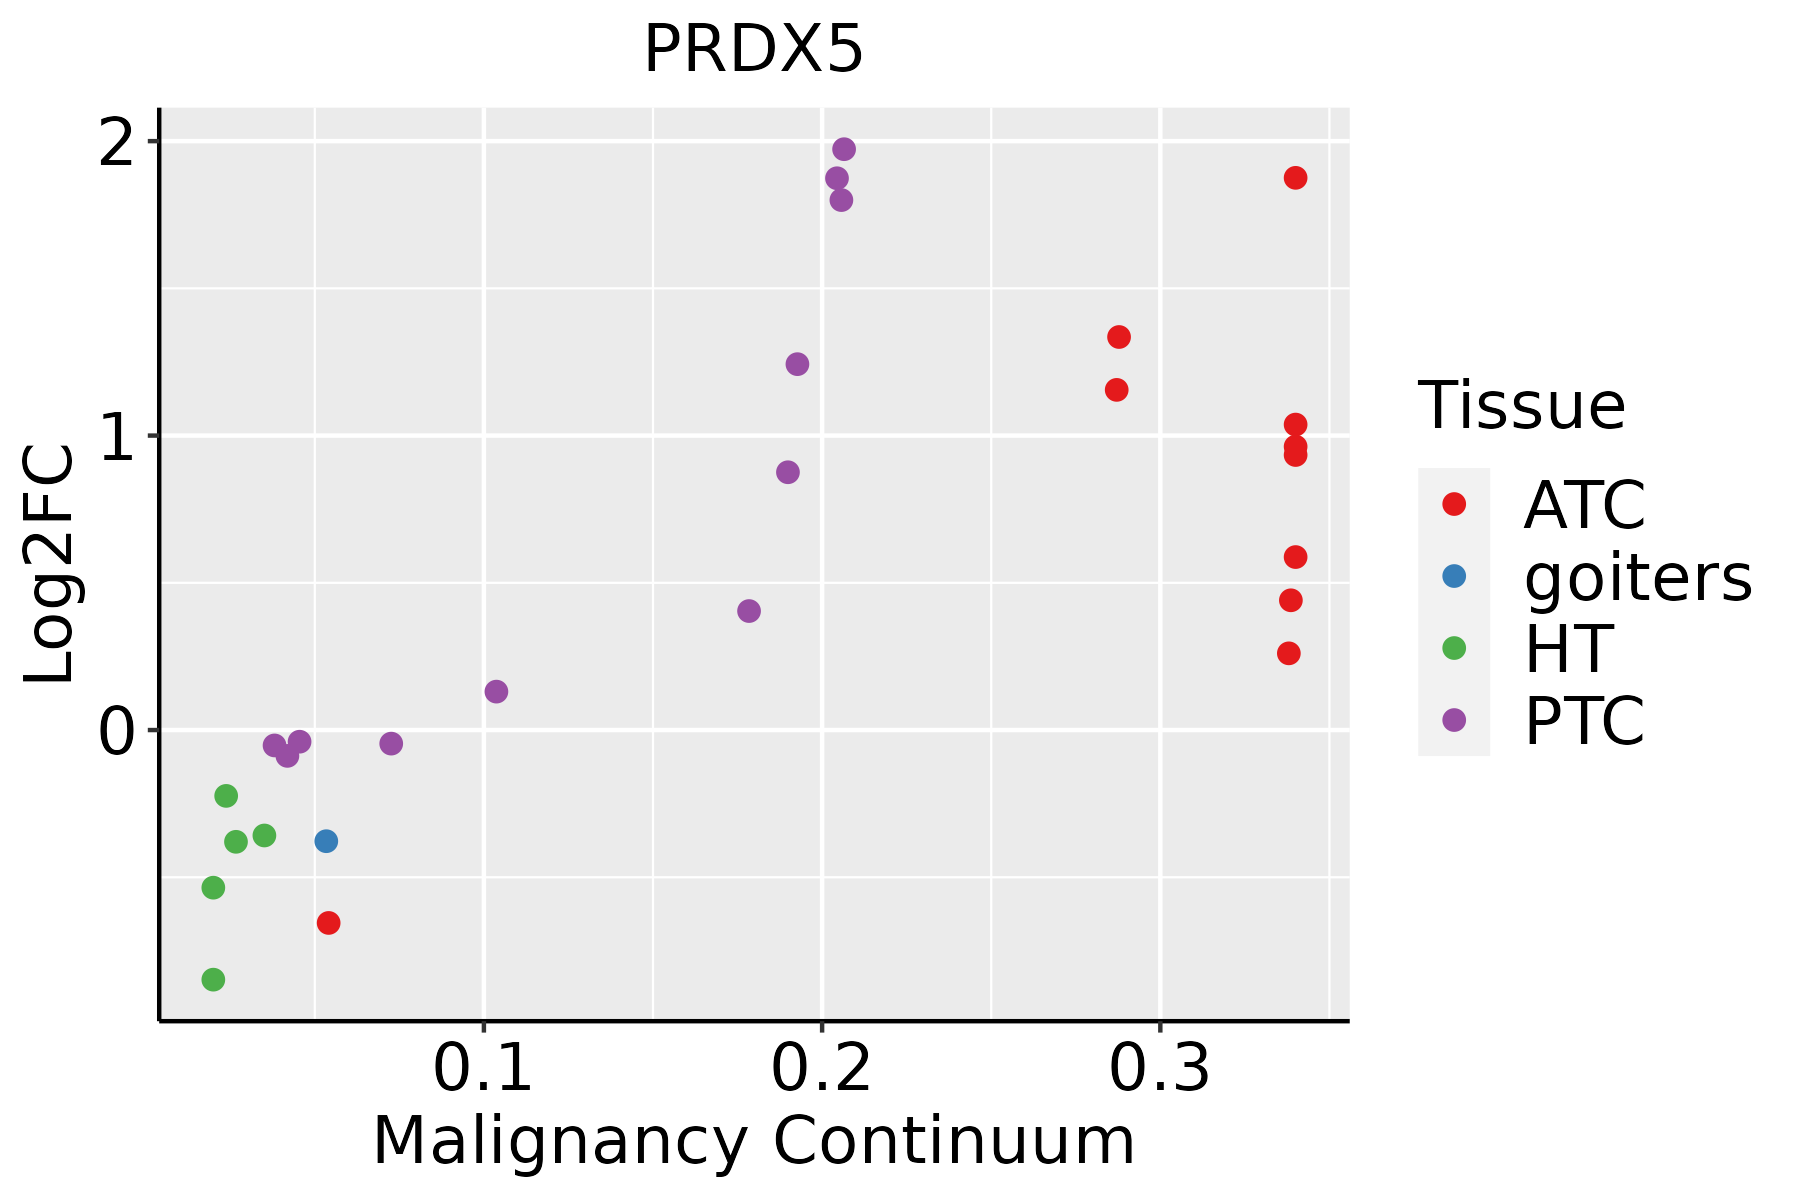 | ATC: Anaplastic thyroid cancer |
| HT: Hashimoto's thyroiditis | ||
| PTC: Papillary thyroid cancer |
| ∗log2FC in expression of this searched gene in stem-like cells from each diseased tissue sample relative to stem-like cells in normal samples in each tissue plotted against the malignancy continuum. Samples are colored based on if they are from different disease stage. |
Top |
Malignant transformation related pathway analysis |
| Find out the enriched GO biological processes and KEGG pathways involved in transition from healthy to precancer to cancer |
| Tissue | Disease Stage | Enriched GO biological Processes |
| Colorectum | AD |  |
| Colorectum | SER |  |
| Colorectum | MSS |  |
| Colorectum | MSI-H |  |
| Colorectum | FAP |  |
| ∗Top 15 enriched GO BP terms are showed in the bar plot of each disease state in each tissue. Each row represents a significant GO biological process which is colored according to the -log10(p.adjust). |
| Page: 1 2 3 4 5 6 7 8 9 |
| GO ID | Tissue | Disease Stage | Description | Gene Ratio | Bg Ratio | pvalue | p.adjust | Count |
| GO:000030211 | Stomach | CAG with IM | response to reactive oxygen species | 31/1050 | 222/18723 | 2.54e-06 | 1.07e-04 | 31 |
| GO:005134611 | Stomach | CAG with IM | negative regulation of hydrolase activity | 44/1050 | 379/18723 | 3.90e-06 | 1.52e-04 | 44 |
| GO:007259311 | Stomach | CAG with IM | reactive oxygen species metabolic process | 32/1050 | 239/18723 | 4.37e-06 | 1.68e-04 | 32 |
| GO:004328111 | Stomach | CAG with IM | regulation of cysteine-type endopeptidase activity involved in apoptotic process | 29/1050 | 209/18723 | 6.01e-06 | 2.23e-04 | 29 |
| GO:004545411 | Stomach | CAG with IM | cell redox homeostasis | 10/1050 | 35/18723 | 1.49e-05 | 4.83e-04 | 10 |
| GO:00427431 | Stomach | CAG with IM | hydrogen peroxide metabolic process | 12/1050 | 58/18723 | 7.37e-05 | 1.75e-03 | 12 |
| GO:003461411 | Stomach | CAG with IM | cellular response to reactive oxygen species | 21/1050 | 155/18723 | 1.57e-04 | 3.06e-03 | 21 |
| GO:200011711 | Stomach | CAG with IM | negative regulation of cysteine-type endopeptidase activity | 14/1050 | 86/18723 | 2.88e-04 | 4.99e-03 | 14 |
| GO:004315411 | Stomach | CAG with IM | negative regulation of cysteine-type endopeptidase activity involved in apoptotic process | 12/1050 | 78/18723 | 1.28e-03 | 1.53e-02 | 12 |
| GO:00427441 | Stomach | CAG with IM | hydrogen peroxide catabolic process | 7/1050 | 32/18723 | 1.67e-03 | 1.83e-02 | 7 |
| GO:009875421 | Stomach | CSG | detoxification | 32/1034 | 152/18723 | 4.37e-11 | 8.90e-09 | 32 |
| GO:000963621 | Stomach | CSG | response to toxic substance | 43/1034 | 262/18723 | 1.25e-10 | 2.21e-08 | 43 |
| GO:005254721 | Stomach | CSG | regulation of peptidase activity | 61/1034 | 461/18723 | 1.96e-10 | 3.24e-08 | 61 |
| GO:005254821 | Stomach | CSG | regulation of endopeptidase activity | 58/1034 | 432/18723 | 3.14e-10 | 4.88e-08 | 58 |
| GO:000697921 | Stomach | CSG | response to oxidative stress | 58/1034 | 446/18723 | 1.08e-09 | 1.46e-07 | 58 |
| GO:009723721 | Stomach | CSG | cellular response to toxic substance | 26/1034 | 124/18723 | 3.15e-09 | 3.47e-07 | 26 |
| GO:199074821 | Stomach | CSG | cellular detoxification | 25/1034 | 116/18723 | 3.47e-09 | 3.75e-07 | 25 |
| GO:009886921 | Stomach | CSG | cellular oxidant detoxification | 22/1034 | 101/18723 | 2.44e-08 | 2.05e-06 | 22 |
| GO:004586121 | Stomach | CSG | negative regulation of proteolysis | 45/1034 | 351/18723 | 1.23e-07 | 8.68e-06 | 45 |
| GO:006219721 | Stomach | CSG | cellular response to chemical stress | 42/1034 | 337/18723 | 6.94e-07 | 3.75e-05 | 42 |
| Page: 1 2 3 4 5 6 7 8 9 10 11 12 13 14 15 16 17 18 19 20 21 22 23 24 25 26 27 28 29 30 31 32 33 34 35 36 |
| Pathway ID | Tissue | Disease Stage | Description | Gene Ratio | Bg Ratio | pvalue | p.adjust | qvalue | Count |
| hsa041467 | Esophagus | ESCC | Peroxisome | 55/4205 | 82/8465 | 1.04e-03 | 3.27e-03 | 1.68e-03 | 55 |
| hsa0414612 | Esophagus | ESCC | Peroxisome | 55/4205 | 82/8465 | 1.04e-03 | 3.27e-03 | 1.68e-03 | 55 |
| hsa041462 | Liver | Cirrhotic | Peroxisome | 36/2530 | 82/8465 | 4.79e-03 | 1.74e-02 | 1.07e-02 | 36 |
| hsa041463 | Liver | Cirrhotic | Peroxisome | 36/2530 | 82/8465 | 4.79e-03 | 1.74e-02 | 1.07e-02 | 36 |
| hsa041464 | Liver | HCC | Peroxisome | 58/4020 | 82/8465 | 1.57e-05 | 1.05e-04 | 5.85e-05 | 58 |
| hsa041465 | Liver | HCC | Peroxisome | 58/4020 | 82/8465 | 1.57e-05 | 1.05e-04 | 5.85e-05 | 58 |
| hsa041466 | Oral cavity | OSCC | Peroxisome | 47/3704 | 82/8465 | 9.01e-03 | 2.01e-02 | 1.03e-02 | 47 |
| hsa0414611 | Oral cavity | OSCC | Peroxisome | 47/3704 | 82/8465 | 9.01e-03 | 2.01e-02 | 1.03e-02 | 47 |
| hsa0414621 | Oral cavity | LP | Peroxisome | 33/2418 | 82/8465 | 1.48e-02 | 4.69e-02 | 3.03e-02 | 33 |
| hsa0414631 | Oral cavity | LP | Peroxisome | 33/2418 | 82/8465 | 1.48e-02 | 4.69e-02 | 3.03e-02 | 33 |
| Page: 1 |
Top |
Cell-cell communication analysis |
| Identification of potential cell-cell interactions between two cell types and their ligand-receptor pairs for different disease states |
| Ligand | Receptor | LRpair | Pathway | Tissue | Disease Stage |
| Page: 1 |
Top |
Single-cell gene regulatory network inference analysis |
| Find out the significant the regulons (TFs) and the target genes of each regulon across cell types for different disease states |
| TF | Cell Type | Tissue | Disease Stage | Target Gene | RSS | Regulon Activity |
| PRDX5 | PLA | Lung | Healthy | CYB5B,ERGIC3,NDUFC2, etc. | 6.88e-02 |  |
| PRDX5 | PLA | Skin | Healthy | ALOX5AP,SH3BGRL3,CYBA, etc. | 6.71e-02 |  |
| ∗The dot plots of a searched regulon are shown for all cell subpopulations in each disease state of each tissue based on the regulon specific score inferred using pySCENIC and by calculating the average expression. |
| Page: 1 |
Top |
Somatic mutation of malignant transformation related genes |
| Annotation of somatic variants for genes involved in malignant transformation |
| Hugo Symbol | Variant Class | Variant Classification | dbSNP RS | HGVSc | HGVSp | HGVSp Short | SWISSPROT | BIOTYPE | SIFT | PolyPhen | Tumor Sample Barcode | Tissue | Histology | Sex | Age | Stage | Therapy Types | Drugs | Outcome |
| PRDX5 | SNV | Missense_Mutation | c.205N>A | p.Glu69Lys | p.E69K | P30044 | protein_coding | deleterious(0.01) | probably_damaging(0.992) | TCGA-A2-A1G4-01 | Breast | breast invasive carcinoma | Female | >=65 | III/IV | Chemotherapy | adriamycin | SD | |
| PRDX5 | SNV | Missense_Mutation | c.281N>T | p.Gly94Val | p.G94V | P30044 | protein_coding | deleterious(0) | probably_damaging(0.999) | TCGA-BH-A18G-01 | Breast | breast invasive carcinoma | Female | >=65 | I/II | Unknown | Unknown | SD | |
| PRDX5 | SNV | Missense_Mutation | novel | c.31N>T | p.Arg11Cys | p.R11C | P30044 | protein_coding | deleterious_low_confidence(0.03) | benign(0) | TCGA-D8-A27I-01 | Breast | breast invasive carcinoma | Female | <65 | III/IV | Chemotherapy | adrimycin+cyclophosphamide | SD |
| PRDX5 | SNV | Missense_Mutation | novel | c.514A>C | p.Ile172Leu | p.I172L | P30044 | protein_coding | tolerated(1) | benign(0.001) | TCGA-AA-3939-01 | Colorectum | colon adenocarcinoma | Male | >=65 | I/II | Unknown | Unknown | SD |
| PRDX5 | SNV | Missense_Mutation | c.604C>T | p.Leu202Phe | p.L202F | P30044 | protein_coding | deleterious(0.02) | possibly_damaging(0.836) | TCGA-CK-4951-01 | Colorectum | colon adenocarcinoma | Female | >=65 | I/II | Unknown | Unknown | PD | |
| PRDX5 | SNV | Missense_Mutation | rs148589018 | c.77N>T | p.Ala26Val | p.A26V | P30044 | protein_coding | tolerated_low_confidence(0.1) | benign(0.001) | TCGA-G4-6588-01 | Colorectum | colon adenocarcinoma | Female | <65 | I/II | Unknown | Unknown | SD |
| PRDX5 | SNV | Missense_Mutation | c.341N>A | p.Ala114Asp | p.A114D | P30044 | protein_coding | tolerated(0.36) | benign(0.014) | TCGA-AP-A051-01 | Endometrium | uterine corpus endometrioid carcinoma | Female | >=65 | I/II | Unknown | Unknown | SD | |
| PRDX5 | SNV | Missense_Mutation | novel | c.196G>A | p.Glu66Lys | p.E66K | P30044 | protein_coding | tolerated(0.36) | benign(0.039) | TCGA-AX-A06F-01 | Endometrium | uterine corpus endometrioid carcinoma | Female | <65 | III/IV | Chemotherapy | carboplatin | SD |
| PRDX5 | SNV | Missense_Mutation | novel | c.112N>C | p.Trp38Arg | p.W38R | P30044 | protein_coding | tolerated(0.17) | benign(0.003) | TCGA-B5-A3FC-01 | Endometrium | uterine corpus endometrioid carcinoma | Female | <65 | I/II | Unknown | Unknown | SD |
| PRDX5 | SNV | Missense_Mutation | novel | c.103G>A | p.Glu35Lys | p.E35K | P30044 | protein_coding | tolerated(0.86) | benign(0.003) | TCGA-D1-A175-01 | Endometrium | uterine corpus endometrioid carcinoma | Female | <65 | I/II | Chemotherapy | paclitaxel | SD |
| Page: 1 2 |
Top |
Related drugs of malignant transformation related genes |
| Identification of chemicals and drugs interact with genes involved in malignant transfromation |
| (DGIdb 4.0) |
| Entrez ID | Symbol | Category | Interaction Types | Drug Claim Name | Drug Name | PMIDs |
| 25824 | PRDX5 | ENZYME | 2-(2-HYDROXYBENZYL)PHENOL | CHEMBL148831 | 26492576 | |
| 25824 | PRDX5 | ENZYME | Diterpene triepoxide derivative 1 | |||
| 25824 | PRDX5 | ENZYME | Motexafin gadolinium |
| Page: 1 |

Copyright 2023-Present -The University of Texas Health Science Center at Houston |