Schematic overview of the cellular and molecular mechanisms involved in the cancer progression, including the proposed cellular and molecular mechanisms in cancer cells trajectory. AT1: alveolar type 1 cells; AT2: alveolar type 2 cells; AAH: atypical adenomatous hyperplasia; AIS: adenocarcinoma in situ; MIA: minimally invasive adenocarcinoma; IA: invasive adenocarcinoma; EMT: epithelial-mesenchymal transition

Home

Download

Statistics

Help

Contact

Center for Computational Systems Medicine
leaf

Gene summary

leaf

Malignant transformation analysis

leaf

Malignant transformation related pathway analysis

leaf

Cell-cell communication analysis

leaf

Single-cell gene regulatory network inference analysis

leaf

Somatic mutation of malignant transformation related genes

leaf

Related drugs of malignant transformation related genes

Gene: NUDT1

Gene summary for NUDT1

check button Gene summary.

Gene informationSpeciesHuman
Gene symbol

NUDT1

Gene ID

4521

Gene namenudix hydrolase 1
Gene AliasMTH1
Cytomap7p22.3
Gene Typeprotein-coding
GO ID

GO:0000003

UniProtAcc

A0A024R819


Top

Malignant transformation analysis

check button Identification of the aberrant gene expression in precancerous and cancerous lesions by comparing the gene expression of stem-like cells in diseased tissues with normal stem cells
check button Malignant transformation involving gene list.
Entrez IDSymbolReplicatesSpeciesOrganTissueAdj P-valueLog2FCMalignancy
4521NUDT1GSM4909282HumanBreastIDC1.33e-063.57e-01-0.0288
4521NUDT1GSM4909311HumanBreastIDC3.50e-06-9.78e-020.1534
4521NUDT1GSM4909312HumanBreastIDC3.60e-03-5.51e-020.1552
4521NUDT1GSM4909315HumanBreastIDC5.65e-175.94e-010.21
4521NUDT1GSM4909316HumanBreastIDC4.15e-055.02e-010.21
4521NUDT1GSM4909319HumanBreastIDC3.29e-187.71e-020.1563
4521NUDT1GSM4909321HumanBreastIDC1.91e-047.76e-020.1559
4521NUDT1NCCBC3HumanBreastDCIS1.22e-027.81e-020.1198
4521NUDT1NCCBC5HumanBreastDCIS2.29e-021.92e-010.2046
4521NUDT1P1HumanBreastIDC3.22e-04-4.50e-020.1527
4521NUDT1DCIS2HumanBreastDCIS1.05e-194.37e-020.0085
4521NUDT1LZE2DHumanEsophagusHGIN1.97e-044.91e-010.0642
4521NUDT1LZE2THumanEsophagusESCC6.36e-051.02e+000.082
4521NUDT1LZE4THumanEsophagusESCC1.12e-114.20e-010.0811
4521NUDT1LZE7THumanEsophagusESCC2.77e-158.12e-010.0667
4521NUDT1LZE8THumanEsophagusESCC6.49e-043.60e-010.067
4521NUDT1LZE20THumanEsophagusESCC9.98e-063.73e-010.0662
4521NUDT1LZE22D1HumanEsophagusHGIN1.64e-032.63e-010.0595
4521NUDT1LZE22THumanEsophagusESCC5.73e-111.07e+000.068
4521NUDT1LZE24THumanEsophagusESCC1.02e-135.37e-010.0596
Page: 1 2 3 4 5 6 7 

check button Transcriptomic changes along malignancy continuum.
TissueExpression DynamicsAbbreviation
BreastThe image shows the transcriptomic changes along malignancy continuum.log2FC in expression of this searched gene in stem-like cells from each diseased tissue sample relative to stem-like cells in normal samples in each tissue plotted against the malignancy continuum. Samples are colored based on if they are from different disease stage.
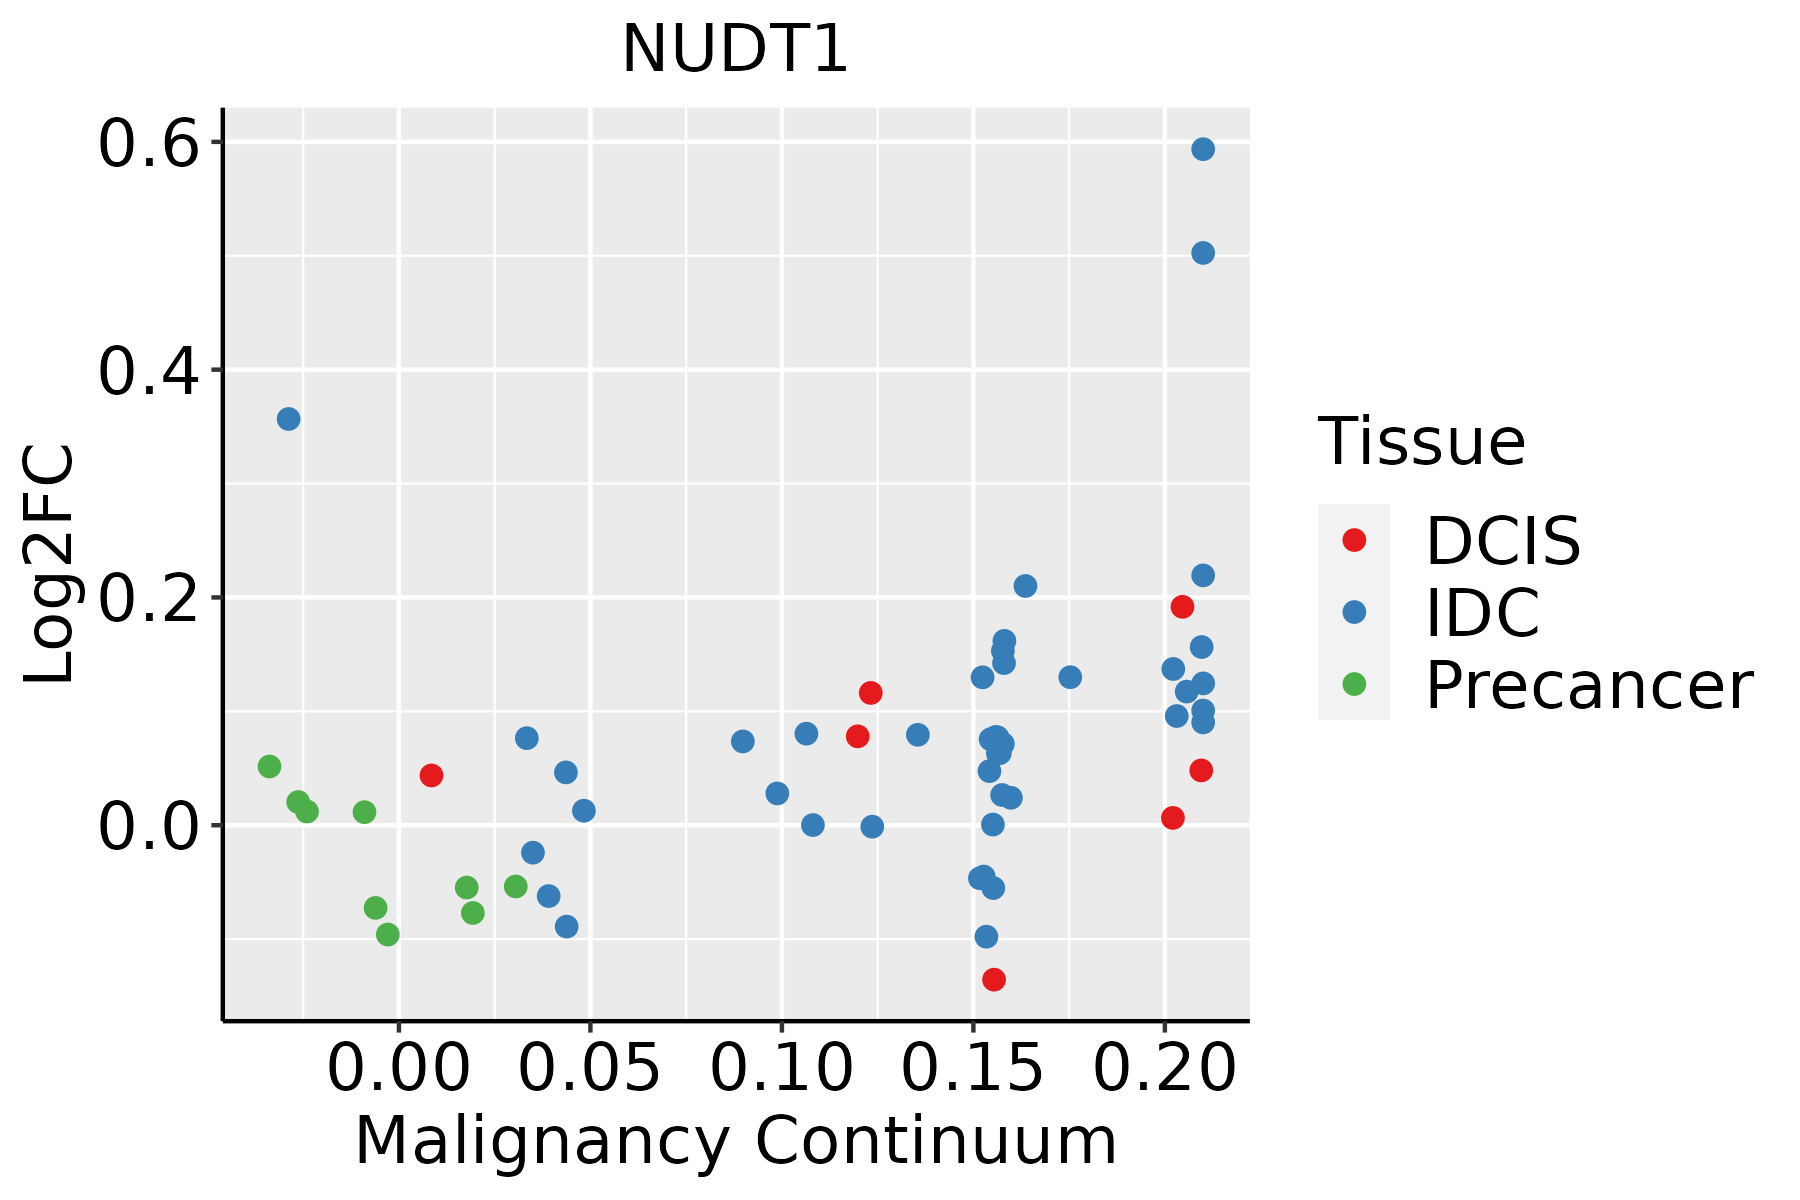
IDC: Invasive ductal carcinoma
DCIS: Ductal carcinoma in situ
Precancer(BRCA1-mut): Precancerous lesion from BRCA1 mutation carriers
EsophagusThe image shows the transcriptomic changes along malignancy continuum.log2FC in expression of this searched gene in stem-like cells from each diseased tissue sample relative to stem-like cells in normal samples in each tissue plotted against the malignancy continuum. Samples are colored based on if they are from different disease stage.
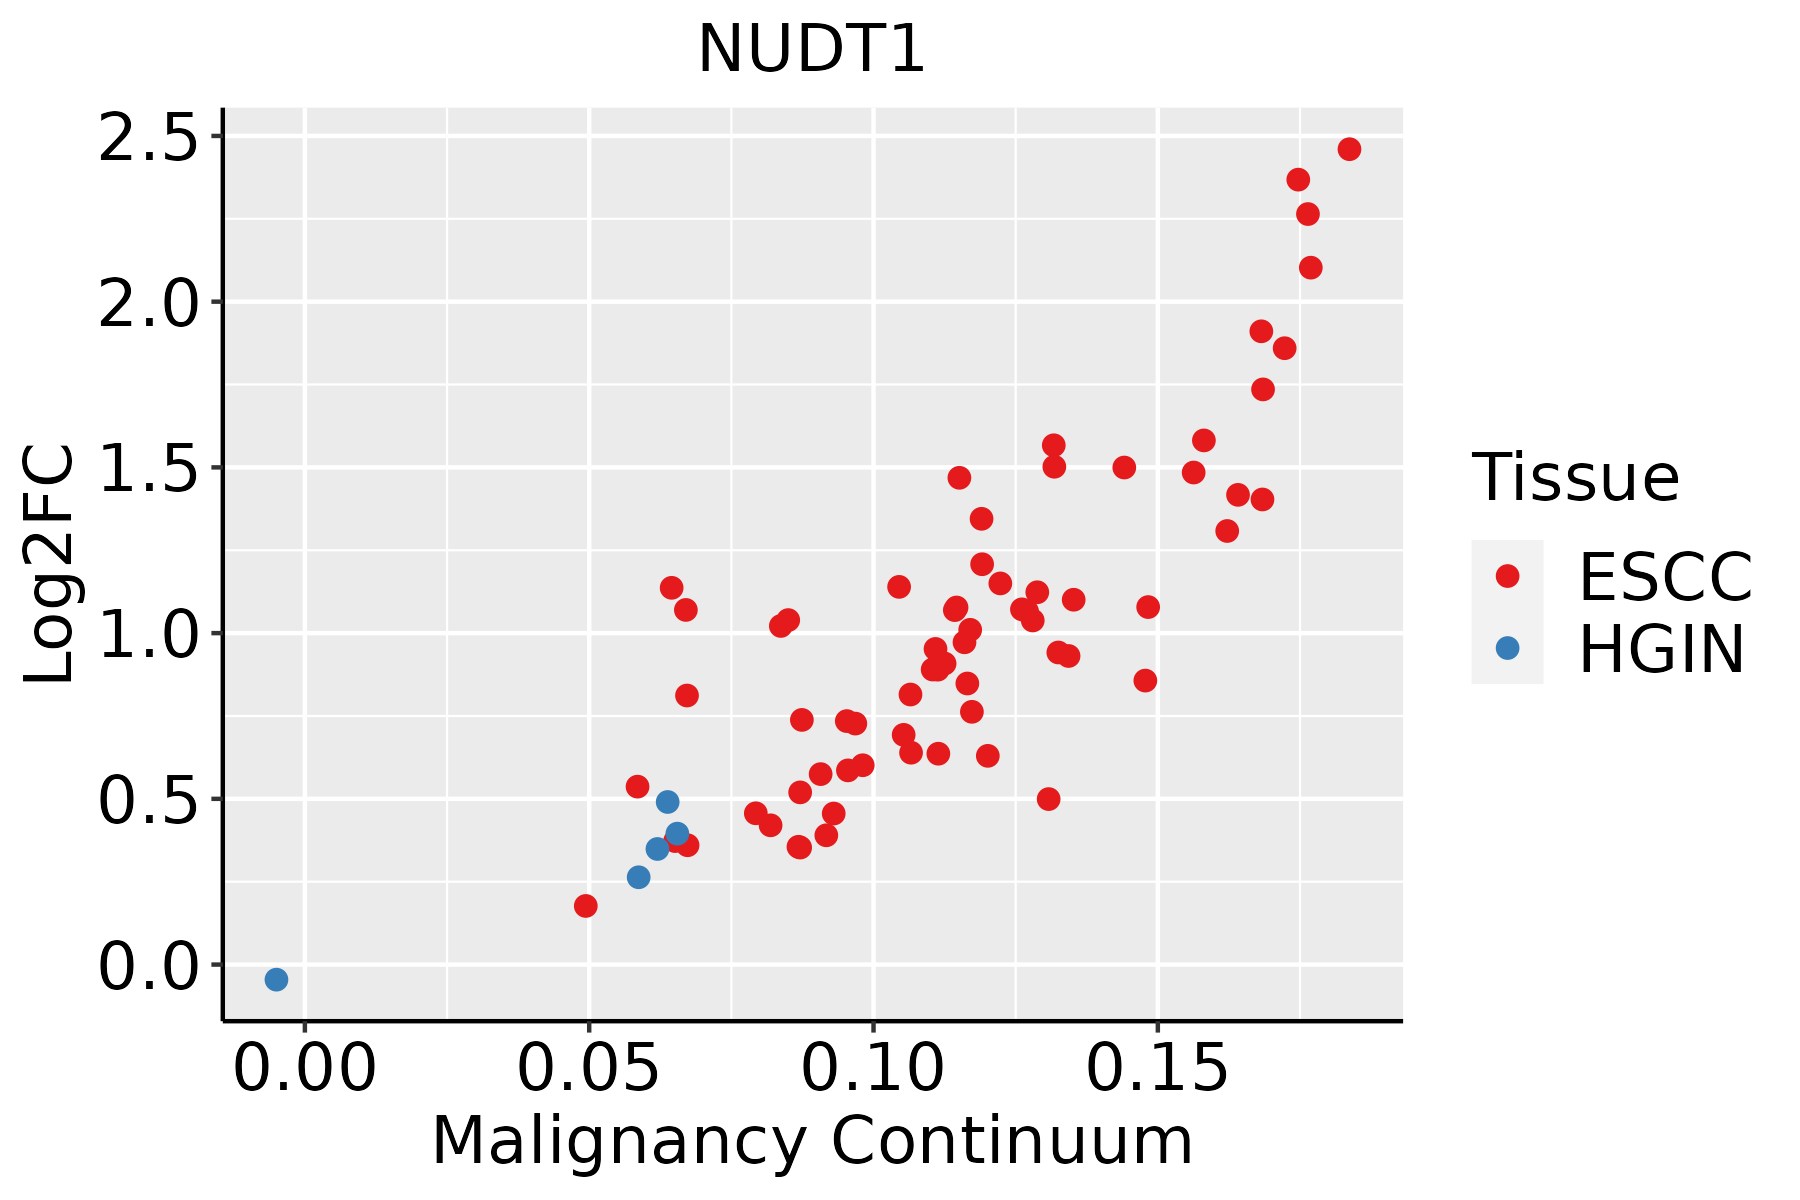
ESCC: Esophageal squamous cell carcinoma
HGIN: High-grade intraepithelial neoplasias
LGIN: Low-grade intraepithelial neoplasias
LiverThe image shows the transcriptomic changes along malignancy continuum.log2FC in expression of this searched gene in stem-like cells from each diseased tissue sample relative to stem-like cells in normal samples in each tissue plotted against the malignancy continuum. Samples are colored based on if they are from different disease stage.
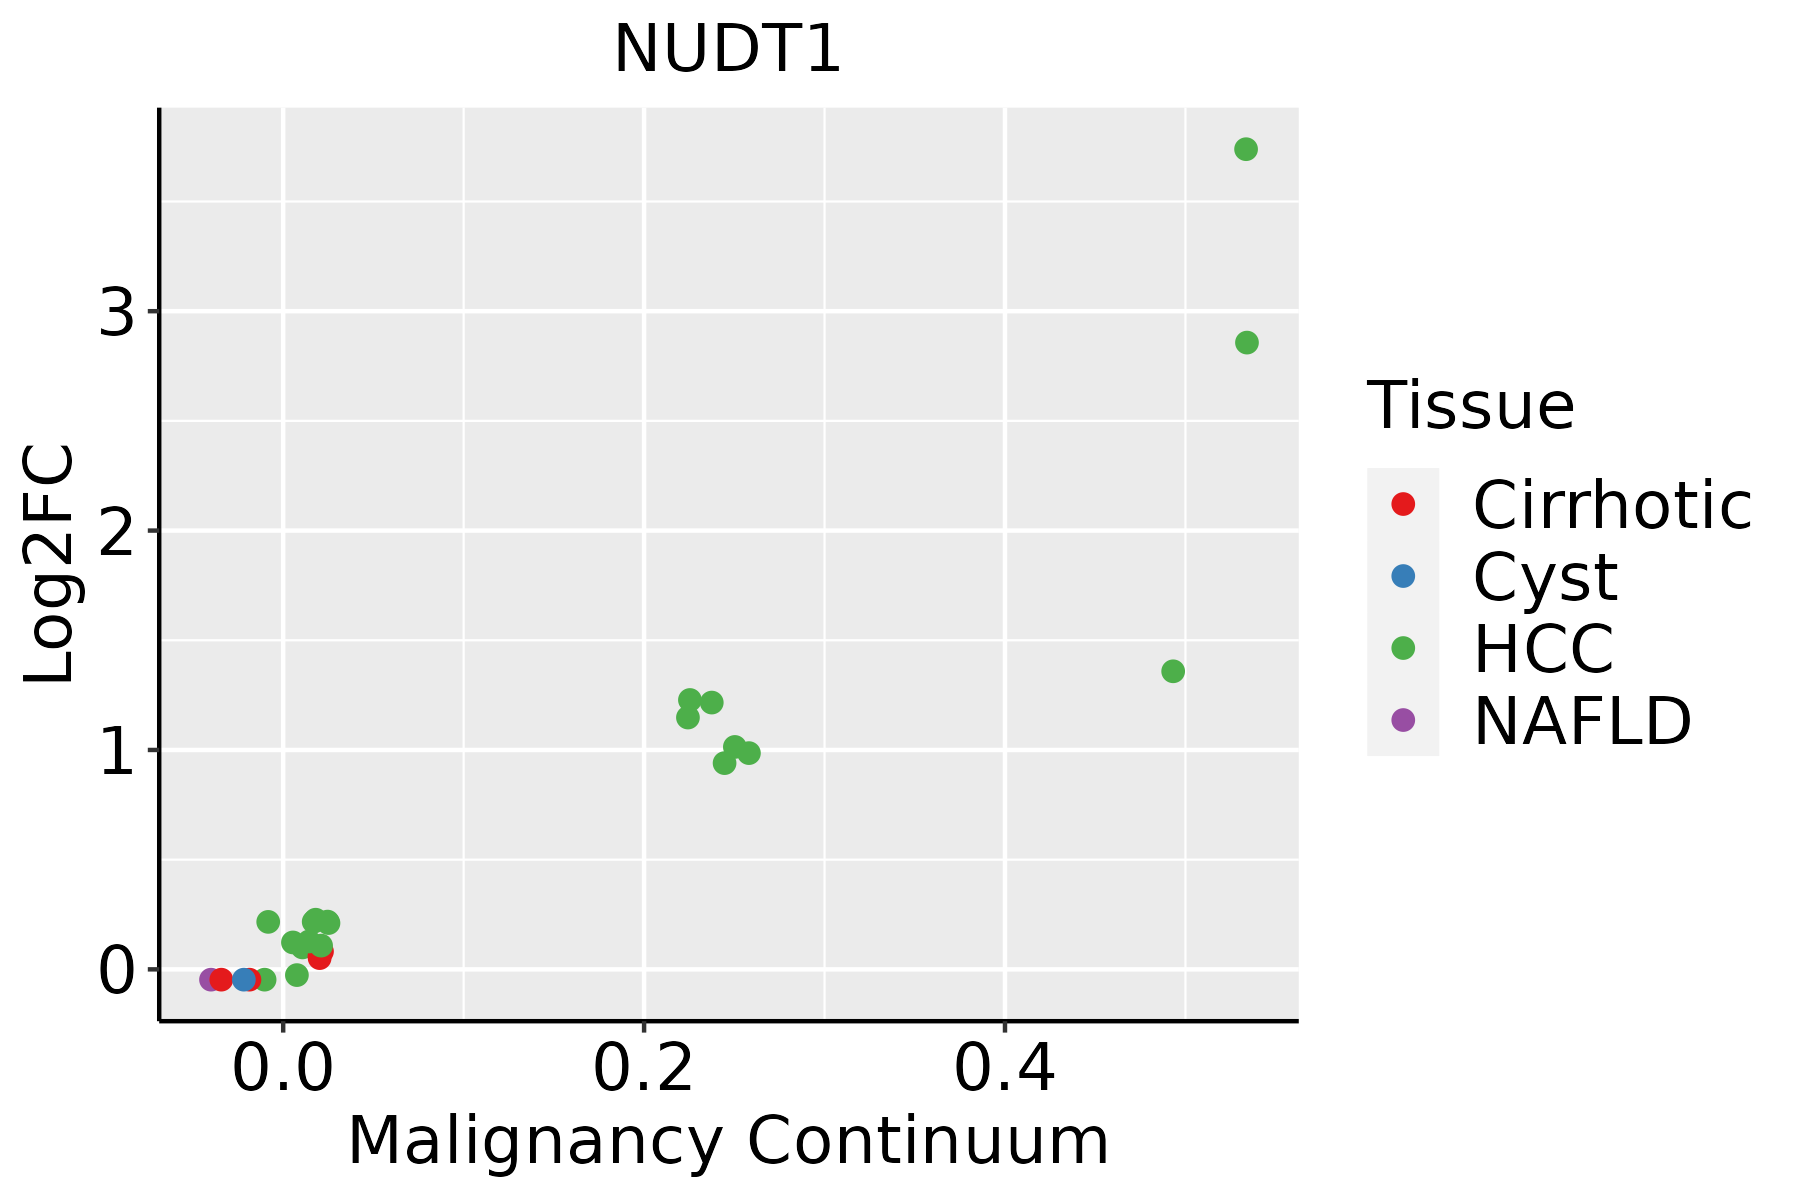
HCC: Hepatocellular carcinoma
NAFLD: Non-alcoholic fatty liver disease
Oral CavityThe image shows the transcriptomic changes along malignancy continuum.log2FC in expression of this searched gene in stem-like cells from each diseased tissue sample relative to stem-like cells in normal samples in each tissue plotted against the malignancy continuum. Samples are colored based on if they are from different disease stage.EOLP: Erosive Oral lichen planus
LP: leukoplakia
NEOLP: Non-erosive oral lichen planus
OSCC: Oral squamous cell carcinoma
SkinThe image shows the transcriptomic changes along malignancy continuum.log2FC in expression of this searched gene in stem-like cells from each diseased tissue sample relative to stem-like cells in normal samples in each tissue plotted against the malignancy continuum. Samples are colored based on if they are from different disease stage.
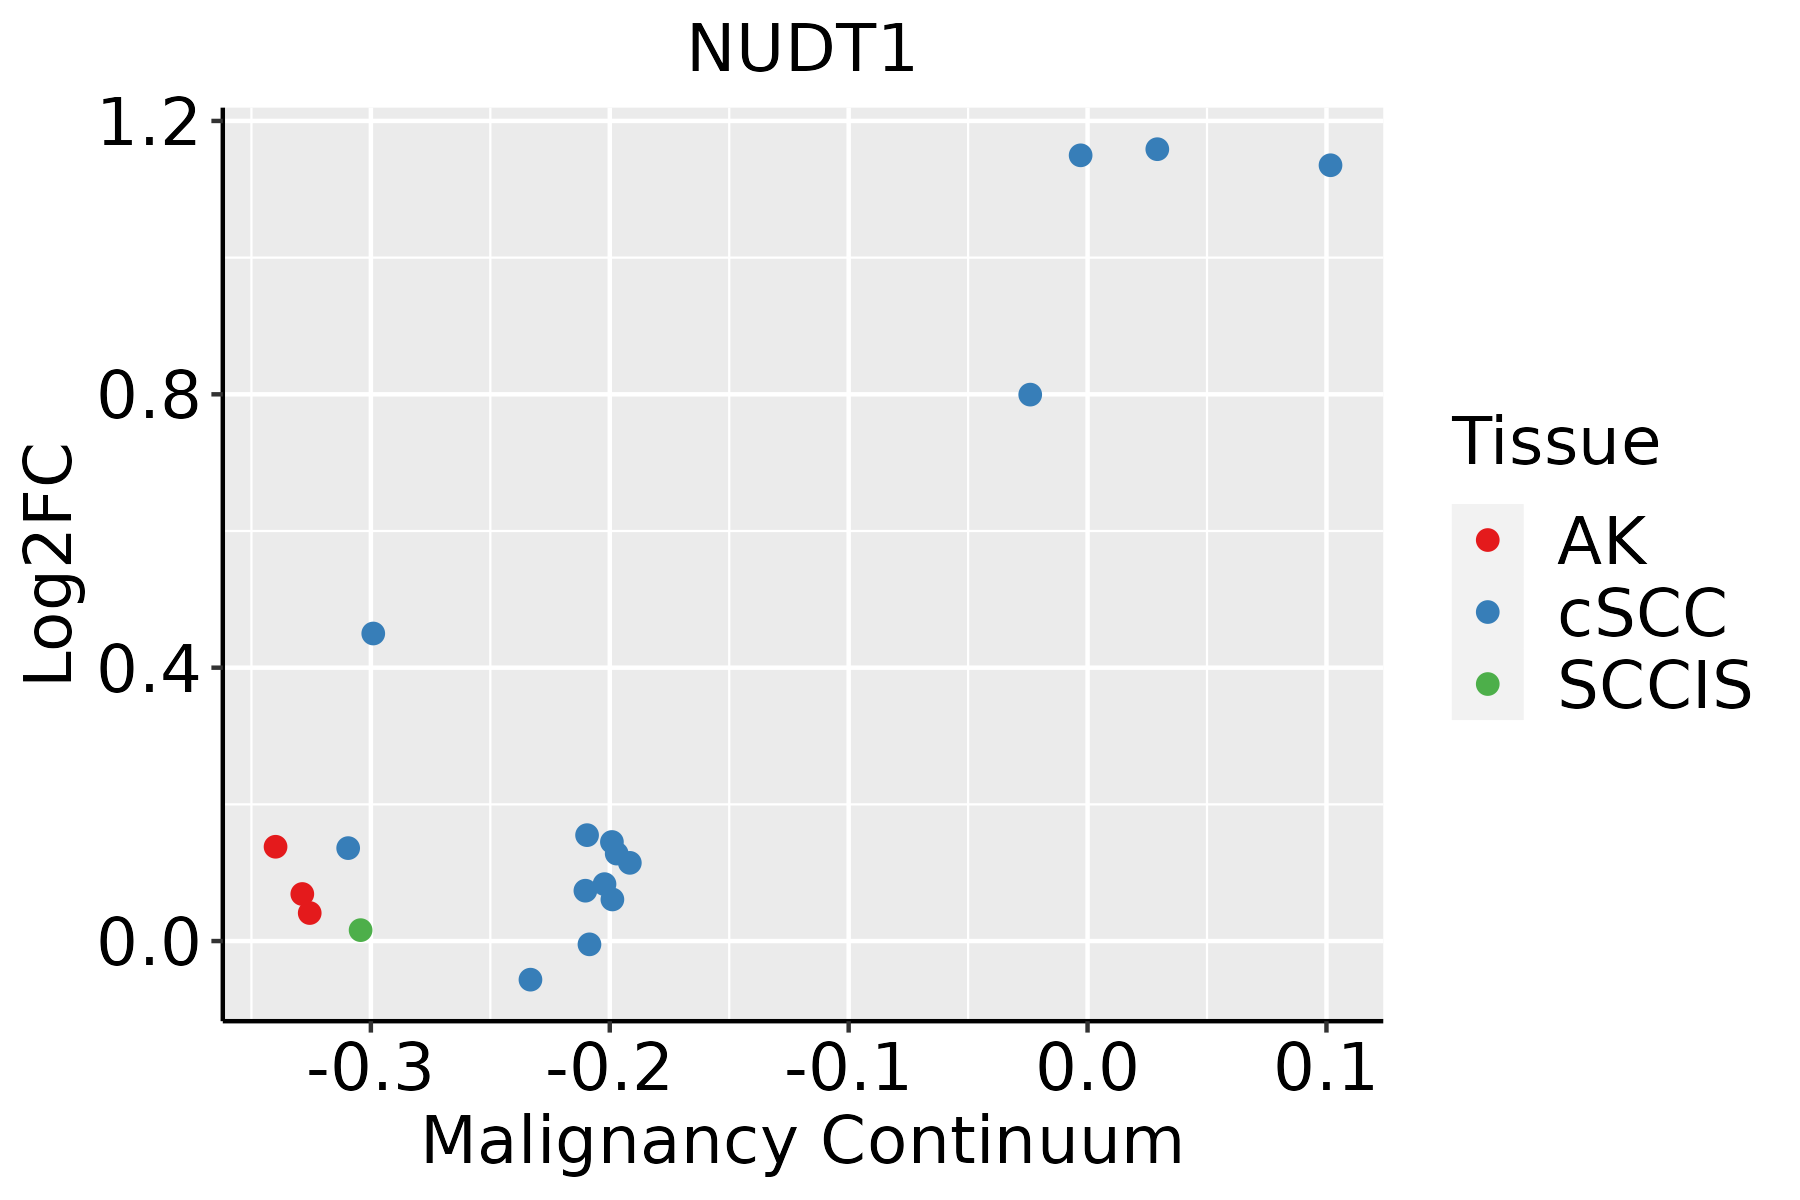
AK: Actinic keratosis
cSCC: Cutaneous squamous cell carcinoma
SCCIS:squamous cell carcinoma in situ
ThyroidThe image shows the transcriptomic changes along malignancy continuum.log2FC in expression of this searched gene in stem-like cells from each diseased tissue sample relative to stem-like cells in normal samples in each tissue plotted against the malignancy continuum. Samples are colored based on if they are from different disease stage.ATC: Anaplastic thyroid cancer
HT: Hashimoto's thyroiditis
PTC: Papillary thyroid cancer
∗log2FC in expression of this searched gene in stem-like cells from each diseased tissue sample relative to stem-like cells in normal samples in each tissue plotted against the malignancy continuum. Samples are colored based on if they are from different disease stage.

Top

Malignant transformation related pathway analysis

check buttonFind out the enriched GO biological processes and KEGG pathways involved in transition from healthy to precancer to cancer
check button Figure of enriched GO biological processes.
TissueDisease StageEnriched GO biological Processes
ColorectumADGO analysis - Figure of enriched GO biological processes: Top 15 enriched GO BP terms are showed in the bar plot of each disease state in each tissue. Each row represents a significant GO biological process which is colored according to the -log10(p.adjust).
ColorectumSERGO analysis - Figure of enriched GO biological processes: Top 15 enriched GO BP terms are showed in the bar plot of each disease state in each tissue. Each row represents a significant GO biological process which is colored according to the -log10(p.adjust).
ColorectumMSSGO analysis - Figure of enriched GO biological processes: Top 15 enriched GO BP terms are showed in the bar plot of each disease state in each tissue. Each row represents a significant GO biological process which is colored according to the -log10(p.adjust).
ColorectumMSI-HGO analysis - Figure of enriched GO biological processes: Top 15 enriched GO BP terms are showed in the bar plot of each disease state in each tissue. Each row represents a significant GO biological process which is colored according to the -log10(p.adjust).
ColorectumFAPGO analysis - Figure of enriched GO biological processes: Top 15 enriched GO BP terms are showed in the bar plot of each disease state in each tissue. Each row represents a significant GO biological process which is colored according to the -log10(p.adjust).
∗Top 15 enriched GO BP terms are showed in the bar plot of each disease state in each tissue. Each row represents a significant GO biological process which is colored according to the -log10(p.adjust).
Page: 1 2 3 4 5 6 7 8 9 

check button Enriched GO biological processes.
GO IDTissueDisease StageDescriptionGene RatioBg Ratiopvaluep.adjustCount
GO:0034655111SkincSCCnucleobase-containing compound catabolic process172/4864407/187234.11e-132.43e-11172
GO:000697929SkincSCCresponse to oxidative stress184/4864446/187238.57e-134.89e-11184
GO:0046700110SkincSCCheterocycle catabolic process178/4864445/187234.45e-112.13e-09178
GO:0044270110SkincSCCcellular nitrogen compound catabolic process179/4864451/187238.34e-113.79e-09179
GO:0019439110SkincSCCaromatic compound catabolic process183/4864467/187231.76e-107.68e-09183
GO:1901361110SkincSCCorganic cyclic compound catabolic process188/4864495/187231.92e-097.01e-08188
GO:000030228SkincSCCresponse to reactive oxygen species97/4864222/187236.88e-092.25e-0797
GO:007149628SkincSCCcellular response to external stimulus125/4864320/187231.63e-073.65e-06125
GO:005105217SkincSCCregulation of DNA metabolic process136/4864359/187233.83e-077.58e-06136
GO:0019693112SkincSCCribose phosphate metabolic process146/4864396/187239.28e-071.68e-05146
GO:000675324SkincSCCnucleoside phosphate metabolic process176/4864497/187231.55e-062.62e-05176
GO:000756827SkincSCCaging127/4864339/187231.80e-063.02e-05127
GO:000911724SkincSCCnucleotide metabolic process173/4864489/187232.03e-063.35e-05173
GO:0072521112SkincSCCpurine-containing compound metabolic process150/4864416/187232.88e-064.54e-05150
GO:2001020111SkincSCCregulation of response to DNA damage stimulus87/4864219/187235.38e-067.75e-0587
GO:000914126SkincSCCnucleoside triphosphate metabolic process51/4864112/187235.89e-068.44e-0551
GO:000914425SkincSCCpurine nucleoside triphosphate metabolic process42/486488/187239.13e-061.20e-0442
GO:001827910SkincSCCprotein N-linked glycosylation via asparagine16/486423/187231.47e-051.82e-0416
GO:003166825SkincSCCcellular response to extracellular stimulus94/4864246/187231.52e-051.87e-0494
GO:00064877SkincSCCprotein N-linked glycosylation33/486465/187231.63e-051.99e-0433
Page: 1 2 3 4 5 6 7 8 9 10 11 12 13 14 15 16 17 18 19 20 21 22 23 24 25 26 27 28 29 30 31 32 33 34 35 

check button Enriched KEGG pathways.
Pathway IDTissueDisease StageDescriptionGene RatioBg Ratiopvaluep.adjustqvalueCount
Page: 1 

Top

Cell-cell communication analysis

check buttonIdentification of potential cell-cell interactions between two cell types and their ligand-receptor pairs for different disease states
LigandReceptorLRpairPathwayTissueDisease Stage
Page: 1 

Top

Single-cell gene regulatory network inference analysis

check buttonFind out the significant the regulons (TFs) and the target genes of each regulon across cell types for different disease states
TFCell TypeTissueDisease StageTarget GeneRSSRegulon Activity
∗The dot plots of a searched regulon are shown for all cell subpopulations in each disease state of each tissue based on the regulon specific score inferred using pySCENIC and by calculating the average expression.
Page: 1 

Top

Somatic mutation of malignant transformation related genes

check buttonAnnotation of somatic variants for genes involved in malignant transformation
Hugo SymbolVariant ClassVariant ClassificationdbSNP RSHGVScHGVSpHGVSp ShortSWISSPROTBIOTYPESIFTPolyPhenTumor Sample BarcodeTissueHistologySexAgeStageTherapy TypesDrugsOutcome
NUDT1SNVMissense_Mutationrs374666803c.205N>Ap.Glu69Lysp.E69KP36639protein_codingtolerated(0.2)possibly_damaging(0.847)TCGA-AC-A2B8-01Breastbreast invasive carcinomaFemale>=65I/IIChemotherapychemoPD
NUDT1SNVMissense_Mutationrs746490760c.533N>Tp.Thr178Metp.T178MP36639protein_codingtolerated(0.08)benign(0.188)TCGA-C8-A12V-01Breastbreast invasive carcinomaFemale<65I/IIUnknownUnknownSD
NUDT1insertionNonsense_Mutationnovelc.483_484insCCTGCTCTGCGCCCACCCTAAAATGAGAAACACGGTCATGAGGATGAAATAp.Lys161_Phe162insProAlaLeuArgProProTerAsnGluLysHisGlyHisGluAspGluIlep.K161_F162insPALRPP*NEKHGHEDEIP36639protein_codingTCGA-A8-A07J-01Breastbreast invasive carcinomaFemale<65I/IIChemotherapy5-fluorouracilCR
NUDT1SNVMissense_Mutationc.190N>Cp.Glu64Glnp.E64QP36639protein_codingtolerated(0.43)benign(0.255)TCGA-C5-A1M6-01Cervixcervical & endocervical cancerFemale<65I/IIChemotherapycisplatinPD
NUDT1SNVMissense_Mutationrs747651511c.373C>Tp.Arg125Cysp.R125CP36639protein_codingtolerated(0.05)benign(0.073)TCGA-AA-A01R-01Colorectumcolon adenocarcinomaMale<65III/IVChemotherapy5-fluorouracilPD
NUDT1SNVMissense_Mutationnovelc.421N>Tp.Pro141Serp.P141SP36639protein_codingdeleterious(0.05)possibly_damaging(0.834)TCGA-E6-A1M0-01Endometriumuterine corpus endometrioid carcinomaFemale<65III/IVChemotherapycarboplatinSD
NUDT1SNVMissense_Mutationnovelc.466N>Gp.Phe156Valp.F156VP36639protein_codingdeleterious(0)benign(0.436)TCGA-EO-A22R-01Endometriumuterine corpus endometrioid carcinomaFemale<65I/IIUnknownUnknownSD
NUDT1SNVMissense_Mutationnovelc.124N>Ap.Leu42Ilep.L42IP36639protein_codingdeleterious(0)possibly_damaging(0.787)TCGA-EO-A22X-01Endometriumuterine corpus endometrioid carcinomaFemale<65III/IVUnspecificCarboplatinComplete Response
NUDT1SNVMissense_Mutationnovelc.291N>Ap.Phe97Leup.F97LP36639protein_codingdeleterious(0)probably_damaging(0.998)TCGA-QF-A5YS-01Endometriumuterine corpus endometrioid carcinomaFemale<65I/IIChemotherapycarboplatinCR
NUDT1SNVMissense_Mutationrs115556911c.367N>Ap.Glu123Lysp.E123KP36639protein_codingdeleterious(0.03)probably_damaging(0.999)TCGA-44-6779-01Lunglung adenocarcinomaFemale<65I/IIChemotherapytaxolPD
Page: 1 2 

Top

Related drugs of malignant transformation related genes

check buttonIdentification of chemicals and drugs interact with genes involved in malignant transfromation
(DGIdb 4.0)
Entrez IDSymbolCategoryInteraction TypesDrug Claim NameDrug NamePMIDs
4521NUDT1DNA REPAIR, ENZYME8-oxo-dgtp26238318
Page: 1