| Tissue | Expression Dynamics | Abbreviation |
| Cervix | 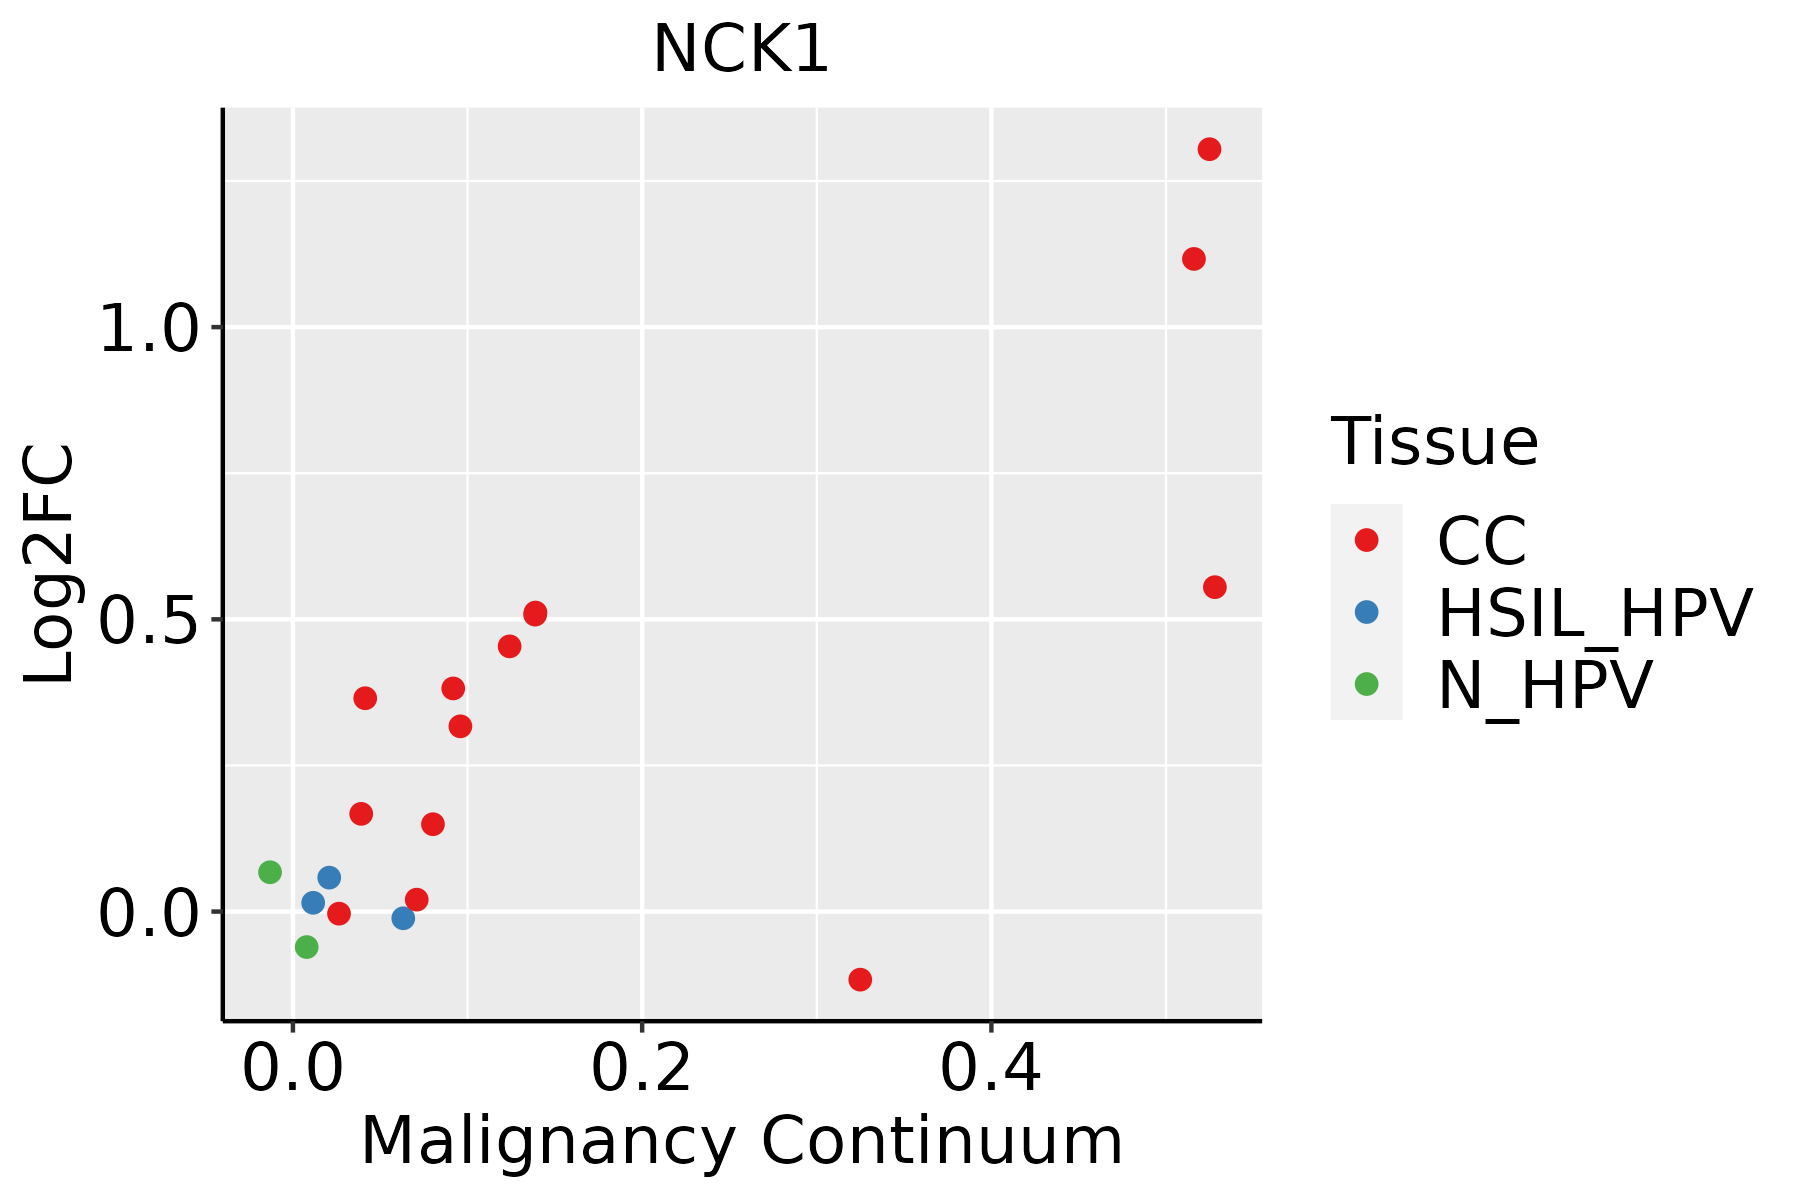 | CC: Cervix cancer |
| HSIL_HPV: HPV-infected high-grade squamous intraepithelial lesions |
| N_HPV: HPV-infected normal cervix |
| Esophagus |  | ESCC: Esophageal squamous cell carcinoma |
| HGIN: High-grade intraepithelial neoplasias |
| LGIN: Low-grade intraepithelial neoplasias |
| Liver | 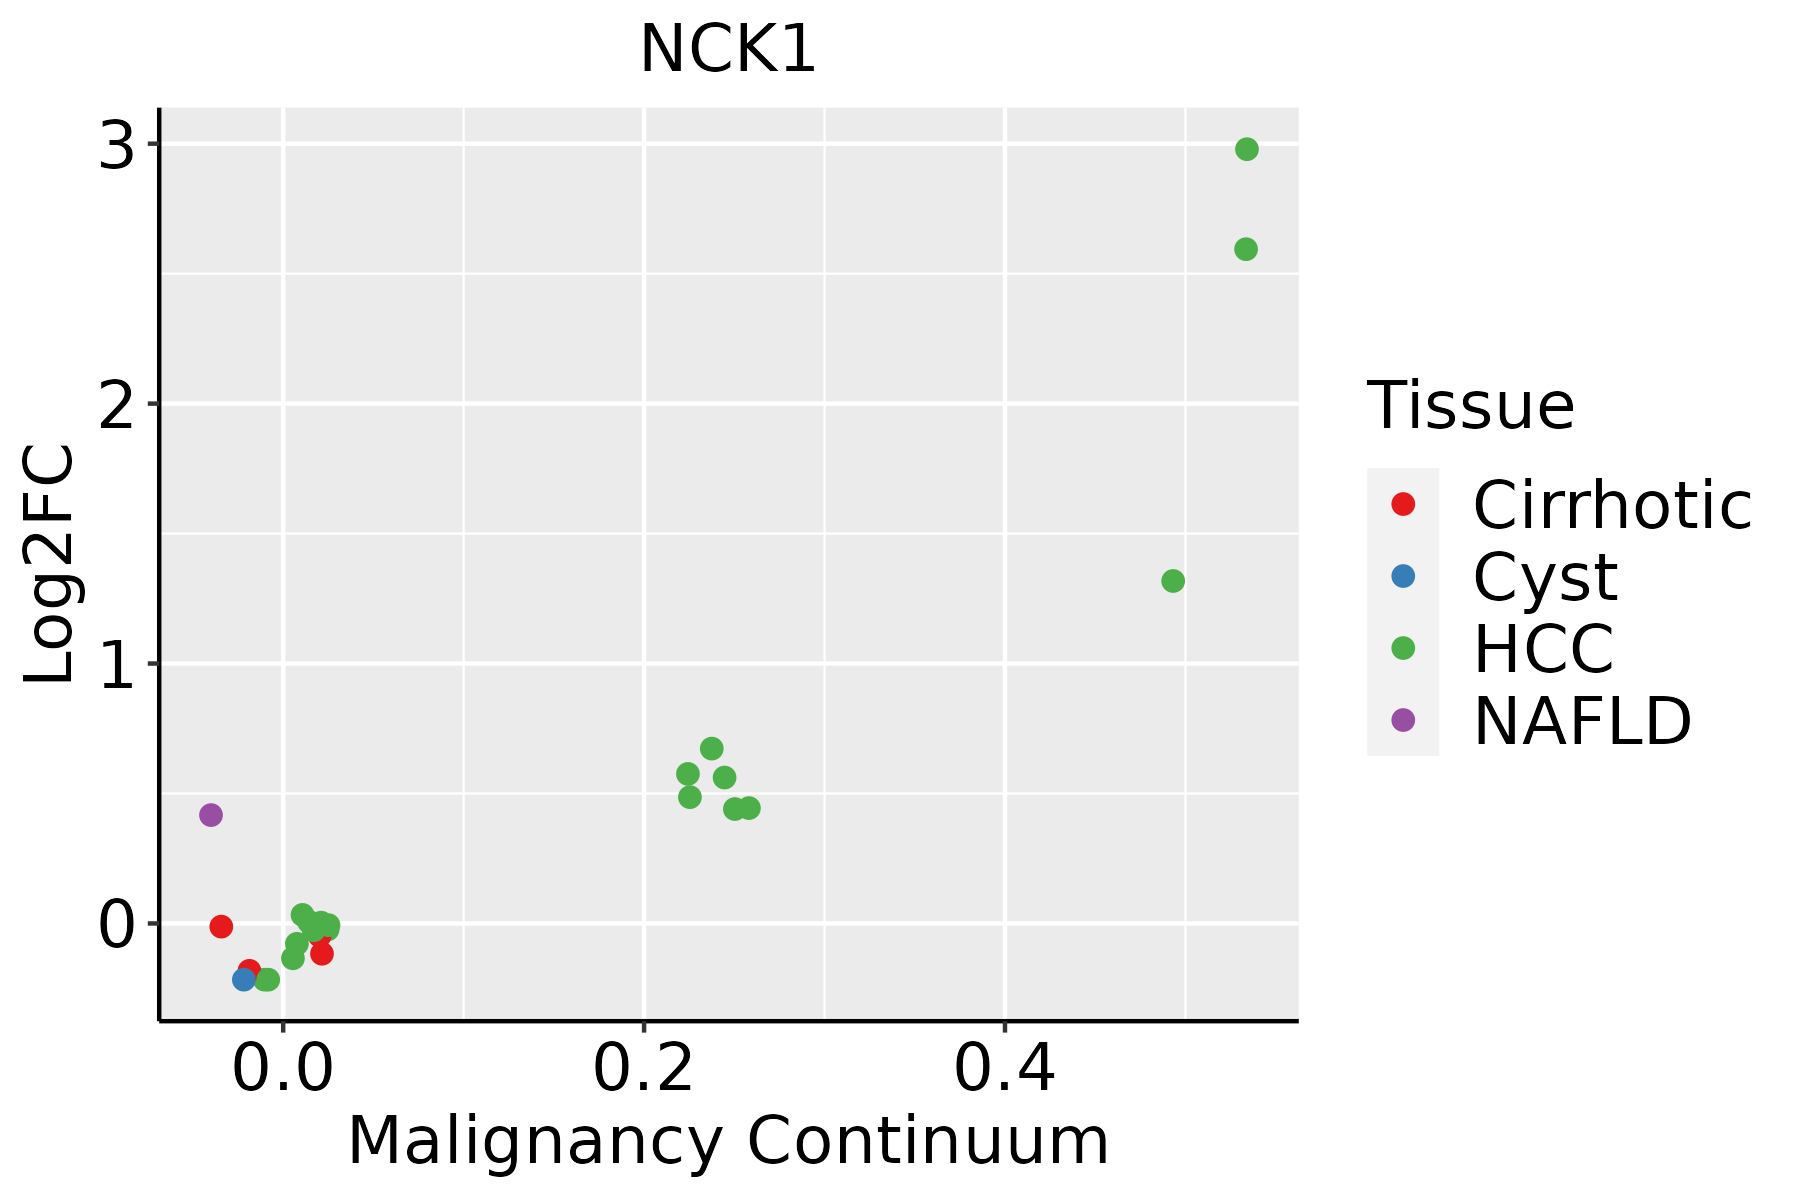 | HCC: Hepatocellular carcinoma |
| NAFLD: Non-alcoholic fatty liver disease |
| Oral Cavity | 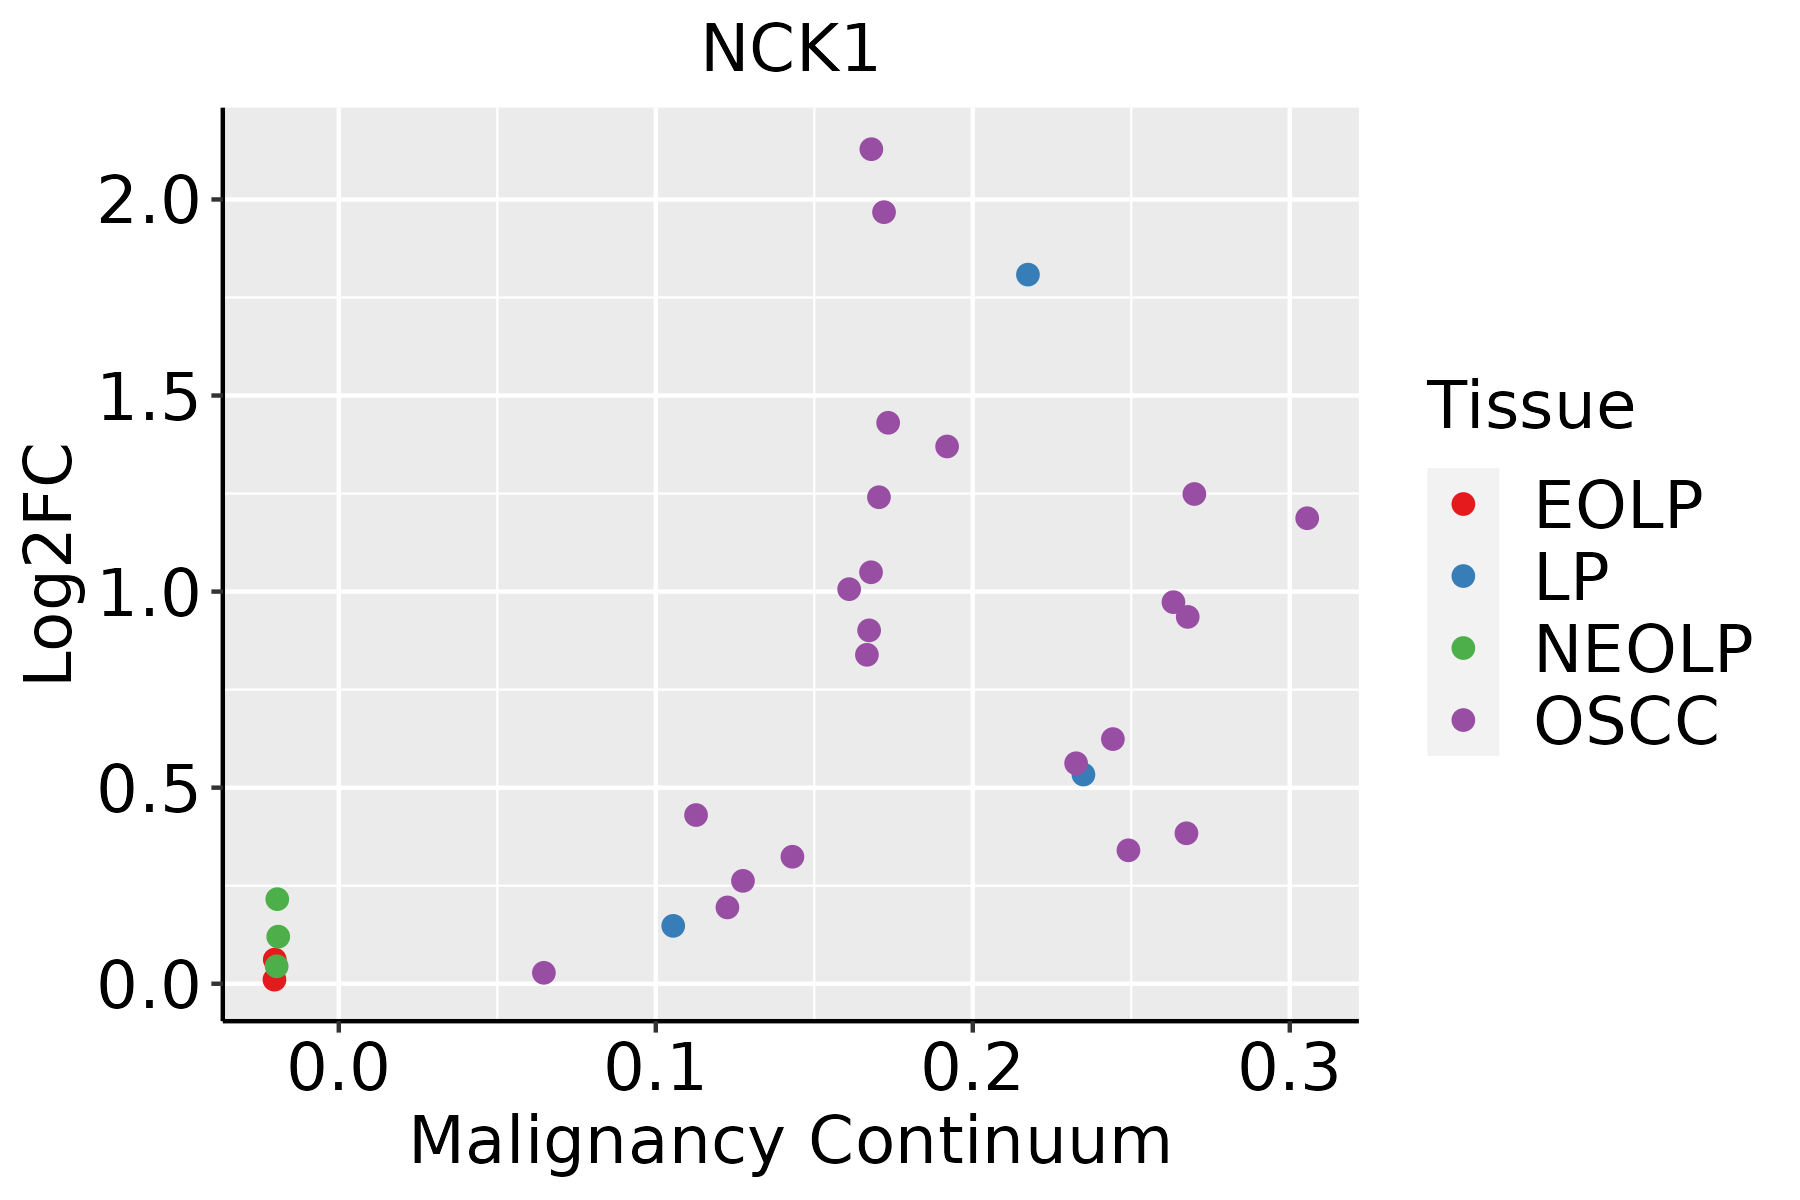 | EOLP: Erosive Oral lichen planus |
| LP: leukoplakia |
| NEOLP: Non-erosive oral lichen planus |
| OSCC: Oral squamous cell carcinoma |
| Skin | 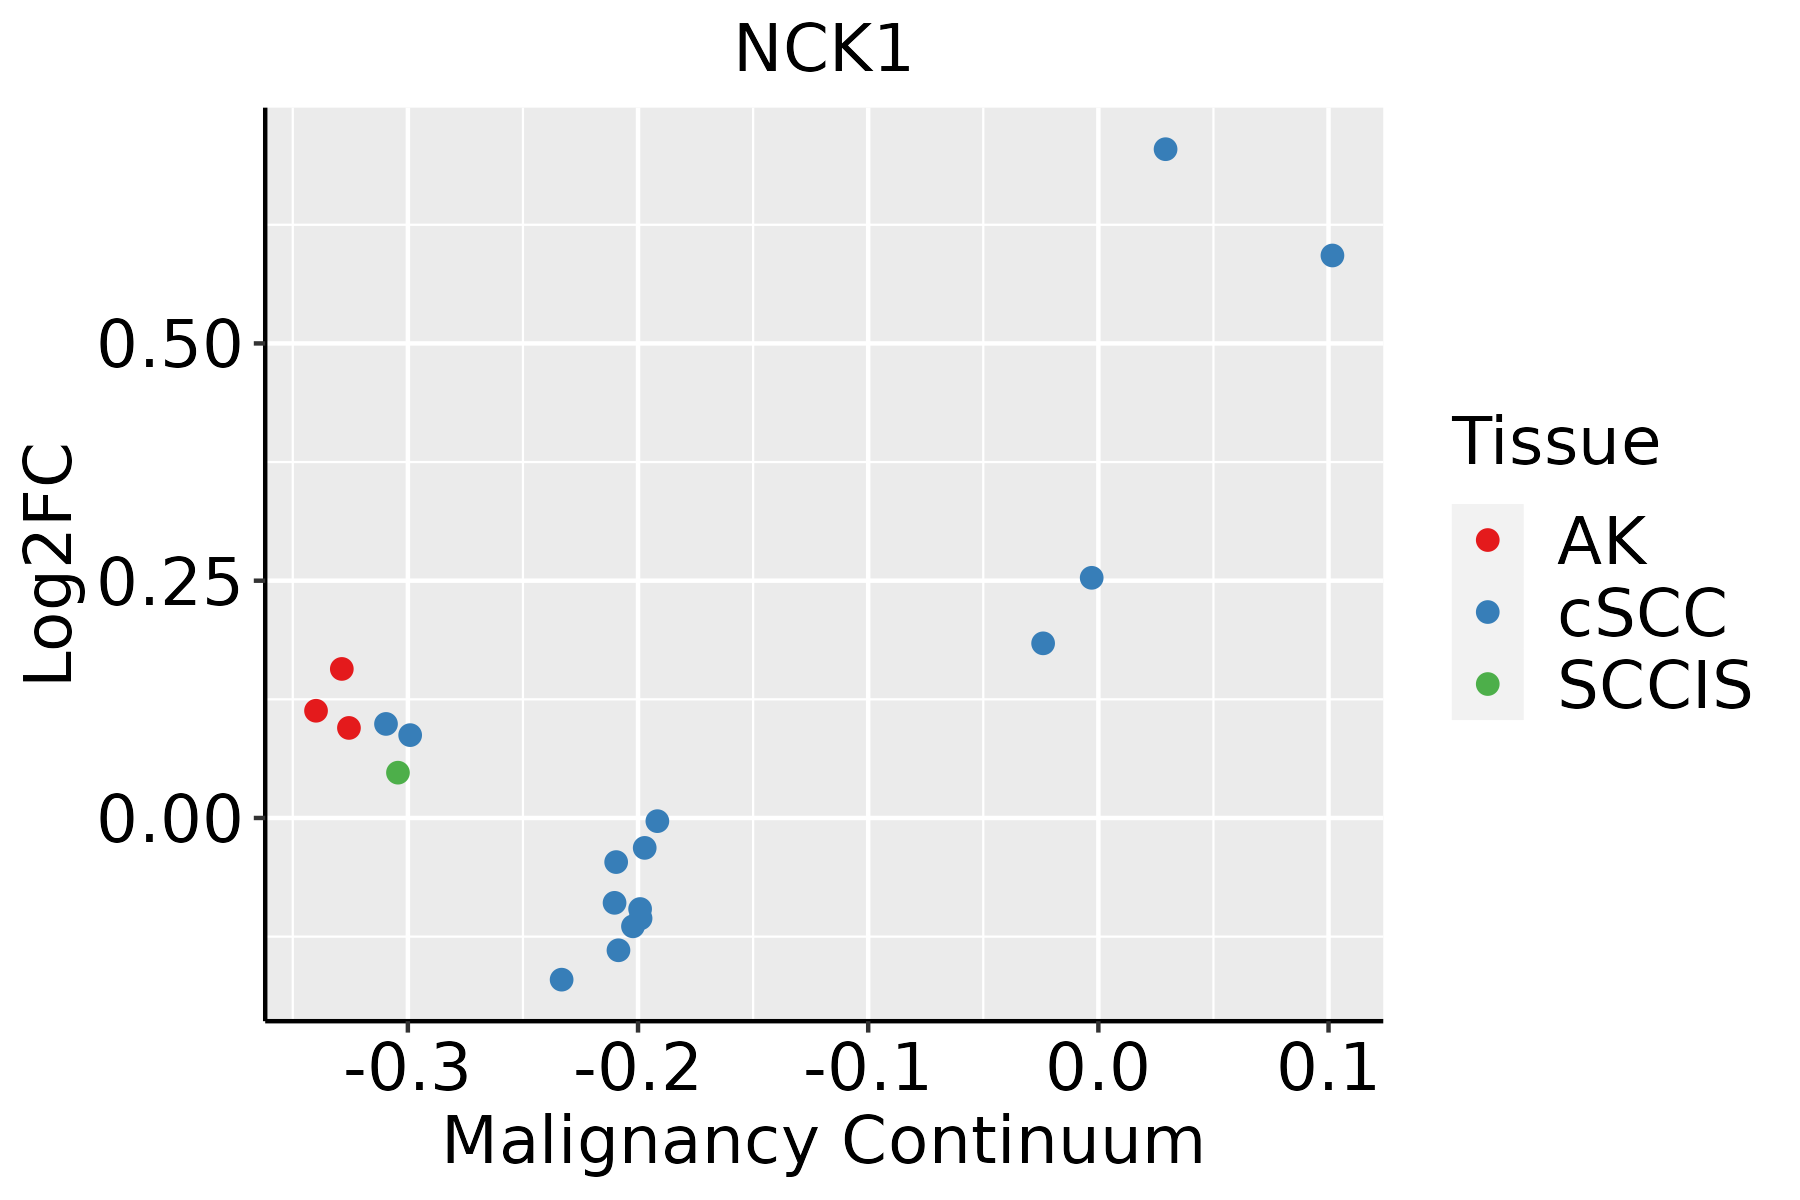 | AK: Actinic keratosis |
| cSCC: Cutaneous squamous cell carcinoma |
| SCCIS:squamous cell carcinoma in situ |
| GO ID | Tissue | Disease Stage | Description | Gene Ratio | Bg Ratio | pvalue | p.adjust | Count |
| GO:0034976110 | Oral cavity | LP | response to endoplasmic reticulum stress | 133/4623 | 256/18723 | 3.84e-21 | 9.24e-19 | 133 |
| GO:2001233110 | Oral cavity | LP | regulation of apoptotic signaling pathway | 168/4623 | 356/18723 | 1.35e-20 | 3.02e-18 | 168 |
| GO:2001242110 | Oral cavity | LP | regulation of intrinsic apoptotic signaling pathway | 95/4623 | 164/18723 | 9.85e-20 | 1.99e-17 | 95 |
| GO:000641319 | Oral cavity | LP | translational initiation | 75/4623 | 118/18723 | 3.96e-19 | 7.52e-17 | 75 |
| GO:0035966110 | Oral cavity | LP | response to topologically incorrect protein | 87/4623 | 159/18723 | 4.31e-16 | 6.28e-14 | 87 |
| GO:0006986110 | Oral cavity | LP | response to unfolded protein | 76/4623 | 137/18723 | 1.14e-14 | 1.35e-12 | 76 |
| GO:000644616 | Oral cavity | LP | regulation of translational initiation | 48/4623 | 79/18723 | 1.04e-11 | 7.66e-10 | 48 |
| GO:0035967110 | Oral cavity | LP | cellular response to topologically incorrect protein | 62/4623 | 116/18723 | 2.69e-11 | 1.81e-09 | 62 |
| GO:000218319 | Oral cavity | LP | cytoplasmic translational initiation | 27/4623 | 34/18723 | 3.04e-11 | 2.00e-09 | 27 |
| GO:0034620110 | Oral cavity | LP | cellular response to unfolded protein | 53/4623 | 96/18723 | 1.48e-10 | 8.27e-09 | 53 |
| GO:0045727110 | Oral cavity | LP | positive regulation of translation | 68/4623 | 136/18723 | 1.53e-10 | 8.51e-09 | 68 |
| GO:0043254110 | Oral cavity | LP | regulation of protein-containing complex assembly | 163/4623 | 428/18723 | 3.72e-10 | 1.92e-08 | 163 |
| GO:0006417110 | Oral cavity | LP | regulation of translation | 175/4623 | 468/18723 | 4.49e-10 | 2.22e-08 | 175 |
| GO:0034250110 | Oral cavity | LP | positive regulation of cellular amide metabolic process | 76/4623 | 162/18723 | 6.11e-10 | 2.97e-08 | 76 |
| GO:200123518 | Oral cavity | LP | positive regulation of apoptotic signaling pathway | 63/4623 | 126/18723 | 7.17e-10 | 3.43e-08 | 63 |
| GO:1905897110 | Oral cavity | LP | regulation of response to endoplasmic reticulum stress | 45/4623 | 82/18723 | 4.58e-09 | 1.91e-07 | 45 |
| GO:0031334110 | Oral cavity | LP | positive regulation of protein-containing complex assembly | 99/4623 | 237/18723 | 4.83e-09 | 2.00e-07 | 99 |
| GO:000698415 | Oral cavity | LP | ER-nucleus signaling pathway | 30/4623 | 46/18723 | 7.25e-09 | 2.91e-07 | 30 |
| GO:200124416 | Oral cavity | LP | positive regulation of intrinsic apoptotic signaling pathway | 33/4623 | 58/18723 | 1.63e-07 | 5.11e-06 | 33 |
| GO:0051258110 | Oral cavity | LP | protein polymerization | 113/4623 | 297/18723 | 1.90e-07 | 5.92e-06 | 113 |
| Pathway ID | Tissue | Disease Stage | Description | Gene Ratio | Bg Ratio | pvalue | p.adjust | qvalue | Count |
| hsa0513020 | Cervix | CC | Pathogenic Escherichia coli infection | 63/1267 | 197/8465 | 9.28e-10 | 2.00e-08 | 1.19e-08 | 63 |
| hsa0401210 | Cervix | CC | ErbB signaling pathway | 28/1267 | 85/8465 | 2.40e-05 | 1.82e-04 | 1.08e-04 | 28 |
| hsa043609 | Cervix | CC | Axon guidance | 47/1267 | 182/8465 | 8.13e-05 | 5.38e-04 | 3.18e-04 | 47 |
| hsa046604 | Cervix | CC | T cell receptor signaling pathway | 25/1267 | 104/8465 | 9.52e-03 | 2.94e-02 | 1.74e-02 | 25 |
| hsa05130110 | Cervix | CC | Pathogenic Escherichia coli infection | 63/1267 | 197/8465 | 9.28e-10 | 2.00e-08 | 1.19e-08 | 63 |
| hsa0401213 | Cervix | CC | ErbB signaling pathway | 28/1267 | 85/8465 | 2.40e-05 | 1.82e-04 | 1.08e-04 | 28 |
| hsa0436012 | Cervix | CC | Axon guidance | 47/1267 | 182/8465 | 8.13e-05 | 5.38e-04 | 3.18e-04 | 47 |
| hsa0466011 | Cervix | CC | T cell receptor signaling pathway | 25/1267 | 104/8465 | 9.52e-03 | 2.94e-02 | 1.74e-02 | 25 |
| hsa0513039 | Esophagus | HGIN | Pathogenic Escherichia coli infection | 54/1383 | 197/8465 | 4.91e-05 | 6.15e-04 | 4.89e-04 | 54 |
| hsa05130115 | Esophagus | HGIN | Pathogenic Escherichia coli infection | 54/1383 | 197/8465 | 4.91e-05 | 6.15e-04 | 4.89e-04 | 54 |
| hsa05130211 | Esophagus | ESCC | Pathogenic Escherichia coli infection | 142/4205 | 197/8465 | 8.21e-11 | 1.06e-09 | 5.42e-10 | 142 |
| hsa0401218 | Esophagus | ESCC | ErbB signaling pathway | 56/4205 | 85/8465 | 1.78e-03 | 5.24e-03 | 2.68e-03 | 56 |
| hsa0436016 | Esophagus | ESCC | Axon guidance | 108/4205 | 182/8465 | 5.13e-03 | 1.30e-02 | 6.67e-03 | 108 |
| hsa046607 | Esophagus | ESCC | T cell receptor signaling pathway | 63/4205 | 104/8465 | 1.60e-02 | 3.60e-02 | 1.84e-02 | 63 |
| hsa05130310 | Esophagus | ESCC | Pathogenic Escherichia coli infection | 142/4205 | 197/8465 | 8.21e-11 | 1.06e-09 | 5.42e-10 | 142 |
| hsa0401219 | Esophagus | ESCC | ErbB signaling pathway | 56/4205 | 85/8465 | 1.78e-03 | 5.24e-03 | 2.68e-03 | 56 |
| hsa0436017 | Esophagus | ESCC | Axon guidance | 108/4205 | 182/8465 | 5.13e-03 | 1.30e-02 | 6.67e-03 | 108 |
| hsa0466013 | Esophagus | ESCC | T cell receptor signaling pathway | 63/4205 | 104/8465 | 1.60e-02 | 3.60e-02 | 1.84e-02 | 63 |
| hsa0513014 | Liver | NAFLD | Pathogenic Escherichia coli infection | 45/1043 | 197/8465 | 2.31e-05 | 6.88e-04 | 5.54e-04 | 45 |
| hsa0513015 | Liver | NAFLD | Pathogenic Escherichia coli infection | 45/1043 | 197/8465 | 2.31e-05 | 6.88e-04 | 5.54e-04 | 45 |
| Hugo Symbol | Variant Class | Variant Classification | dbSNP RS | HGVSc | HGVSp | HGVSp Short | SWISSPROT | BIOTYPE | SIFT | PolyPhen | Tumor Sample Barcode | Tissue | Histology | Sex | Age | Stage | Therapy Types | Drugs | Outcome |
| NCK1 | SNV | Missense_Mutation | novel | c.599N>T | p.Pro200Leu | p.P200L | P16333 | protein_coding | tolerated(0.06) | benign(0.302) | TCGA-AO-A03O-01 | Breast | breast invasive carcinoma | Female | >=65 | I/II | Chemotherapy | doxorubicin | SD |
| NCK1 | SNV | Missense_Mutation | novel | c.809G>A | p.Arg270Lys | p.R270K | P16333 | protein_coding | tolerated(0.98) | benign(0.001) | TCGA-2W-A8YY-01 | Cervix | cervical & endocervical cancer | Female | <65 | I/II | Chemotherapy | cisplatin | CR |
| NCK1 | SNV | Missense_Mutation | rs749985486 | c.773N>T | p.Gly258Val | p.G258V | P16333 | protein_coding | deleterious(0.04) | benign(0.011) | TCGA-C5-A3HE-01 | Cervix | cervical & endocervical cancer | Female | <65 | I/II | Unknown | Unknown | PD |
| NCK1 | SNV | Missense_Mutation | novel | c.649N>G | p.Met217Val | p.M217V | P16333 | protein_coding | deleterious(0.01) | benign(0.086) | TCGA-C5-A905-01 | Cervix | cervical & endocervical cancer | Female | <65 | I/II | Unknown | Unknown | SD |
| NCK1 | SNV | Missense_Mutation | | c.256N>A | p.Val86Met | p.V86M | P16333 | protein_coding | tolerated(0.17) | benign(0.001) | TCGA-DS-A0VN-01 | Cervix | cervical & endocervical cancer | Female | <65 | I/II | Chemotherapy | cisplatin | SD |
| NCK1 | SNV | Missense_Mutation | | c.314N>G | p.Tyr105Cys | p.Y105C | P16333 | protein_coding | tolerated(0.07) | possibly_damaging(0.827) | TCGA-IR-A3LC-01 | Cervix | cervical & endocervical cancer | Female | <65 | I/II | Unspecific | Cisplatin | Complete Response |
| NCK1 | SNV | Missense_Mutation | | c.358N>A | p.Glu120Lys | p.E120K | P16333 | protein_coding | tolerated(0.21) | benign(0.348) | TCGA-MA-AA41-01 | Cervix | cervical & endocervical cancer | Female | <65 | I/II | Unknown | Unknown | SD |
| NCK1 | SNV | Missense_Mutation | | c.531N>T | p.Glu177Asp | p.E177D | P16333 | protein_coding | tolerated(0.41) | benign(0.001) | TCGA-AG-A002-01 | Colorectum | rectum adenocarcinoma | Male | <65 | I/II | Unknown | Unknown | SD |
| NCK1 | SNV | Missense_Mutation | novel | c.1099N>C | p.Gly367Arg | p.G367R | P16333 | protein_coding | deleterious(0) | probably_damaging(0.985) | TCGA-A5-A0GG-01 | Endometrium | uterine corpus endometrioid carcinoma | Female | >=65 | I/II | Unknown | Unknown | SD |
| NCK1 | SNV | Missense_Mutation | novel | c.616G>A | p.Asp206Asn | p.D206N | P16333 | protein_coding | deleterious(0.03) | possibly_damaging(0.456) | TCGA-A5-A1OK-01 | Endometrium | uterine corpus endometrioid carcinoma | Female | <65 | III/IV | Chemotherapy | taxol | SD |


