| Tissue | Expression Dynamics | Abbreviation |
| Esophagus | 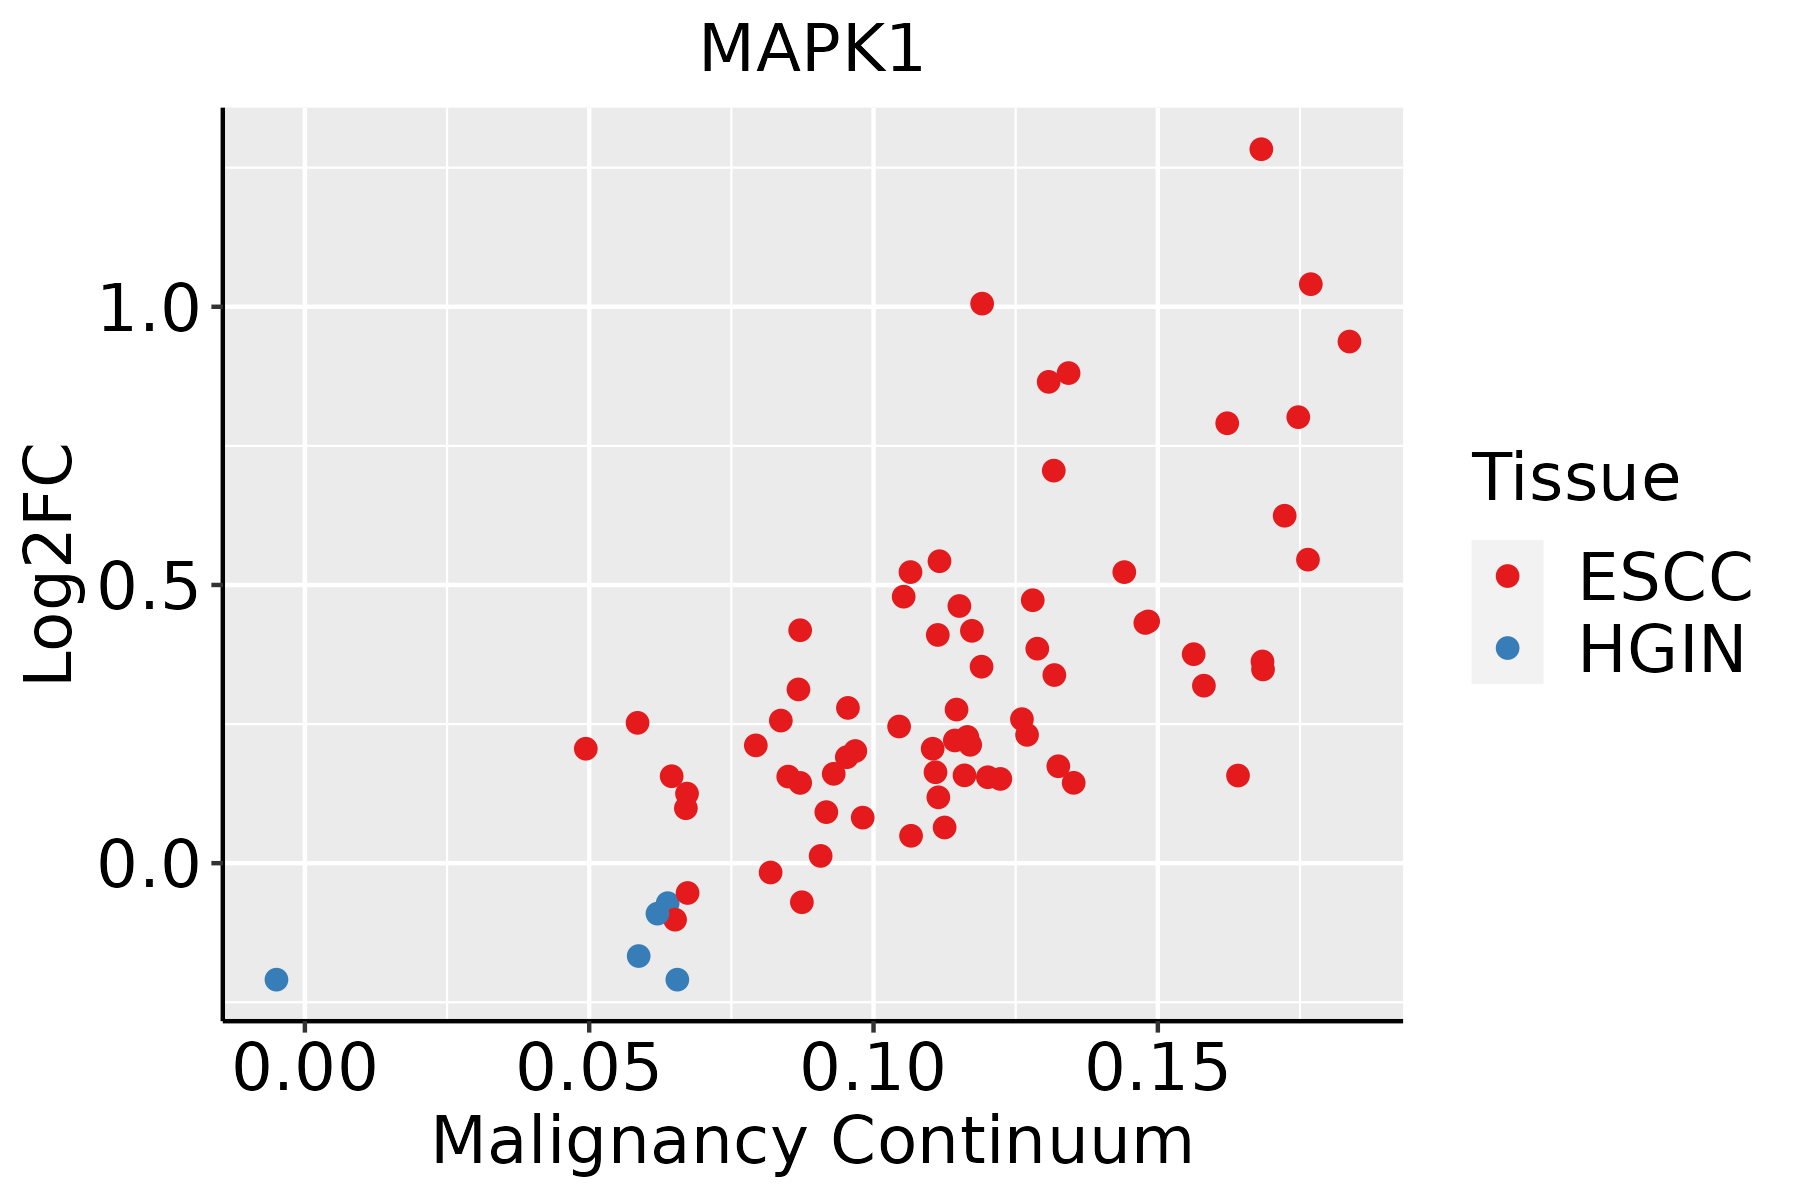 | ESCC: Esophageal squamous cell carcinoma |
| HGIN: High-grade intraepithelial neoplasias |
| LGIN: Low-grade intraepithelial neoplasias |
| Liver | 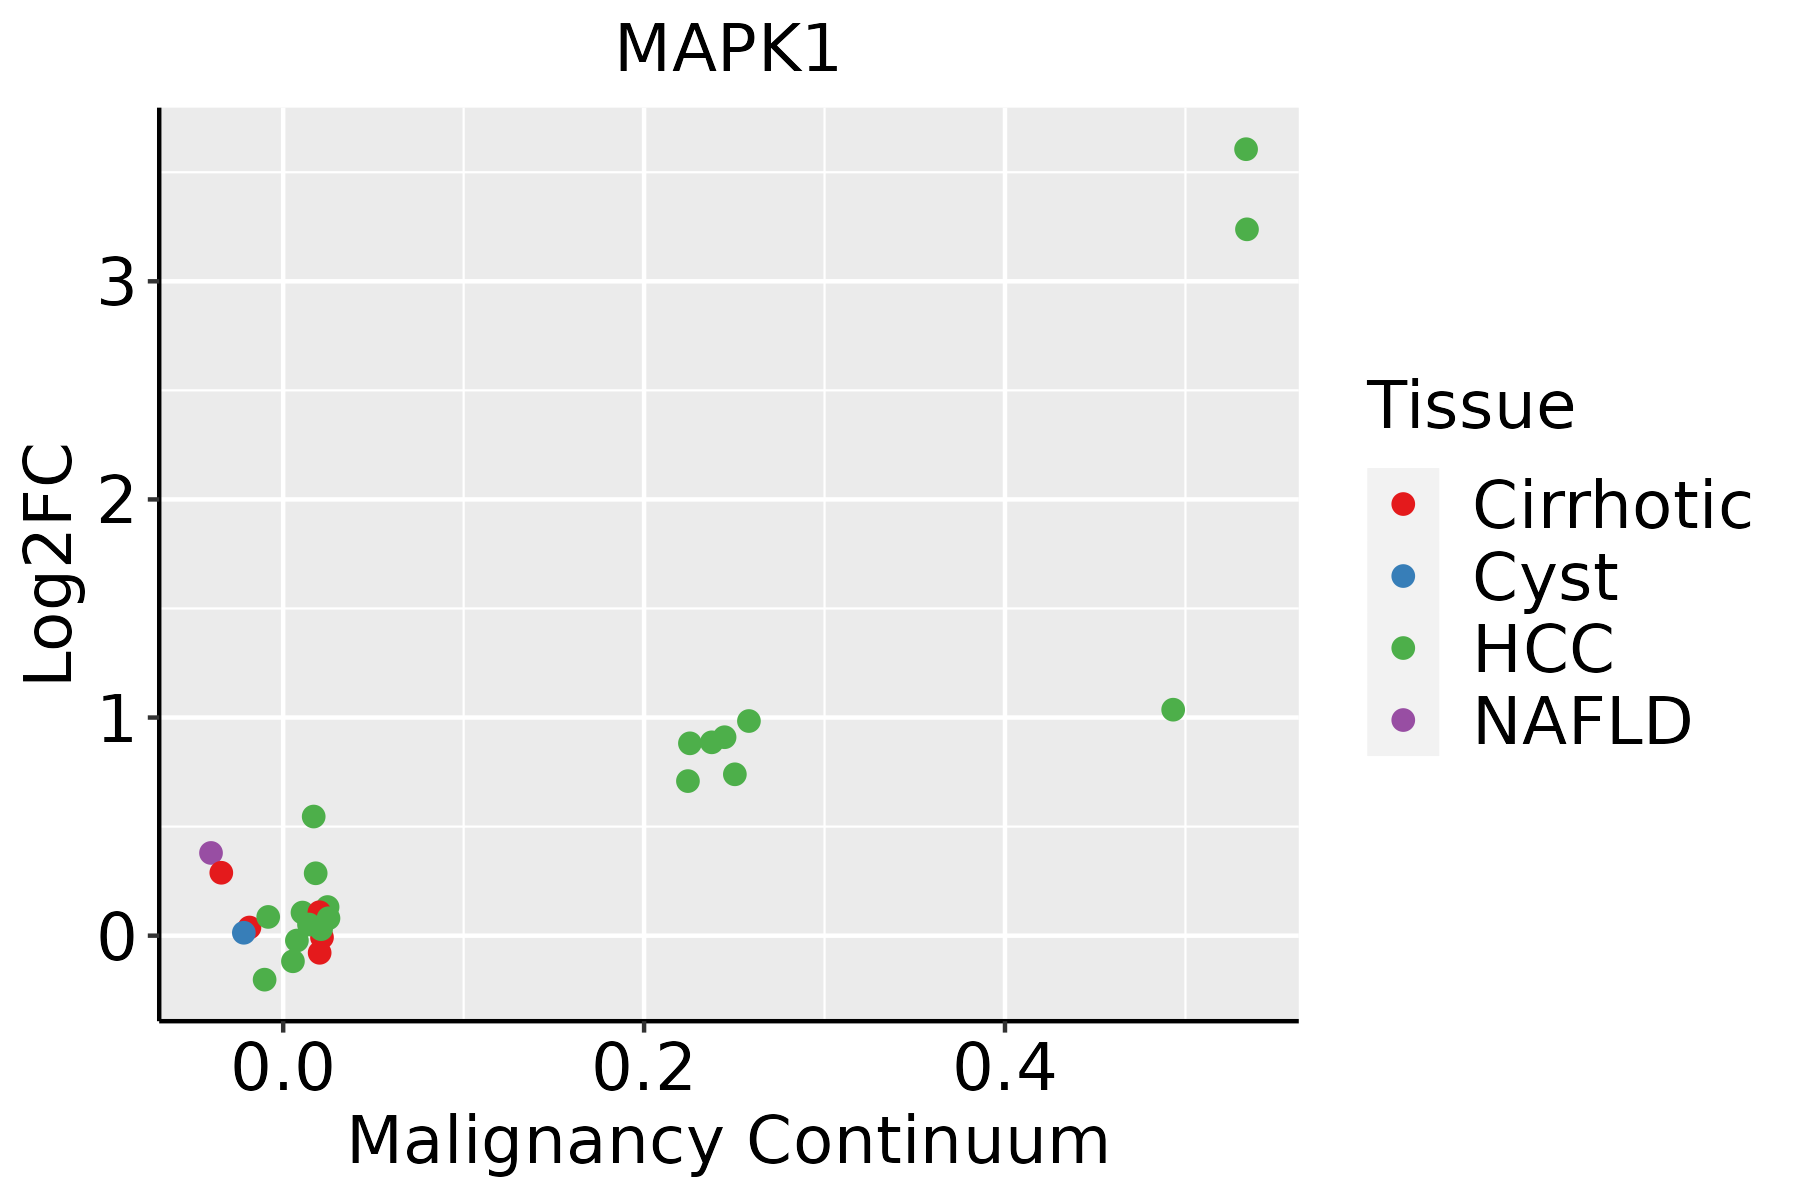 | HCC: Hepatocellular carcinoma |
| NAFLD: Non-alcoholic fatty liver disease |
| Oral Cavity |  | EOLP: Erosive Oral lichen planus |
| LP: leukoplakia |
| NEOLP: Non-erosive oral lichen planus |
| OSCC: Oral squamous cell carcinoma |
| Prostate | 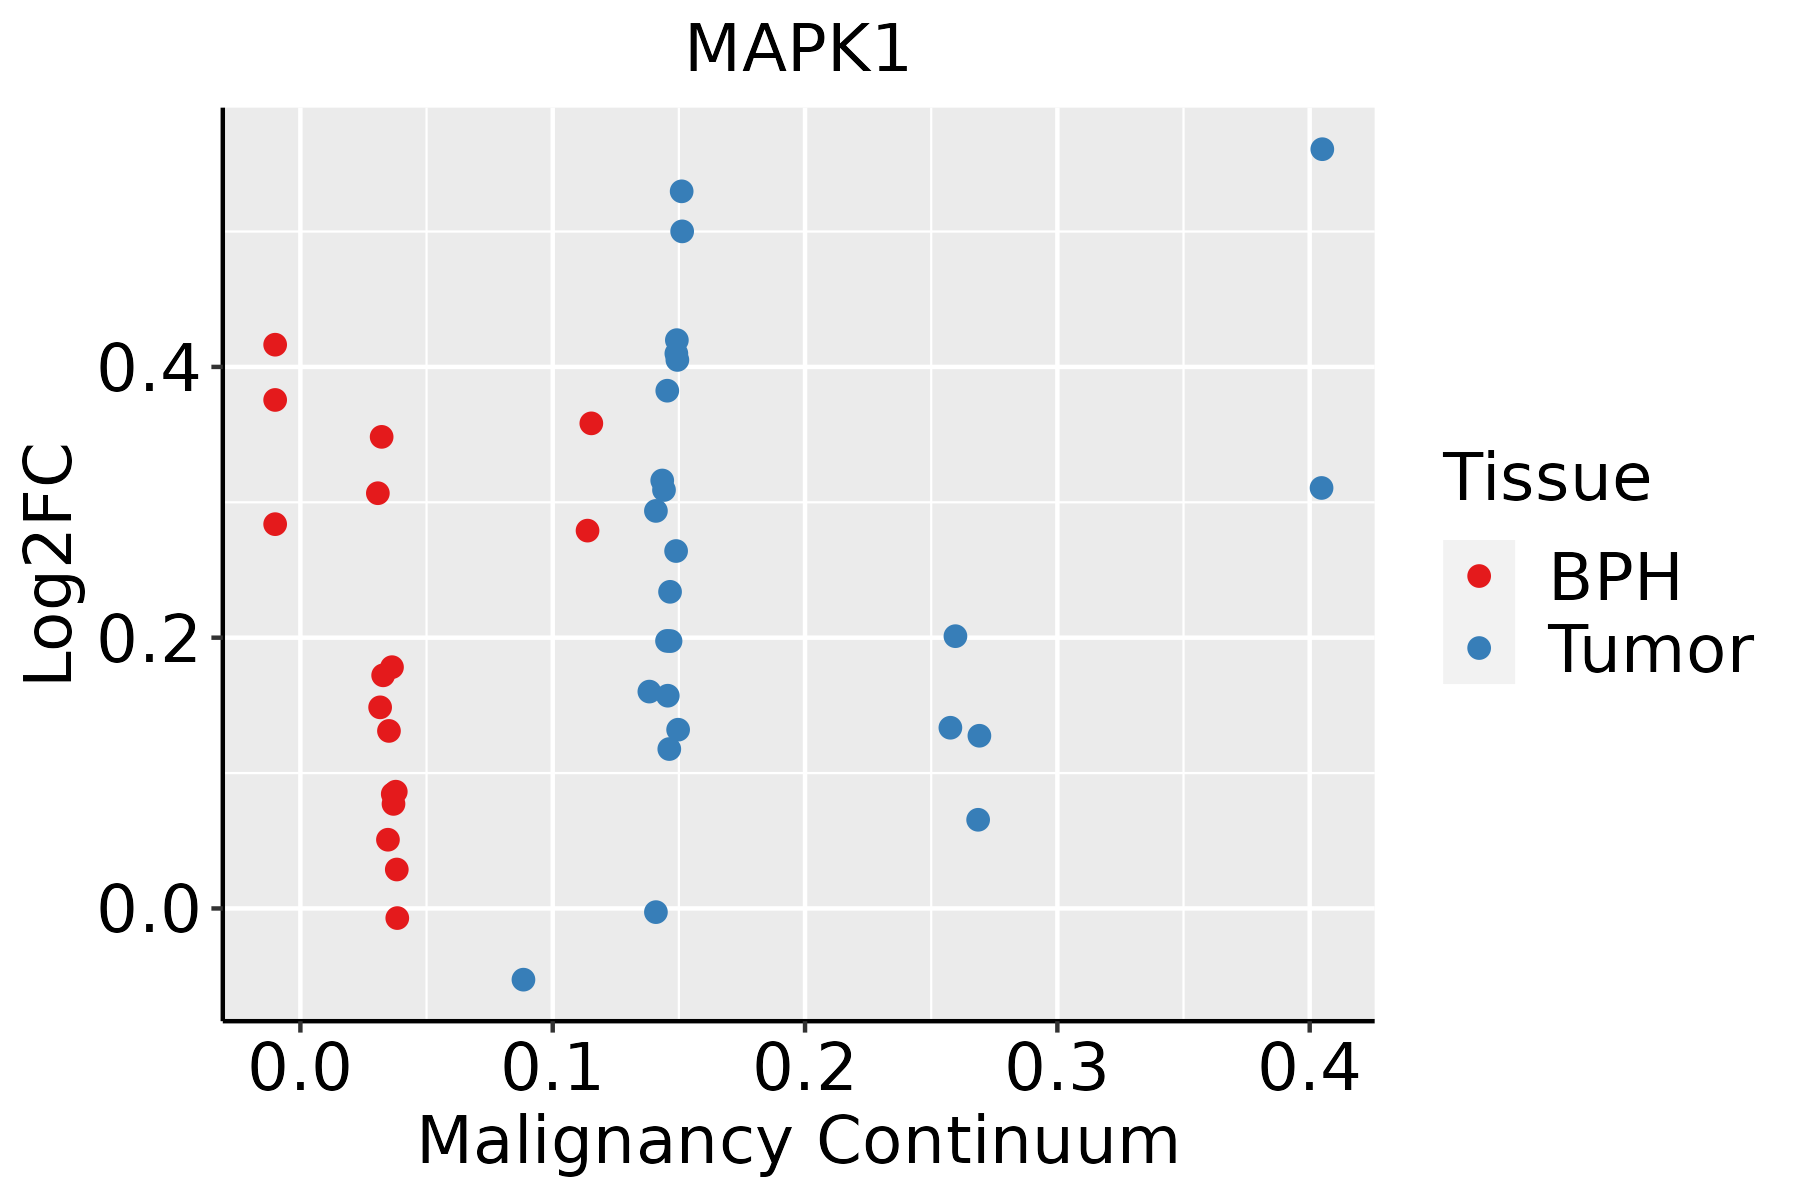 | BPH: Benign Prostatic Hyperplasia |
| Skin | 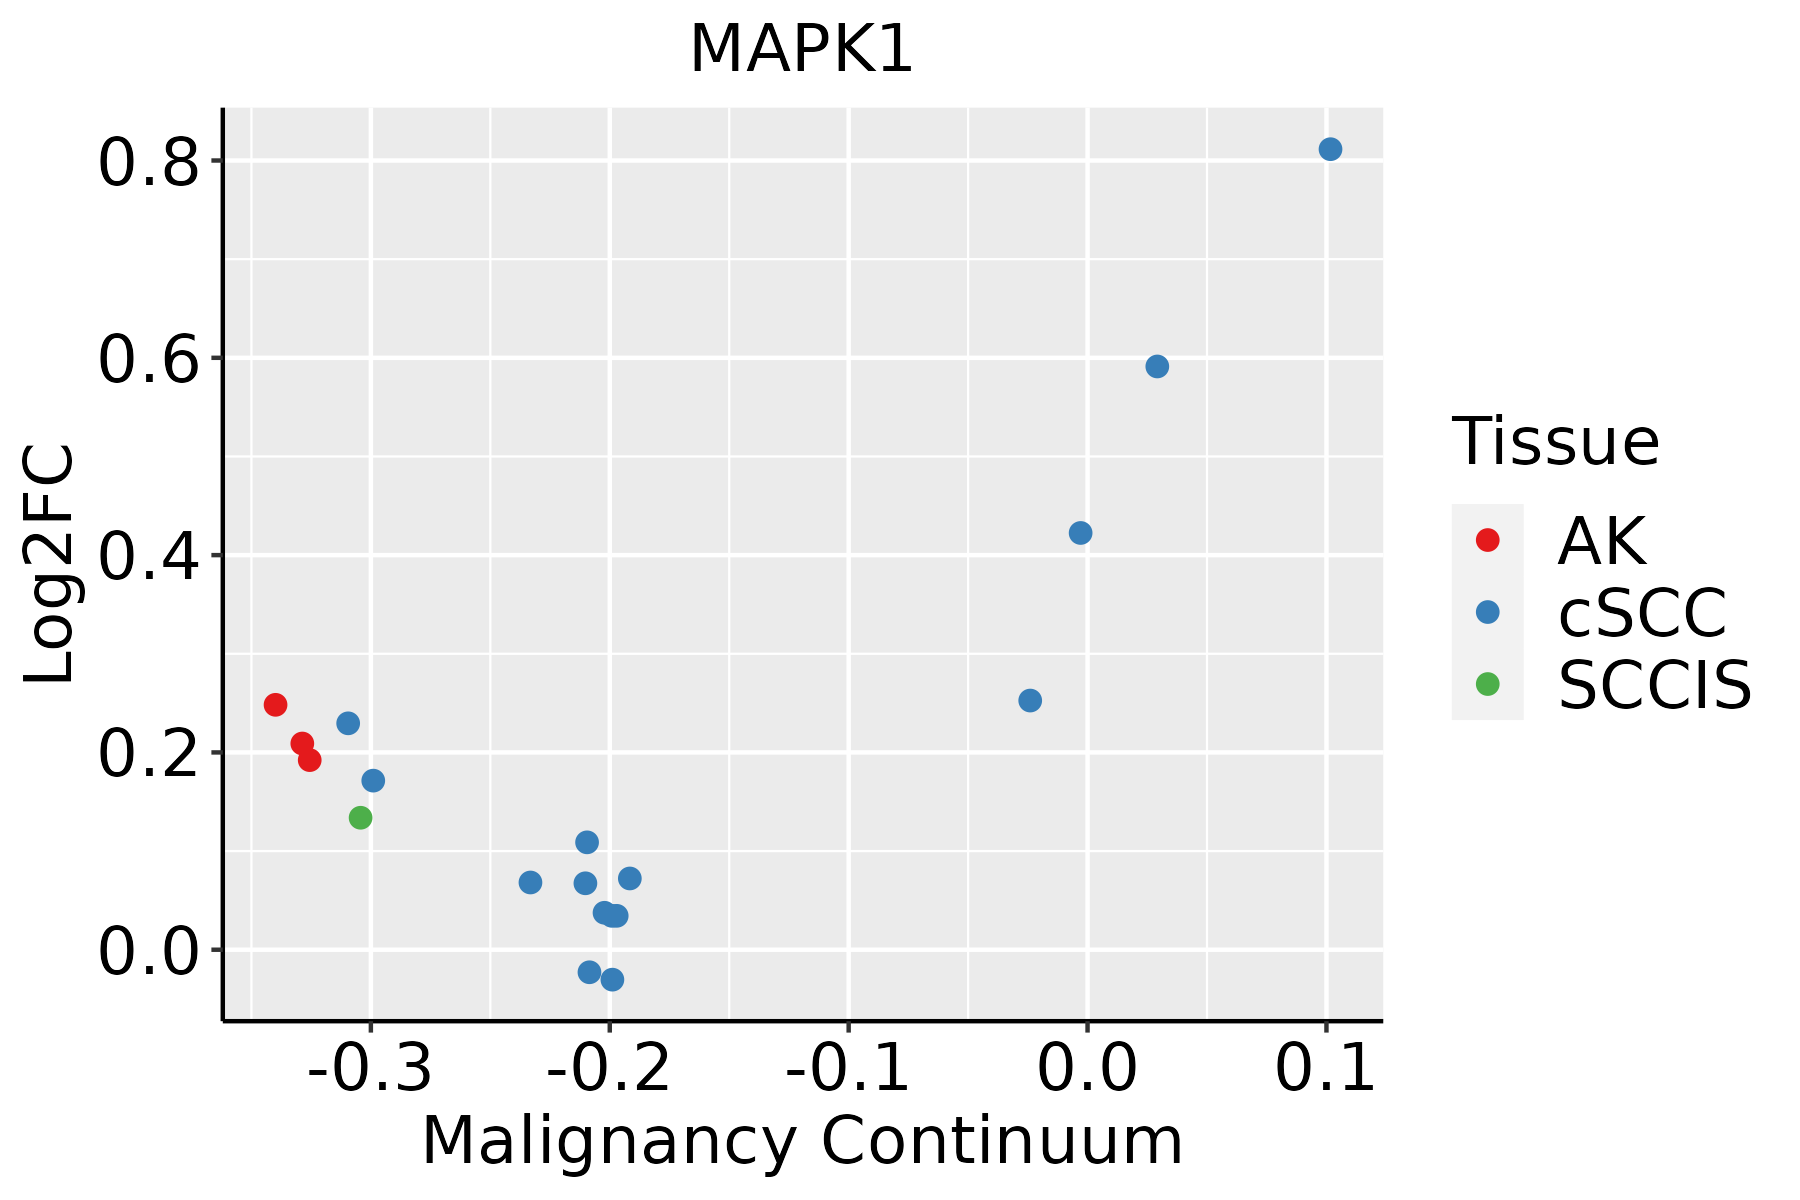 | AK: Actinic keratosis |
| cSCC: Cutaneous squamous cell carcinoma |
| SCCIS:squamous cell carcinoma in situ |
| Thyroid | 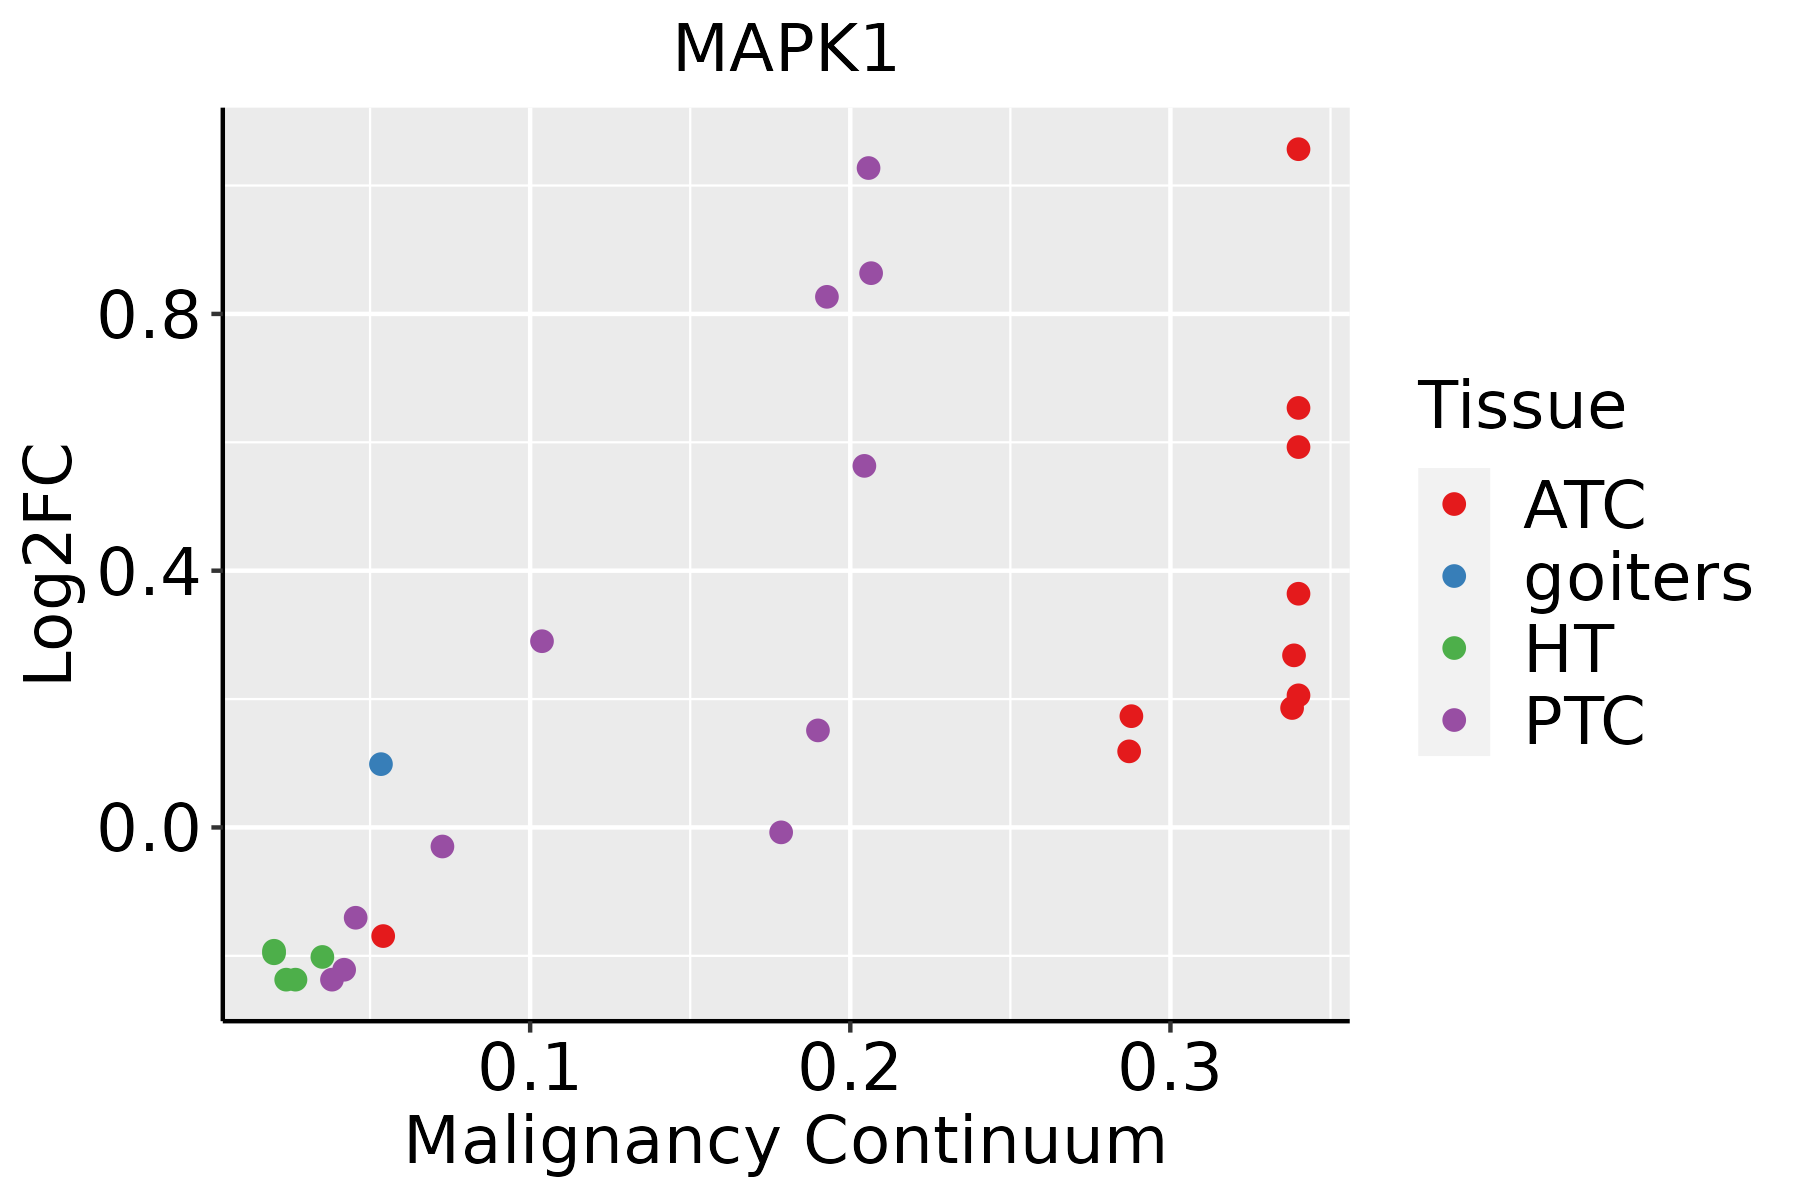 | ATC: Anaplastic thyroid cancer |
| HT: Hashimoto's thyroiditis |
| PTC: Papillary thyroid cancer |
| GO ID | Tissue | Disease Stage | Description | Gene Ratio | Bg Ratio | pvalue | p.adjust | Count |
| GO:0035331 | Liver | NAFLD | negative regulation of hippo signaling | 5/1882 | 13/18723 | 6.58e-03 | 4.69e-02 | 5 |
| GO:00102123 | Liver | NAFLD | response to ionizing radiation | 25/1882 | 148/18723 | 6.67e-03 | 4.74e-02 | 25 |
| GO:0034219 | Liver | NAFLD | carbohydrate transmembrane transport | 21/1882 | 118/18723 | 6.77e-03 | 4.79e-02 | 21 |
| GO:19038297 | Liver | NAFLD | positive regulation of cellular protein localization | 41/1882 | 276/18723 | 7.11e-03 | 4.95e-02 | 41 |
| GO:007259412 | Liver | Cirrhotic | establishment of protein localization to organelle | 189/4634 | 422/18723 | 1.01e-19 | 2.45e-17 | 189 |
| GO:190136111 | Liver | Cirrhotic | organic cyclic compound catabolic process | 213/4634 | 495/18723 | 1.58e-19 | 3.67e-17 | 213 |
| GO:000697912 | Liver | Cirrhotic | response to oxidative stress | 196/4634 | 446/18723 | 2.80e-19 | 5.86e-17 | 196 |
| GO:003164712 | Liver | Cirrhotic | regulation of protein stability | 144/4634 | 298/18723 | 6.74e-19 | 1.28e-16 | 144 |
| GO:001943911 | Liver | Cirrhotic | aromatic compound catabolic process | 202/4634 | 467/18723 | 6.93e-19 | 1.28e-16 | 202 |
| GO:190331111 | Liver | Cirrhotic | regulation of mRNA metabolic process | 140/4634 | 288/18723 | 1.07e-18 | 1.91e-16 | 140 |
| GO:004427011 | Liver | Cirrhotic | cellular nitrogen compound catabolic process | 195/4634 | 451/18723 | 2.99e-18 | 4.94e-16 | 195 |
| GO:004670011 | Liver | Cirrhotic | heterocycle catabolic process | 192/4634 | 445/18723 | 7.17e-18 | 1.12e-15 | 192 |
| GO:000641712 | Liver | Cirrhotic | regulation of translation | 194/4634 | 468/18723 | 7.28e-16 | 8.79e-14 | 194 |
| GO:003465511 | Liver | Cirrhotic | nucleobase-containing compound catabolic process | 171/4634 | 407/18723 | 9.07e-15 | 9.33e-13 | 171 |
| GO:000663112 | Liver | Cirrhotic | fatty acid metabolic process | 165/4634 | 390/18723 | 1.29e-14 | 1.26e-12 | 165 |
| GO:003238611 | Liver | Cirrhotic | regulation of intracellular transport | 147/4634 | 337/18723 | 1.84e-14 | 1.72e-12 | 147 |
| GO:006219712 | Liver | Cirrhotic | cellular response to chemical stress | 147/4634 | 337/18723 | 1.84e-14 | 1.72e-12 | 147 |
| GO:000640111 | Liver | Cirrhotic | RNA catabolic process | 126/4634 | 278/18723 | 4.64e-14 | 4.10e-12 | 126 |
| GO:003315711 | Liver | Cirrhotic | regulation of intracellular protein transport | 108/4634 | 229/18723 | 1.23e-13 | 1.04e-11 | 108 |
| GO:000640211 | Liver | Cirrhotic | mRNA catabolic process | 109/4634 | 232/18723 | 1.30e-13 | 1.09e-11 | 109 |
| TF | Cell Type | Tissue | Disease Stage | Target Gene | RSS | Regulon Activity |
| MAPK1 | CD8TEXINT | Colorectum | AD | ITGA1,YPEL1,UBASH3B, etc. | 2.57e-01 |  |
| MAPK1 | CD8TEREX | Colorectum | AD | ITGA1,YPEL1,UBASH3B, etc. | 2.43e-01 | |
| MAPK1 | MAIT | Colorectum | ADJ | ITGA1,YPEL1,UBASH3B, etc. | 1.38e-01 |  |
| MAPK1 | CD8TEREX | Colorectum | ADJ | ITGA1,YPEL1,UBASH3B, etc. | 1.84e-01 | |
| MAPK1 | CD8TEXINT | Colorectum | ADJ | ITGA1,YPEL1,UBASH3B, etc. | 1.00e-01 | |
| MAPK1 | CD8TEREX | Colorectum | CRC | ITGA1,YPEL1,UBASH3B, etc. | 6.38e-02 |  |
| MAPK1 | TREG | Colorectum | CRC | ITGA1,YPEL1,UBASH3B, etc. | 1.20e-01 | |
| MAPK1 | TH17 | Colorectum | FAP | ITGA1,YPEL1,UBASH3B, etc. | 8.39e-02 |  |
| MAPK1 | CD8TEREX | Colorectum | FAP | ITGA1,YPEL1,UBASH3B, etc. | 2.37e-01 | |
| MAPK1 | MAIT | Colorectum | FAP | ITGA1,YPEL1,UBASH3B, etc. | 1.13e-01 | |
| Hugo Symbol | Variant Class | Variant Classification | dbSNP RS | HGVSc | HGVSp | HGVSp Short | SWISSPROT | BIOTYPE | SIFT | PolyPhen | Tumor Sample Barcode | Tissue | Histology | Sex | Age | Stage | Therapy Types | Drugs | Outcome |
| MAPK1 | SNV | Missense_Mutation | | c.241G>A | p.Glu81Lys | p.E81K | P28482 | protein_coding | deleterious(0) | probably_damaging(0.995) | TCGA-BH-A0B5-01 | Breast | breast invasive carcinoma | Female | <65 | III/IV | Chemotherapy | adriamycin | CR |
| MAPK1 | SNV | Missense_Mutation | rs747124623 | c.994G>A | p.Asp332Asn | p.D332N | P28482 | protein_coding | deleterious(0.03) | benign(0.001) | TCGA-E2-A14N-01 | Breast | breast invasive carcinoma | Female | <65 | I/II | Chemotherapy | cyclophosphamide | SD |
| MAPK1 | insertion | Frame_Shift_Ins | novel | c.1024_1025insTTGTGAGCCAAGGTAGAAGCAGTTGCTGGGGAGATGC | p.Lys342IlefsTer20 | p.K342Ifs*20 | P28482 | protein_coding | | | TCGA-AN-A03Y-01 | Breast | breast invasive carcinoma | Female | >=65 | I/II | Unknown | Unknown | SD |
| MAPK1 | SNV | Missense_Mutation | | c.964N>A | p.Glu322Lys | p.E322K | P28482 | protein_coding | deleterious(0) | probably_damaging(0.995) | TCGA-C5-A1BI-01 | Cervix | cervical & endocervical cancer | Female | <65 | III/IV | Chemotherapy | cisplatin | SD |
| MAPK1 | SNV | Missense_Mutation | | c.964G>A | p.Glu322Lys | p.E322K | P28482 | protein_coding | deleterious(0) | probably_damaging(0.995) | TCGA-C5-A1MH-01 | Cervix | cervical & endocervical cancer | Female | >=65 | III/IV | Chemotherapy | cisplatin | PD |
| MAPK1 | SNV | Missense_Mutation | | c.961G>A | p.Asp321Asn | p.D321N | P28482 | protein_coding | deleterious(0) | probably_damaging(0.981) | TCGA-DG-A2KL-01 | Cervix | cervical & endocervical cancer | Female | <65 | I/II | Chemotherapy | cisplatin | SD |
| MAPK1 | SNV | Missense_Mutation | | c.964N>A | p.Glu322Lys | p.E322K | P28482 | protein_coding | deleterious(0) | probably_damaging(0.995) | TCGA-DS-A0VN-01 | Cervix | cervical & endocervical cancer | Female | <65 | I/II | Chemotherapy | cisplatin | SD |
| MAPK1 | SNV | Missense_Mutation | | c.964N>A | p.Glu322Lys | p.E322K | P28482 | protein_coding | deleterious(0) | probably_damaging(0.995) | TCGA-EA-A1QS-01 | Cervix | cervical & endocervical cancer | Female | <65 | I/II | Unknown | Unknown | SD |
| MAPK1 | SNV | Missense_Mutation | | c.404G>A | p.Arg135Lys | p.R135K | P28482 | protein_coding | deleterious(0) | probably_damaging(0.992) | TCGA-EA-A3HT-01 | Cervix | cervical & endocervical cancer | Female | >=65 | I/II | Unknown | Unknown | SD |
| MAPK1 | SNV | Missense_Mutation | | c.964G>A | p.Glu322Lys | p.E322K | P28482 | protein_coding | deleterious(0) | probably_damaging(0.995) | TCGA-EA-A5ZD-01 | Cervix | cervical & endocervical cancer | Female | <65 | I/II | Unknown | Unknown | SD |
| Entrez ID | Symbol | Category | Interaction Types | Drug Claim Name | Drug Name | PMIDs |
| 5594 | MAPK1 | SERINE THREONINE KINASE, ENZYME, CLINICALLY ACTIONABLE, KINASE, DRUGGABLE GENOME, DRUG RESISTANCE, TRANSCRIPTION FACTOR | | PROGESTERONE | PROGESTERONE | |
| 5594 | MAPK1 | SERINE THREONINE KINASE, ENZYME, CLINICALLY ACTIONABLE, KINASE, DRUGGABLE GENOME, DRUG RESISTANCE, TRANSCRIPTION FACTOR | | SPINASAPONIN A METHYL ESTER | SPINASAPONIN A METHYL ESTER | 20951582 |
| 5594 | MAPK1 | SERINE THREONINE KINASE, ENZYME, CLINICALLY ACTIONABLE, KINASE, DRUGGABLE GENOME, DRUG RESISTANCE, TRANSCRIPTION FACTOR | | DIHYDROGAMBOGIC ACID | DIHYDROGAMBOGIC ACID | |
| 5594 | MAPK1 | SERINE THREONINE KINASE, ENZYME, CLINICALLY ACTIONABLE, KINASE, DRUGGABLE GENOME, DRUG RESISTANCE, TRANSCRIPTION FACTOR | | TREQUINSIN HYDROCHLORIDE | TREQUINSIN HYDROCHLORIDE | |
| 5594 | MAPK1 | SERINE THREONINE KINASE, ENZYME, CLINICALLY ACTIONABLE, KINASE, DRUGGABLE GENOME, DRUG RESISTANCE, TRANSCRIPTION FACTOR | | BENZOTHIAZOL-2-YLAMINE | CHEMBL329785 | 22982122 |
| 5594 | MAPK1 | SERINE THREONINE KINASE, ENZYME, CLINICALLY ACTIONABLE, KINASE, DRUGGABLE GENOME, DRUG RESISTANCE, TRANSCRIPTION FACTOR | | PHENETHYLISOTHIOCYANATE | PHENETHYLISOTHIOCYANATE | 22607231 |
| 5594 | MAPK1 | SERINE THREONINE KINASE, ENZYME, CLINICALLY ACTIONABLE, KINASE, DRUGGABLE GENOME, DRUG RESISTANCE, TRANSCRIPTION FACTOR | | GENTIAN VIOLET | GENTIAN VIOLET | |
| 5594 | MAPK1 | SERINE THREONINE KINASE, ENZYME, CLINICALLY ACTIONABLE, KINASE, DRUGGABLE GENOME, DRUG RESISTANCE, TRANSCRIPTION FACTOR | | MITOXANTRONE DIHYDROCHLORIDE | MITOXANTRONE HYDROCHLORIDE | |
| 5594 | MAPK1 | SERINE THREONINE KINASE, ENZYME, CLINICALLY ACTIONABLE, KINASE, DRUGGABLE GENOME, DRUG RESISTANCE, TRANSCRIPTION FACTOR | | DAUNORUBICIN HYDROCHLORIDE | DAUNORUBICIN HYDROCHLORIDE | |
| 5594 | MAPK1 | SERINE THREONINE KINASE, ENZYME, CLINICALLY ACTIONABLE, KINASE, DRUGGABLE GENOME, DRUG RESISTANCE, TRANSCRIPTION FACTOR | | ZM-449829 | CHEMBL154580 | |


