
|
|||||
|
 | |
| |
| |
| |
| |
| |
|
Gene: LY6E |
Gene summary for LY6E |
| Gene information | Species | Human | Gene symbol | LY6E | Gene ID | 4061 |
| Gene name | lymphocyte antigen 6 family member E | |
| Gene Alias | RIG-E | |
| Cytomap | 8q24.3 | |
| Gene Type | protein-coding | GO ID | GO:0001701 | UniProtAcc | Q16553 |
Top |
Malignant transformation analysis |
| Identification of the aberrant gene expression in precancerous and cancerous lesions by comparing the gene expression of stem-like cells in diseased tissues with normal stem cells |
| Entrez ID | Symbol | Replicates | Species | Organ | Tissue | Adj P-value | Log2FC | Malignancy |
| 4061 | LY6E | GSM4909281 | Human | Breast | IDC | 2.98e-102 | 1.14e+00 | 0.21 |
| 4061 | LY6E | GSM4909282 | Human | Breast | IDC | 1.34e-05 | 3.62e-01 | -0.0288 |
| 4061 | LY6E | GSM4909285 | Human | Breast | IDC | 3.26e-05 | 3.42e-01 | 0.21 |
| 4061 | LY6E | GSM4909286 | Human | Breast | IDC | 2.97e-10 | -2.35e-01 | 0.1081 |
| 4061 | LY6E | GSM4909287 | Human | Breast | IDC | 3.34e-21 | 5.74e-01 | 0.2057 |
| 4061 | LY6E | GSM4909290 | Human | Breast | IDC | 2.46e-03 | -2.63e-01 | 0.2096 |
| 4061 | LY6E | GSM4909291 | Human | Breast | IDC | 4.49e-03 | 4.05e-01 | 0.1753 |
| 4061 | LY6E | GSM4909294 | Human | Breast | IDC | 2.66e-02 | -2.60e-01 | 0.2022 |
| 4061 | LY6E | GSM4909296 | Human | Breast | IDC | 4.18e-27 | 4.97e-01 | 0.1524 |
| 4061 | LY6E | GSM4909297 | Human | Breast | IDC | 2.56e-21 | 2.91e-01 | 0.1517 |
| 4061 | LY6E | GSM4909299 | Human | Breast | IDC | 5.70e-15 | 4.91e-01 | 0.035 |
| 4061 | LY6E | GSM4909300 | Human | Breast | IDC | 2.39e-07 | 5.47e-01 | 0.0334 |
| 4061 | LY6E | GSM4909304 | Human | Breast | IDC | 3.35e-26 | 5.97e-01 | 0.1636 |
| 4061 | LY6E | GSM4909305 | Human | Breast | IDC | 2.12e-22 | 6.96e-01 | 0.0436 |
| 4061 | LY6E | GSM4909306 | Human | Breast | IDC | 1.22e-03 | 3.10e-01 | 0.1564 |
| 4061 | LY6E | GSM4909307 | Human | Breast | IDC | 6.29e-06 | 3.73e-01 | 0.1569 |
| 4061 | LY6E | GSM4909309 | Human | Breast | IDC | 2.71e-38 | 7.91e-01 | 0.0483 |
| 4061 | LY6E | GSM4909311 | Human | Breast | IDC | 4.82e-34 | 1.07e-01 | 0.1534 |
| 4061 | LY6E | GSM4909312 | Human | Breast | IDC | 5.86e-18 | 4.10e-01 | 0.1552 |
| 4061 | LY6E | GSM4909313 | Human | Breast | IDC | 1.18e-11 | 2.81e-01 | 0.0391 |
| Page: 1 2 3 4 5 6 7 8 9 10 11 12 13 14 15 |
| Tissue | Expression Dynamics | Abbreviation |
| Breast |  | IDC: Invasive ductal carcinoma |
| DCIS: Ductal carcinoma in situ | ||
| Precancer(BRCA1-mut): Precancerous lesion from BRCA1 mutation carriers | ||
| Cervix |  | CC: Cervix cancer |
| HSIL_HPV: HPV-infected high-grade squamous intraepithelial lesions | ||
| N_HPV: HPV-infected normal cervix | ||
| Colorectum (GSE201348) |  | FAP: Familial adenomatous polyposis |
| CRC: Colorectal cancer | ||
| Colorectum (HTA11) |  | AD: Adenomas |
| SER: Sessile serrated lesions | ||
| MSI-H: Microsatellite-high colorectal cancer | ||
| MSS: Microsatellite stable colorectal cancer | ||
| Endometrium |  | AEH: Atypical endometrial hyperplasia |
| EEC: Endometrioid Cancer | ||
| Esophagus | 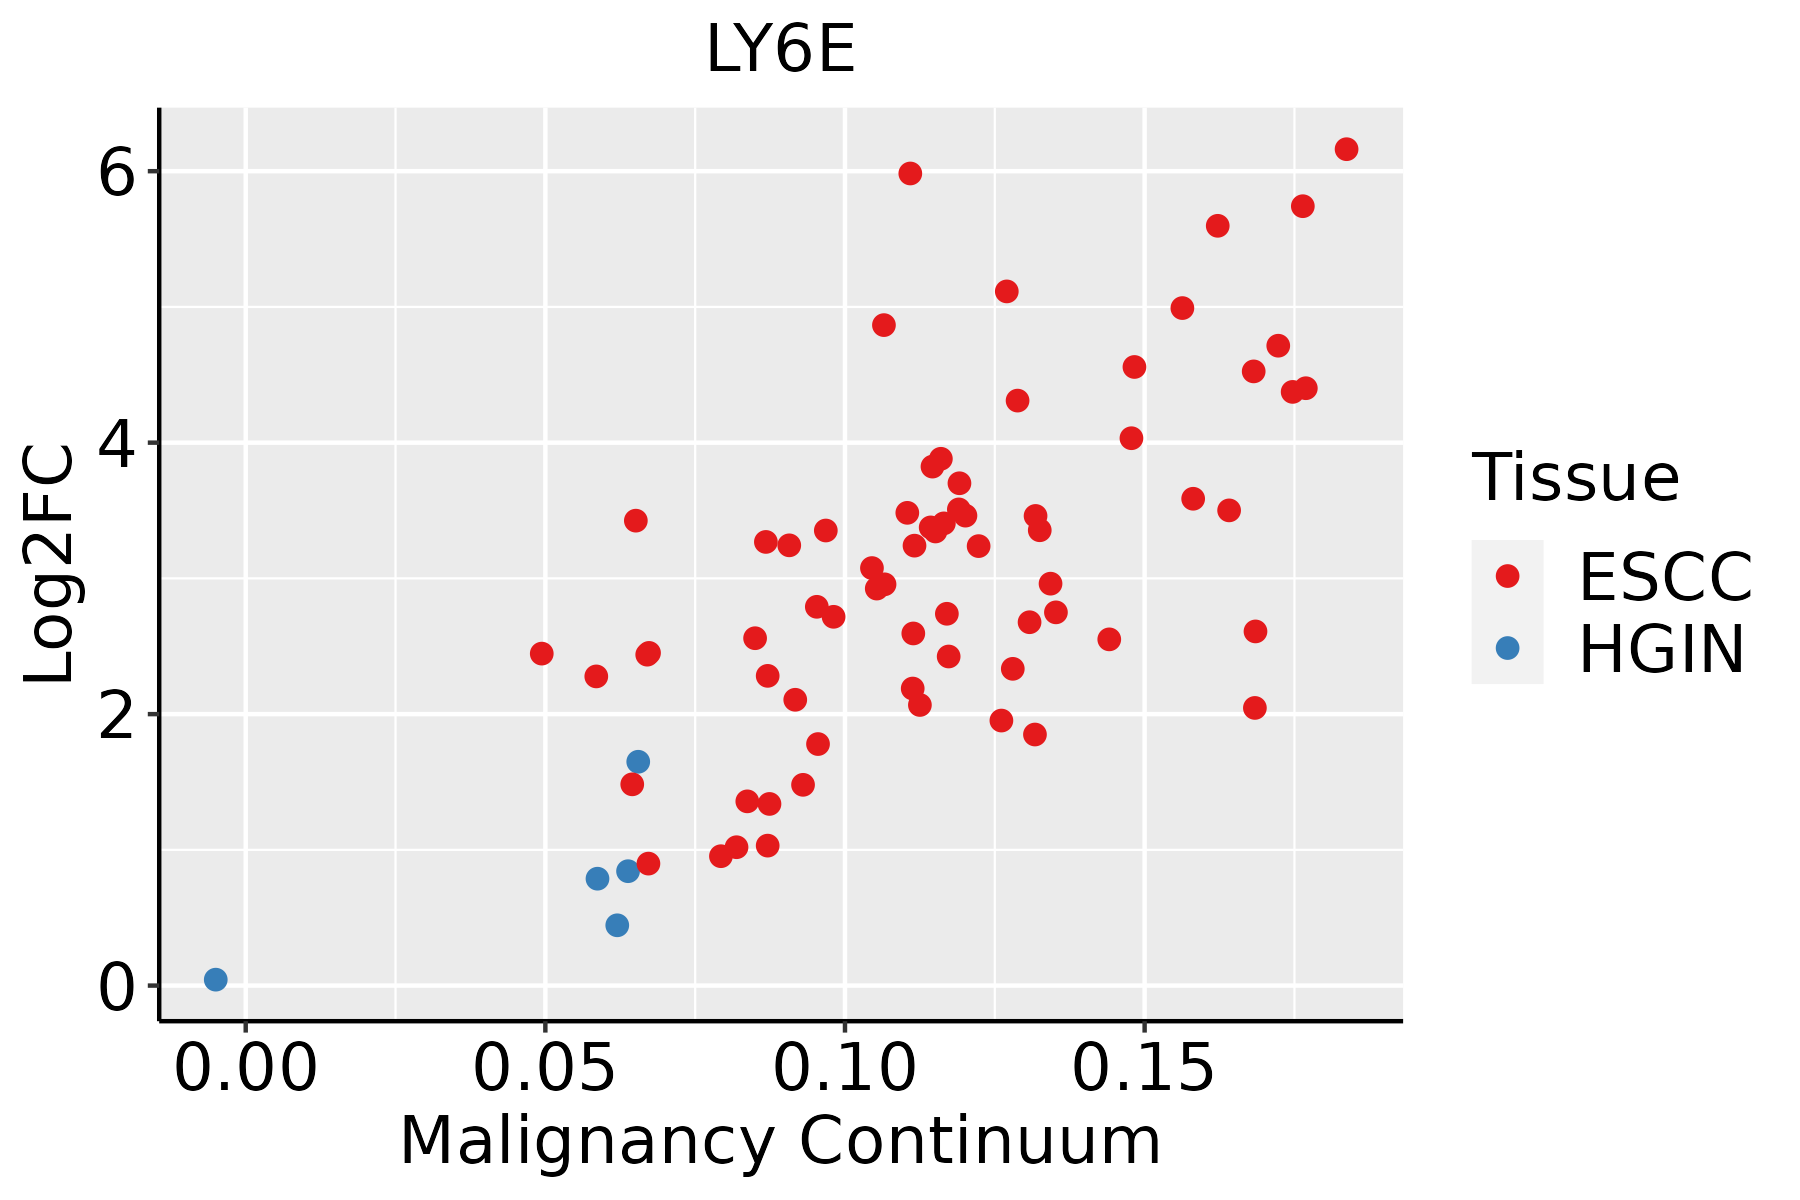 | ESCC: Esophageal squamous cell carcinoma |
| HGIN: High-grade intraepithelial neoplasias | ||
| LGIN: Low-grade intraepithelial neoplasias | ||
| GC |  | CAG: Chronic atrophic gastritis |
| CAG with IM: Chronic atrophic gastritis with intestinal metaplasia | ||
| CSG: Chronic superficial gastritis | ||
| GC: Gastric cancer | ||
| SIM: Severe intestinal metaplasia | ||
| WIM: Wild intestinal metaplasia | ||
| Liver |  | HCC: Hepatocellular carcinoma |
| NAFLD: Non-alcoholic fatty liver disease | ||
| Lung | 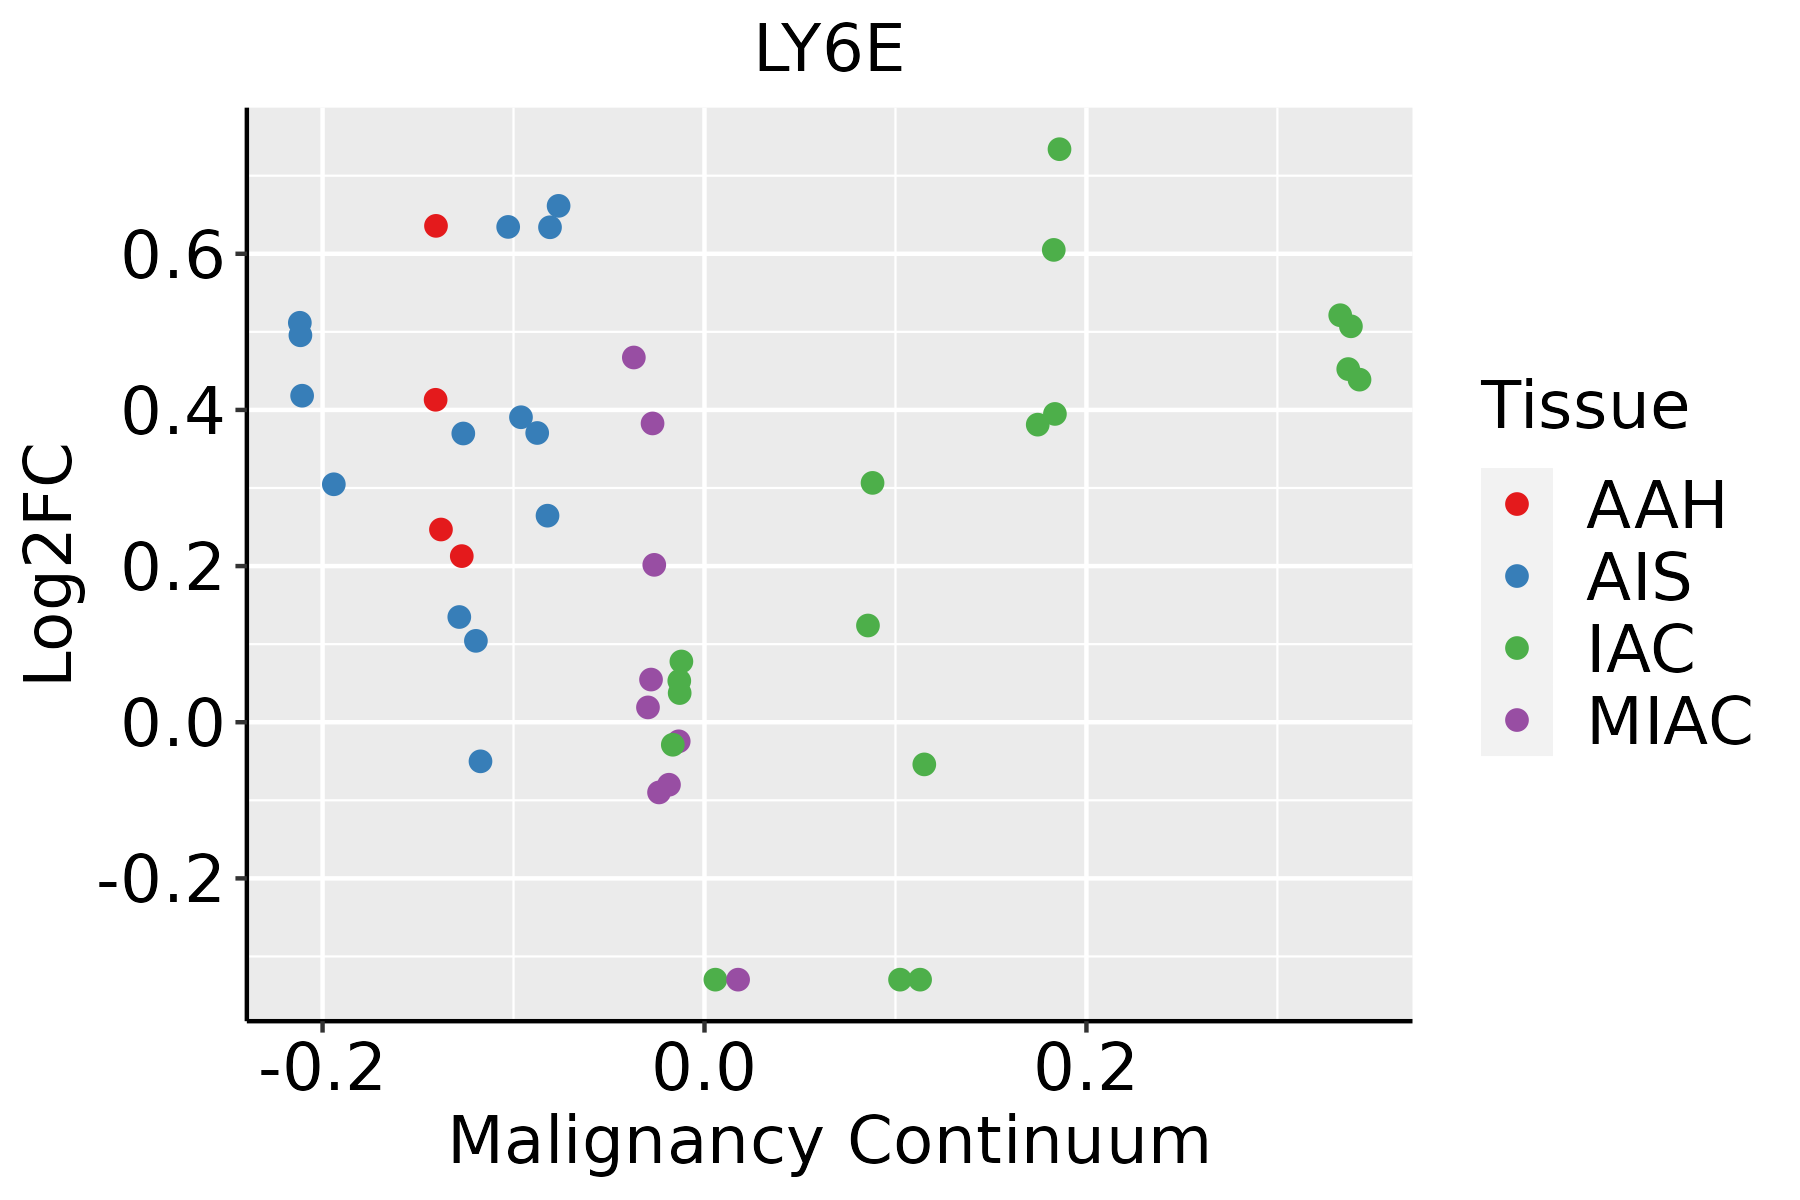 | AAH: Atypical adenomatous hyperplasia |
| AIS: Adenocarcinoma in situ | ||
| IAC: Invasive lung adenocarcinoma | ||
| MIA: Minimally invasive adenocarcinoma | ||
| Oral Cavity |  | EOLP: Erosive Oral lichen planus |
| LP: leukoplakia | ||
| NEOLP: Non-erosive oral lichen planus | ||
| OSCC: Oral squamous cell carcinoma | ||
| Prostate |  | BPH: Benign Prostatic Hyperplasia |
| Skin |  | AK: Actinic keratosis |
| cSCC: Cutaneous squamous cell carcinoma | ||
| SCCIS:squamous cell carcinoma in situ | ||
| Thyroid |  | ATC: Anaplastic thyroid cancer |
| HT: Hashimoto's thyroiditis | ||
| PTC: Papillary thyroid cancer |
| ∗log2FC in expression of this searched gene in stem-like cells from each diseased tissue sample relative to stem-like cells in normal samples in each tissue plotted against the malignancy continuum. Samples are colored based on if they are from different disease stage. |
Top |
Malignant transformation related pathway analysis |
| Find out the enriched GO biological processes and KEGG pathways involved in transition from healthy to precancer to cancer |
| Tissue | Disease Stage | Enriched GO biological Processes |
| Colorectum | AD |  |
| Colorectum | SER |  |
| Colorectum | MSS |  |
| Colorectum | MSI-H |  |
| Colorectum | FAP |  |
| ∗Top 15 enriched GO BP terms are showed in the bar plot of each disease state in each tissue. Each row represents a significant GO biological process which is colored according to the -log10(p.adjust). |
| Page: 1 2 3 4 5 6 7 8 9 |
| GO ID | Tissue | Disease Stage | Description | Gene Ratio | Bg Ratio | pvalue | p.adjust | Count |
| GO:0051701113 | Thyroid | PTC | biological process involved in interaction with host | 109/5968 | 203/18723 | 8.64e-11 | 2.99e-09 | 109 |
| GO:0001701111 | Thyroid | PTC | in utero embryonic development | 175/5968 | 367/18723 | 1.40e-10 | 4.73e-09 | 175 |
| GO:0052126113 | Thyroid | PTC | movement in host environment | 91/5968 | 175/18723 | 2.41e-08 | 5.43e-07 | 91 |
| GO:0048732113 | Thyroid | PTC | gland development | 193/5968 | 436/18723 | 2.88e-08 | 6.42e-07 | 193 |
| GO:0050792113 | Thyroid | PTC | regulation of viral process | 85/5968 | 164/18723 | 8.33e-08 | 1.70e-06 | 85 |
| GO:1903900113 | Thyroid | PTC | regulation of viral life cycle | 72/5968 | 148/18723 | 1.49e-05 | 1.58e-04 | 72 |
| GO:0044409113 | Thyroid | PTC | entry into host | 72/5968 | 151/18723 | 3.48e-05 | 3.29e-04 | 72 |
| GO:0046718112 | Thyroid | PTC | viral entry into host cell | 68/5968 | 144/18723 | 8.26e-05 | 7.00e-04 | 68 |
| GO:00032055 | Thyroid | PTC | cardiac chamber development | 72/5968 | 161/18723 | 4.13e-04 | 2.77e-03 | 72 |
| GO:00032314 | Thyroid | PTC | cardiac ventricle development | 55/5968 | 123/18723 | 1.87e-03 | 1.01e-02 | 55 |
| GO:006053719 | Thyroid | PTC | muscle tissue development | 156/5968 | 403/18723 | 1.98e-03 | 1.06e-02 | 156 |
| GO:0043903113 | Thyroid | PTC | regulation of biological process involved in symbiotic interaction | 33/5968 | 72/18723 | 9.04e-03 | 3.75e-02 | 33 |
| GO:001470617 | Thyroid | PTC | striated muscle tissue development | 144/5968 | 384/18723 | 1.05e-02 | 4.22e-02 | 144 |
| GO:00032066 | Thyroid | PTC | cardiac chamber morphogenesis | 51/5968 | 121/18723 | 1.09e-02 | 4.37e-02 | 51 |
| GO:001603234 | Thyroid | ATC | viral process | 241/6293 | 415/18723 | 5.50e-25 | 2.04e-22 | 241 |
| GO:001905835 | Thyroid | ATC | viral life cycle | 173/6293 | 317/18723 | 9.22e-15 | 5.50e-13 | 173 |
| GO:004440334 | Thyroid | ATC | biological process involved in symbiotic interaction | 153/6293 | 290/18723 | 1.12e-11 | 4.12e-10 | 153 |
| GO:000170126 | Thyroid | ATC | in utero embryonic development | 183/6293 | 367/18723 | 6.62e-11 | 2.11e-09 | 183 |
| GO:004873233 | Thyroid | ATC | gland development | 210/6293 | 436/18723 | 1.50e-10 | 4.59e-09 | 210 |
| GO:005170134 | Thyroid | ATC | biological process involved in interaction with host | 112/6293 | 203/18723 | 1.93e-10 | 5.76e-09 | 112 |
| Page: 1 2 3 4 5 6 7 8 9 10 11 12 13 14 15 16 17 18 19 20 21 22 23 24 25 26 27 28 |
| Pathway ID | Tissue | Disease Stage | Description | Gene Ratio | Bg Ratio | pvalue | p.adjust | qvalue | Count |
| Page: 1 |
Top |
Cell-cell communication analysis |
| Identification of potential cell-cell interactions between two cell types and their ligand-receptor pairs for different disease states |
| Ligand | Receptor | LRpair | Pathway | Tissue | Disease Stage |
| Page: 1 |
Top |
Single-cell gene regulatory network inference analysis |
| Find out the significant the regulons (TFs) and the target genes of each regulon across cell types for different disease states |
| TF | Cell Type | Tissue | Disease Stage | Target Gene | RSS | Regulon Activity |
| ∗The dot plots of a searched regulon are shown for all cell subpopulations in each disease state of each tissue based on the regulon specific score inferred using pySCENIC and by calculating the average expression. |
| Page: 1 |
Top |
Somatic mutation of malignant transformation related genes |
| Annotation of somatic variants for genes involved in malignant transformation |
| Hugo Symbol | Variant Class | Variant Classification | dbSNP RS | HGVSc | HGVSp | HGVSp Short | SWISSPROT | BIOTYPE | SIFT | PolyPhen | Tumor Sample Barcode | Tissue | Histology | Sex | Age | Stage | Therapy Types | Drugs | Outcome |
| LY6E | SNV | Missense_Mutation | rs368130997 | c.59N>T | p.Ser20Leu | p.S20L | Q16553 | protein_coding | deleterious(0.02) | benign(0.011) | TCGA-LL-A740-01 | Breast | breast invasive carcinoma | Female | <65 | I/II | Chemotherapy | adriamycin | CR |
| LY6E | SNV | Missense_Mutation | novel | c.282N>C | p.Gln94His | p.Q94H | Q16553 | protein_coding | deleterious(0.04) | probably_damaging(0.933) | TCGA-VS-A9V1-01 | Cervix | cervical & endocervical cancer | Female | <65 | I/II | Chemotherapy | cisplatin | PD |
| LY6E | SNV | Missense_Mutation | novel | c.217N>A | p.Pro73Thr | p.P73T | Q16553 | protein_coding | deleterious(0.02) | possibly_damaging(0.822) | TCGA-AA-3522-01 | Colorectum | colon adenocarcinoma | Male | >=65 | I/II | Unknown | Unknown | SD |
| LY6E | SNV | Missense_Mutation | c.167N>A | p.Gly56Asp | p.G56D | Q16553 | protein_coding | deleterious(0.03) | probably_damaging(0.999) | TCGA-AA-3710-01 | Colorectum | colon adenocarcinoma | Female | >=65 | I/II | Unknown | Unknown | SD | |
| LY6E | SNV | Missense_Mutation | c.392C>A | p.Pro131His | p.P131H | Q16553 | protein_coding | deleterious_low_confidence(0) | possibly_damaging(0.75) | TCGA-AA-3877-01 | Colorectum | colon adenocarcinoma | Female | >=65 | I/II | Unknown | Unknown | SD | |
| LY6E | SNV | Missense_Mutation | rs777594710 | c.218N>T | p.Pro73Leu | p.P73L | Q16553 | protein_coding | deleterious(0.01) | benign(0.052) | TCGA-AP-A0LT-01 | Endometrium | uterine corpus endometrioid carcinoma | Female | <65 | I/II | Unknown | Unknown | SD |
| LY6E | SNV | Missense_Mutation | novel | c.350N>T | p.Gly117Val | p.G117V | Q16553 | protein_coding | tolerated(0.06) | possibly_damaging(0.851) | TCGA-NJ-A55A-01 | Lung | lung adenocarcinoma | Female | >=65 | I/II | Unknown | Unknown | SD |
| LY6E | SNV | Missense_Mutation | novel | c.208A>G | p.Thr70Ala | p.T70A | Q16553 | protein_coding | tolerated(0.18) | benign(0) | TCGA-37-4132-01 | Lung | lung squamous cell carcinoma | Female | <65 | III/IV | Unknown | Unknown | SD |
| LY6E | SNV | Missense_Mutation | novel | c.221N>T | p.Ala74Val | p.A74V | Q16553 | protein_coding | tolerated(0.92) | benign(0) | TCGA-D7-A6EY-01 | Stomach | stomach adenocarcinoma | Female | >=65 | III/IV | Unknown | Unknown | PD |
| Page: 1 |
Top |
Related drugs of malignant transformation related genes |
| Identification of chemicals and drugs interact with genes involved in malignant transfromation |
| (DGIdb 4.0) |
| Entrez ID | Symbol | Category | Interaction Types | Drug Claim Name | Drug Name | PMIDs |
| Page: 1 |

Copyright 2023-Present -The University of Texas Health Science Center at Houston |