
|
|||||
|
 | |
| |
| |
| |
| |
| |
|
Gene: LXN |
Gene summary for LXN |
| Gene information | Species | Human | Gene symbol | LXN | Gene ID | 56925 |
| Gene name | latexin | |
| Gene Alias | ECI | |
| Cytomap | 3q25.32 | |
| Gene Type | protein-coding | GO ID | GO:0003008 | UniProtAcc | Q9BS40 |
Top |
Malignant transformation analysis |
| Identification of the aberrant gene expression in precancerous and cancerous lesions by comparing the gene expression of stem-like cells in diseased tissues with normal stem cells |
| Entrez ID | Symbol | Replicates | Species | Organ | Tissue | Adj P-value | Log2FC | Malignancy |
| 56925 | LXN | LZE4T | Human | Esophagus | ESCC | 6.78e-09 | 1.20e-01 | 0.0811 |
| 56925 | LXN | LZE7T | Human | Esophagus | ESCC | 9.96e-06 | 1.02e-01 | 0.0667 |
| 56925 | LXN | P2T-E | Human | Esophagus | ESCC | 5.83e-28 | 6.82e-01 | 0.1177 |
| 56925 | LXN | P4T-E | Human | Esophagus | ESCC | 2.91e-30 | 8.25e-01 | 0.1323 |
| 56925 | LXN | P8T-E | Human | Esophagus | ESCC | 1.30e-30 | 6.25e-01 | 0.0889 |
| 56925 | LXN | P10T-E | Human | Esophagus | ESCC | 3.50e-12 | 5.28e-02 | 0.116 |
| 56925 | LXN | P11T-E | Human | Esophagus | ESCC | 2.53e-02 | -8.39e-03 | 0.1426 |
| 56925 | LXN | P16T-E | Human | Esophagus | ESCC | 6.16e-03 | -1.74e-01 | 0.1153 |
| 56925 | LXN | P22T-E | Human | Esophagus | ESCC | 9.68e-30 | 4.16e-01 | 0.1236 |
| 56925 | LXN | P23T-E | Human | Esophagus | ESCC | 3.16e-02 | -2.33e-02 | 0.108 |
| 56925 | LXN | P26T-E | Human | Esophagus | ESCC | 9.85e-18 | -1.84e-02 | 0.1276 |
| 56925 | LXN | P28T-E | Human | Esophagus | ESCC | 1.09e-09 | 1.32e-01 | 0.1149 |
| 56925 | LXN | P32T-E | Human | Esophagus | ESCC | 7.39e-13 | -2.01e-02 | 0.1666 |
| 56925 | LXN | P38T-E | Human | Esophagus | ESCC | 1.76e-06 | 7.51e-02 | 0.127 |
| 56925 | LXN | P42T-E | Human | Esophagus | ESCC | 6.73e-04 | -8.97e-02 | 0.1175 |
| 56925 | LXN | P44T-E | Human | Esophagus | ESCC | 4.37e-08 | 5.31e-01 | 0.1096 |
| 56925 | LXN | P47T-E | Human | Esophagus | ESCC | 1.27e-02 | 1.23e-01 | 0.1067 |
| 56925 | LXN | P48T-E | Human | Esophagus | ESCC | 8.36e-05 | 3.19e-01 | 0.0959 |
| 56925 | LXN | P49T-E | Human | Esophagus | ESCC | 2.45e-02 | 2.18e-01 | 0.1768 |
| 56925 | LXN | P52T-E | Human | Esophagus | ESCC | 3.19e-06 | 9.57e-03 | 0.1555 |
| Page: 1 2 3 |
| Tissue | Expression Dynamics | Abbreviation |
| Esophagus |  | ESCC: Esophageal squamous cell carcinoma |
| HGIN: High-grade intraepithelial neoplasias | ||
| LGIN: Low-grade intraepithelial neoplasias | ||
| Oral Cavity | 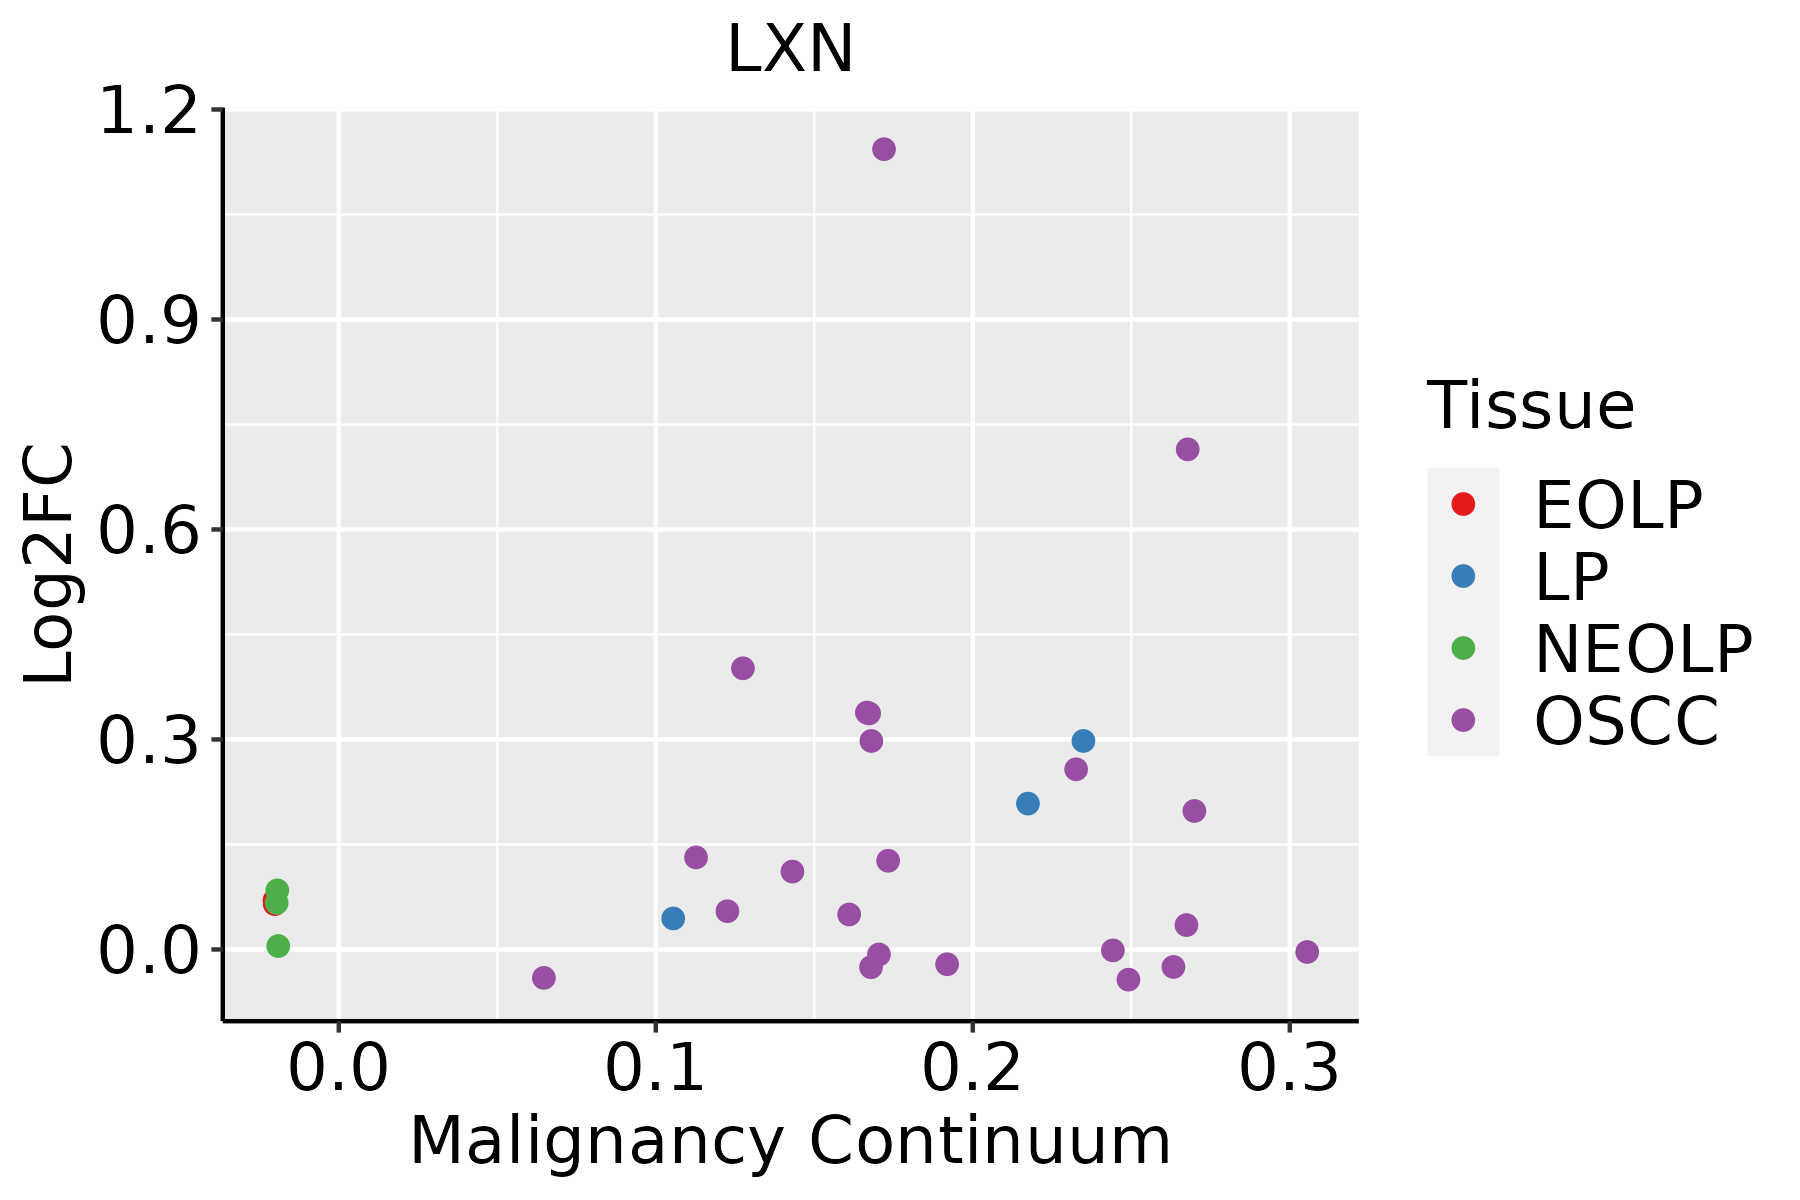 | EOLP: Erosive Oral lichen planus |
| LP: leukoplakia | ||
| NEOLP: Non-erosive oral lichen planus | ||
| OSCC: Oral squamous cell carcinoma | ||
| Prostate | 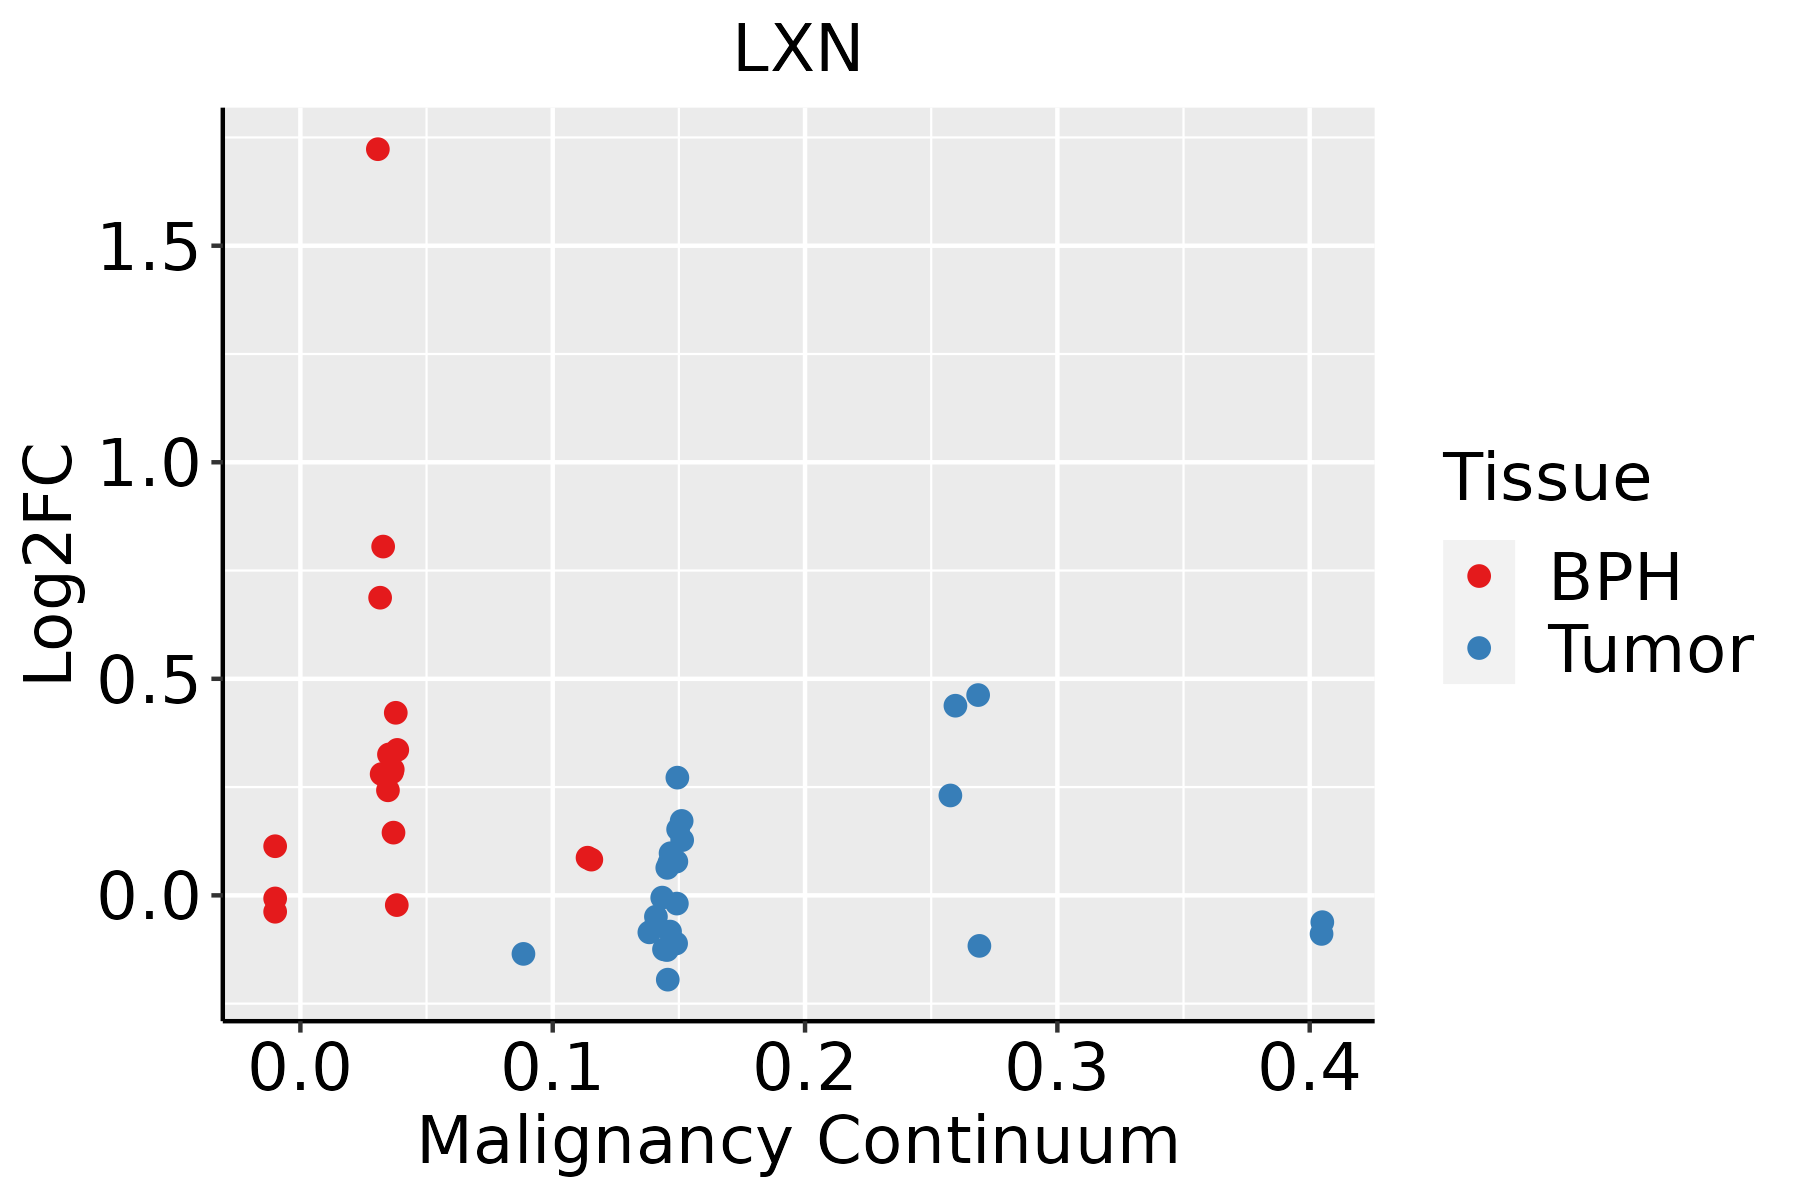 | BPH: Benign Prostatic Hyperplasia |
| Thyroid |  | ATC: Anaplastic thyroid cancer |
| HT: Hashimoto's thyroiditis | ||
| PTC: Papillary thyroid cancer |
| ∗log2FC in expression of this searched gene in stem-like cells from each diseased tissue sample relative to stem-like cells in normal samples in each tissue plotted against the malignancy continuum. Samples are colored based on if they are from different disease stage. |
Top |
Malignant transformation related pathway analysis |
| Find out the enriched GO biological processes and KEGG pathways involved in transition from healthy to precancer to cancer |
| Tissue | Disease Stage | Enriched GO biological Processes |
| Colorectum | AD |  |
| Colorectum | SER |  |
| Colorectum | MSS |  |
| Colorectum | MSI-H |  |
| Colorectum | FAP |  |
| ∗Top 15 enriched GO BP terms are showed in the bar plot of each disease state in each tissue. Each row represents a significant GO biological process which is colored according to the -log10(p.adjust). |
| Page: 1 2 3 4 5 6 7 8 9 |
| GO ID | Tissue | Disease Stage | Description | Gene Ratio | Bg Ratio | pvalue | p.adjust | Count |
| GO:000184315 | Skin | cSCC | neural tube closure | 37/4864 | 88/18723 | 7.39e-04 | 5.15e-03 | 37 |
| GO:005076913 | Skin | cSCC | positive regulation of neurogenesis | 80/4864 | 225/18723 | 8.85e-04 | 6.07e-03 | 80 |
| GO:006060615 | Skin | cSCC | tube closure | 37/4864 | 89/18723 | 9.52e-04 | 6.47e-03 | 37 |
| GO:000184117 | Skin | cSCC | neural tube formation | 41/4864 | 102/18723 | 1.16e-03 | 7.61e-03 | 41 |
| GO:000183822 | Skin | cSCC | embryonic epithelial tube formation | 47/4864 | 121/18723 | 1.26e-03 | 8.18e-03 | 47 |
| GO:001633113 | Skin | cSCC | morphogenesis of embryonic epithelium | 55/4864 | 147/18723 | 1.45e-03 | 9.11e-03 | 55 |
| GO:000836025 | Skin | cSCC | regulation of cell shape | 57/4864 | 154/18723 | 1.61e-03 | 9.90e-03 | 57 |
| GO:002261221 | Skin | cSCC | gland morphogenesis | 45/4864 | 118/18723 | 2.43e-03 | 1.39e-02 | 45 |
| GO:003514822 | Skin | cSCC | tube formation | 54/4864 | 148/18723 | 3.00e-03 | 1.66e-02 | 54 |
| GO:007217521 | Skin | cSCC | epithelial tube formation | 49/4864 | 132/18723 | 3.06e-03 | 1.68e-02 | 49 |
| GO:005076722 | Skin | cSCC | regulation of neurogenesis | 118/4864 | 364/18723 | 3.32e-03 | 1.81e-02 | 118 |
| GO:001097522 | Skin | cSCC | regulation of neuron projection development | 141/4864 | 445/18723 | 3.72e-03 | 1.99e-02 | 141 |
| GO:006156422 | Skin | cSCC | axon development | 146/4864 | 467/18723 | 5.50e-03 | 2.73e-02 | 146 |
| GO:00507729 | Skin | cSCC | positive regulation of axonogenesis | 31/4864 | 79/18723 | 6.63e-03 | 3.23e-02 | 31 |
| GO:001097613 | Skin | cSCC | positive regulation of neuron projection development | 57/4864 | 163/18723 | 6.66e-03 | 3.24e-02 | 57 |
| GO:006056023 | Skin | cSCC | developmental growth involved in morphogenesis | 78/4864 | 234/18723 | 7.08e-03 | 3.40e-02 | 78 |
| GO:000716224 | Skin | cSCC | negative regulation of cell adhesion | 98/4864 | 303/18723 | 7.45e-03 | 3.50e-02 | 98 |
| GO:199013823 | Skin | cSCC | neuron projection extension | 59/4864 | 172/18723 | 9.20e-03 | 4.20e-02 | 59 |
| GO:005196213 | Skin | cSCC | positive regulation of nervous system development | 88/4864 | 272/18723 | 1.07e-02 | 4.66e-02 | 88 |
| GO:0051098113 | Thyroid | PTC | regulation of binding | 195/5968 | 363/18723 | 3.21e-18 | 3.37e-16 | 195 |
| Page: 1 2 3 4 5 6 7 8 9 10 11 12 13 14 15 16 17 18 19 20 21 22 23 24 25 26 27 28 29 30 31 32 33 34 35 36 37 |
| Pathway ID | Tissue | Disease Stage | Description | Gene Ratio | Bg Ratio | pvalue | p.adjust | qvalue | Count |
| Page: 1 |
Top |
Cell-cell communication analysis |
| Identification of potential cell-cell interactions between two cell types and their ligand-receptor pairs for different disease states |
| Ligand | Receptor | LRpair | Pathway | Tissue | Disease Stage |
| SEMA3D | NRP1_PLXNA2 | SEMA3D_NRP1_PLXNA2 | SEMA3 | Breast | ADJ |
| SEMA3D | NRP2_PLXNA2 | SEMA3D_NRP2_PLXNA2 | SEMA3 | Breast | ADJ |
| SEMA6A | PLXNA2 | SEMA6A_PLXNA2 | SEMA6 | Breast | ADJ |
| SEMA4A | NRP1_PLXNA4 | SEMA4A_NRP1_PLXNA4 | SEMA4 | Breast | DCIS |
| SEMA4A | PLXNB2 | SEMA4A_PLXNB2 | SEMA4 | Breast | DCIS |
| SEMA4D | PLXNB2 | SEMA4D_PLXNB2 | SEMA4 | Breast | DCIS |
| SEMA3C | NRP1_PLXNA4 | SEMA3C_NRP1_PLXNA4 | SEMA3 | Breast | DCIS |
| SEMA3D | NRP1_PLXNA4 | SEMA3D_NRP1_PLXNA4 | SEMA3 | Breast | DCIS |
| SEMA3C | PLXND1 | SEMA3C_PLXND1 | SEMA3 | Breast | DCIS |
| SEMA7A | PLXNC1 | SEMA7A_PLXNC1 | SEMA7 | Breast | DCIS |
| SEMA6A | PLXNA4 | SEMA6A_PLXNA4 | SEMA6 | Breast | DCIS |
| SEMA3C | NRP1_PLXNA2 | SEMA3C_NRP1_PLXNA2 | SEMA3 | Breast | Healthy |
| SEMA3D | NRP1_PLXNA2 | SEMA3D_NRP1_PLXNA2 | SEMA3 | Breast | Healthy |
| SEMA3C | NRP2_PLXNA2 | SEMA3C_NRP2_PLXNA2 | SEMA3 | Breast | Healthy |
| SEMA3D | NRP2_PLXNA2 | SEMA3D_NRP2_PLXNA2 | SEMA3 | Breast | Healthy |
| SEMA3C | PLXND1 | SEMA3C_PLXND1 | SEMA3 | Breast | Healthy |
| SEMA4D | PLXNB2 | SEMA4D_PLXNB2 | SEMA4 | Breast | Healthy |
| SEMA6A | PLXNA2 | SEMA6A_PLXNA2 | SEMA6 | Breast | Healthy |
| SEMA6B | PLXNA2 | SEMA6B_PLXNA2 | SEMA6 | Breast | Healthy |
| SEMA4D | PLXNB2 | SEMA4D_PLXNB2 | SEMA4 | Breast | IDC |
| Page: 1 |
Top |
Single-cell gene regulatory network inference analysis |
| Find out the significant the regulons (TFs) and the target genes of each regulon across cell types for different disease states |
| TF | Cell Type | Tissue | Disease Stage | Target Gene | RSS | Regulon Activity |
| ∗The dot plots of a searched regulon are shown for all cell subpopulations in each disease state of each tissue based on the regulon specific score inferred using pySCENIC and by calculating the average expression. |
| Page: 1 |
Top |
Somatic mutation of malignant transformation related genes |
| Annotation of somatic variants for genes involved in malignant transformation |
| Hugo Symbol | Variant Class | Variant Classification | dbSNP RS | HGVSc | HGVSp | HGVSp Short | SWISSPROT | BIOTYPE | SIFT | PolyPhen | Tumor Sample Barcode | Tissue | Histology | Sex | Age | Stage | Therapy Types | Drugs | Outcome |
| LXN | SNV | Missense_Mutation | novel | c.326N>C | p.Arg109Thr | p.R109T | Q9BS40 | protein_coding | deleterious(0.01) | benign(0.118) | TCGA-A7-A6VY-01 | Breast | breast invasive carcinoma | Female | <65 | I/II | Chemotherapy | cyclophosphamide | CR |
| LXN | SNV | Missense_Mutation | rs758509037 | c.250N>A | p.Ala84Thr | p.A84T | Q9BS40 | protein_coding | tolerated(0.11) | benign(0.245) | TCGA-BH-A0WA-01 | Breast | breast invasive carcinoma | Female | >=65 | I/II | Unknown | Unknown | SD |
| LXN | SNV | Missense_Mutation | c.356N>A | p.Ala119Glu | p.A119E | Q9BS40 | protein_coding | tolerated(0.06) | probably_damaging(0.997) | TCGA-VS-A9UU-01 | Cervix | cervical & endocervical cancer | Female | <65 | I/II | Chemotherapy | cisplatin | CR | |
| LXN | SNV | Missense_Mutation | rs758088046 | c.101T>C | p.Val34Ala | p.V34A | Q9BS40 | protein_coding | deleterious(0.01) | benign(0.12) | TCGA-5M-AAT6-01 | Colorectum | colon adenocarcinoma | Female | <65 | III/IV | Unknown | Unknown | PD |
| LXN | SNV | Missense_Mutation | c.595G>C | p.Val199Leu | p.V199L | Q9BS40 | protein_coding | tolerated(0.08) | benign(0.117) | TCGA-A6-5657-01 | Colorectum | colon adenocarcinoma | Male | >=65 | III/IV | Ancillary | leucovorin | SD | |
| LXN | SNV | Missense_Mutation | novel | c.189N>C | p.Gln63His | p.Q63H | Q9BS40 | protein_coding | tolerated(0.25) | benign(0.003) | TCGA-CA-6717-01 | Colorectum | colon adenocarcinoma | Male | <65 | I/II | Chemotherapy | oxaliplatin | CR |
| LXN | SNV | Missense_Mutation | novel | c.471N>C | p.Trp157Cys | p.W157C | Q9BS40 | protein_coding | tolerated(0.19) | benign(0.068) | TCGA-A5-A0G1-01 | Endometrium | uterine corpus endometrioid carcinoma | Female | >=65 | I/II | Unknown | Unknown | SD |
| LXN | SNV | Missense_Mutation | novel | c.180N>C | p.Glu60Asp | p.E60D | Q9BS40 | protein_coding | tolerated(0.78) | benign(0.026) | TCGA-B5-A3FA-01 | Endometrium | uterine corpus endometrioid carcinoma | Female | >=65 | I/II | Unknown | Unknown | SD |
| LXN | SNV | Missense_Mutation | c.651N>T | p.Lys217Asn | p.K217N | Q9BS40 | protein_coding | deleterious(0) | possibly_damaging(0.604) | TCGA-BS-A0UF-01 | Endometrium | uterine corpus endometrioid carcinoma | Female | >=65 | I/II | Unknown | Unknown | SD | |
| LXN | SNV | Missense_Mutation | novel | c.486A>C | p.Lys162Asn | p.K162N | Q9BS40 | protein_coding | deleterious(0.01) | possibly_damaging(0.811) | TCGA-E6-A1LX-01 | Endometrium | uterine corpus endometrioid carcinoma | Female | <65 | I/II | Unknown | Unknown | SD |
| Page: 1 2 |
Top |
Related drugs of malignant transformation related genes |
| Identification of chemicals and drugs interact with genes involved in malignant transfromation |
| (DGIdb 4.0) |
| Entrez ID | Symbol | Category | Interaction Types | Drug Claim Name | Drug Name | PMIDs |
| Page: 1 |

Copyright 2023-Present -The University of Texas Health Science Center at Houston |