
|
|||||
|
 | |
| |
| |
| |
| |
| |
|
Gene: KHDRBS1 |
Gene summary for KHDRBS1 |
| Gene information | Species | Human | Gene symbol | KHDRBS1 | Gene ID | 10657 |
| Gene name | KH RNA binding domain containing, signal transduction associated 1 | |
| Gene Alias | Sam68 | |
| Cytomap | 1p35.2 | |
| Gene Type | protein-coding | GO ID | GO:0000003 | UniProtAcc | Q07666 |
Top |
Malignant transformation analysis |
| Identification of the aberrant gene expression in precancerous and cancerous lesions by comparing the gene expression of stem-like cells in diseased tissues with normal stem cells |
| Entrez ID | Symbol | Replicates | Species | Organ | Tissue | Adj P-value | Log2FC | Malignancy |
| 10657 | KHDRBS1 | HTA11_1938_2000001011 | Human | Colorectum | AD | 2.42e-04 | 5.69e-01 | -0.0811 |
| 10657 | KHDRBS1 | HTA11_78_2000001011 | Human | Colorectum | AD | 1.06e-02 | 4.86e-01 | -0.1088 |
| 10657 | KHDRBS1 | HTA11_347_2000001011 | Human | Colorectum | AD | 4.61e-14 | 7.14e-01 | -0.1954 |
| 10657 | KHDRBS1 | HTA11_1391_2000001011 | Human | Colorectum | AD | 4.35e-05 | 7.00e-01 | -0.059 |
| 10657 | KHDRBS1 | HTA11_7696_3000711011 | Human | Colorectum | AD | 5.84e-03 | 5.09e-01 | 0.0674 |
| 10657 | KHDRBS1 | HTA11_99999970781_79442 | Human | Colorectum | MSS | 3.78e-12 | 7.09e-01 | 0.294 |
| 10657 | KHDRBS1 | HTA11_99999965062_69753 | Human | Colorectum | MSI-H | 7.94e-11 | 1.40e+00 | 0.3487 |
| 10657 | KHDRBS1 | HTA11_99999965104_69814 | Human | Colorectum | MSS | 7.55e-11 | 8.39e-01 | 0.281 |
| 10657 | KHDRBS1 | HTA11_99999971662_82457 | Human | Colorectum | MSS | 1.89e-03 | 6.76e-01 | 0.3859 |
| 10657 | KHDRBS1 | F007 | Human | Colorectum | FAP | 7.65e-04 | -3.64e-01 | 0.1176 |
| 10657 | KHDRBS1 | A001-C-207 | Human | Colorectum | FAP | 1.38e-02 | -2.73e-01 | 0.1278 |
| 10657 | KHDRBS1 | A015-C-203 | Human | Colorectum | FAP | 1.19e-26 | -4.43e-01 | -0.1294 |
| 10657 | KHDRBS1 | A015-C-204 | Human | Colorectum | FAP | 3.84e-05 | -2.84e-01 | -0.0228 |
| 10657 | KHDRBS1 | A014-C-040 | Human | Colorectum | FAP | 2.15e-04 | -4.96e-01 | -0.1184 |
| 10657 | KHDRBS1 | A002-C-201 | Human | Colorectum | FAP | 1.10e-08 | -2.28e-01 | 0.0324 |
| 10657 | KHDRBS1 | A002-C-203 | Human | Colorectum | FAP | 6.29e-04 | -1.81e-01 | 0.2786 |
| 10657 | KHDRBS1 | A001-C-119 | Human | Colorectum | FAP | 1.07e-02 | -2.34e-01 | -0.1557 |
| 10657 | KHDRBS1 | A001-C-108 | Human | Colorectum | FAP | 1.04e-14 | -2.81e-01 | -0.0272 |
| 10657 | KHDRBS1 | A002-C-205 | Human | Colorectum | FAP | 1.33e-18 | -3.89e-01 | -0.1236 |
| 10657 | KHDRBS1 | A015-C-005 | Human | Colorectum | FAP | 5.07e-03 | -2.75e-01 | -0.0336 |
| Page: 1 2 3 4 5 6 7 8 9 10 11 |
| Tissue | Expression Dynamics | Abbreviation |
| Colorectum (GSE201348) |  | FAP: Familial adenomatous polyposis |
| CRC: Colorectal cancer | ||
| Colorectum (HTA11) |  | AD: Adenomas |
| SER: Sessile serrated lesions | ||
| MSI-H: Microsatellite-high colorectal cancer | ||
| MSS: Microsatellite stable colorectal cancer | ||
| Endometrium | 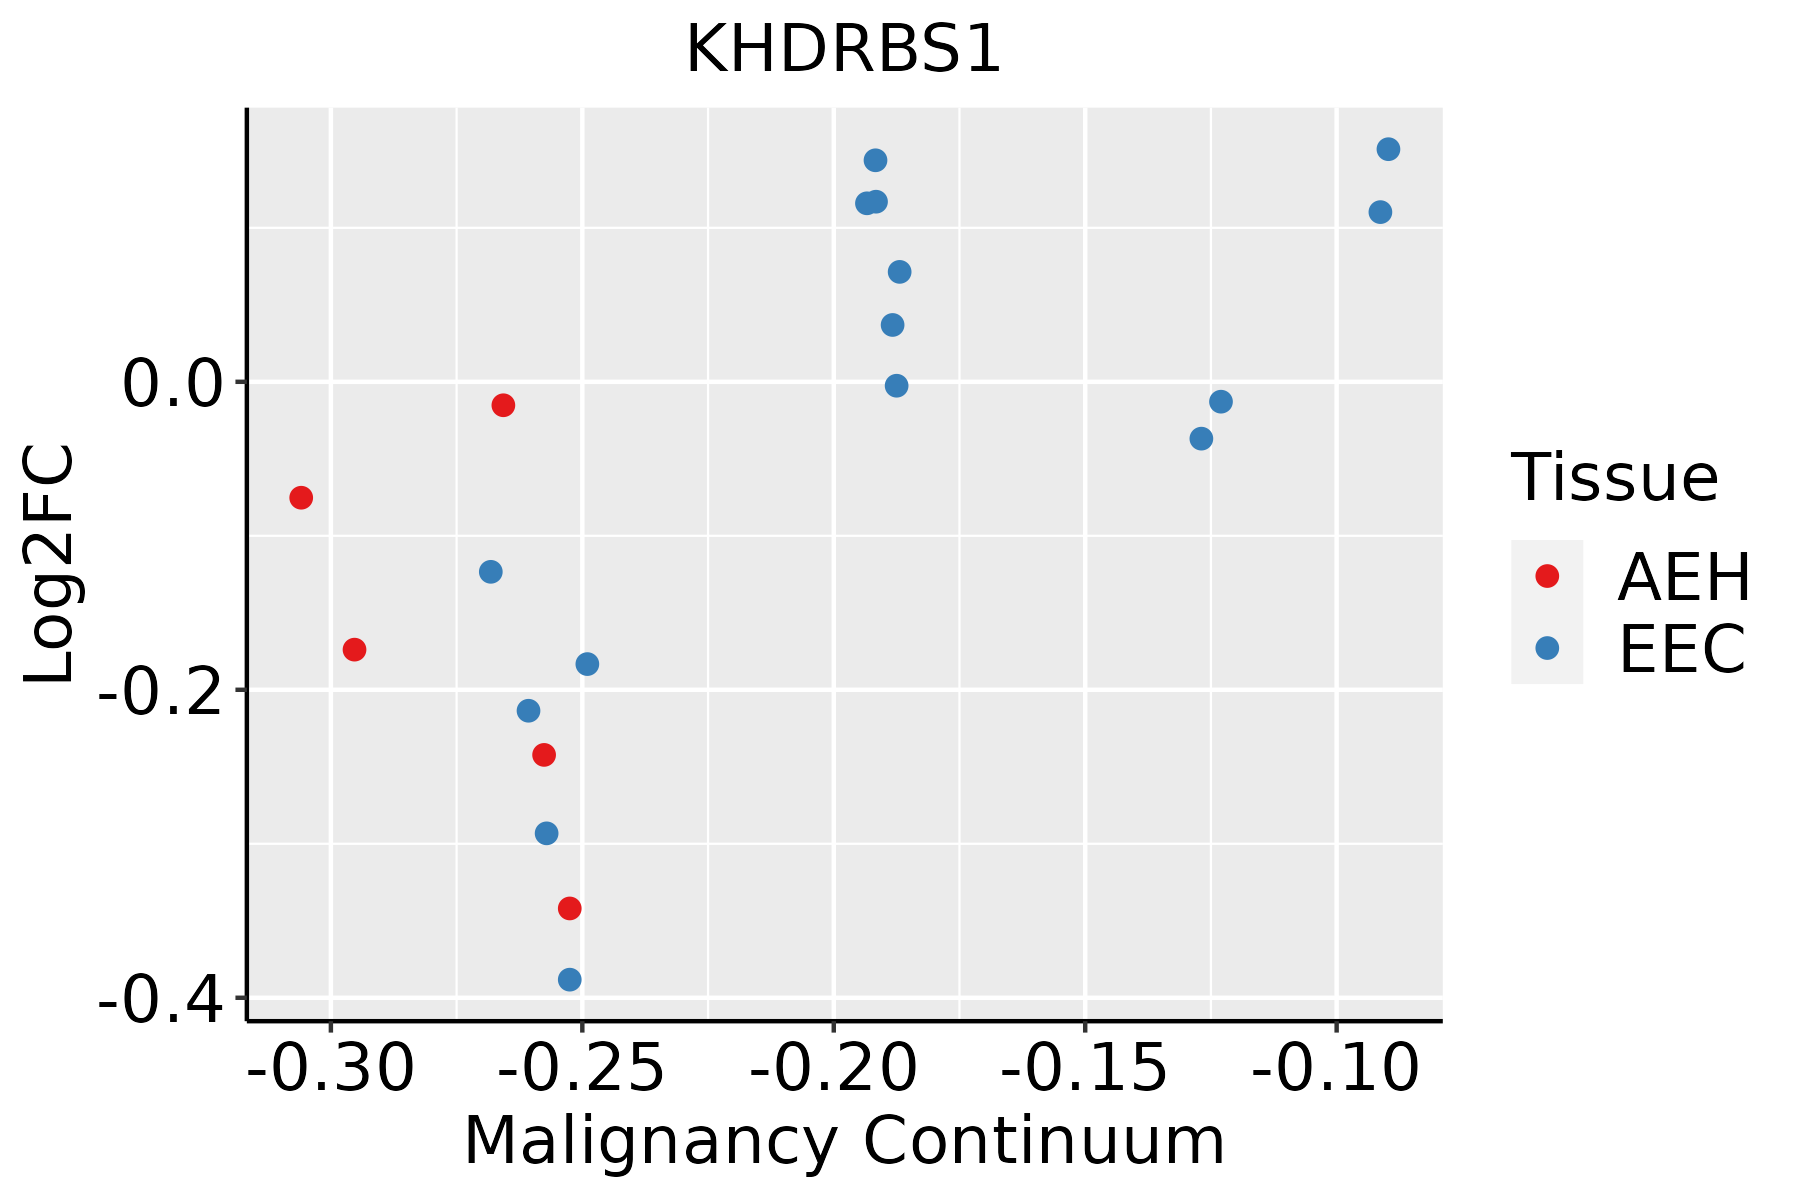 | AEH: Atypical endometrial hyperplasia |
| EEC: Endometrioid Cancer | ||
| Esophagus | 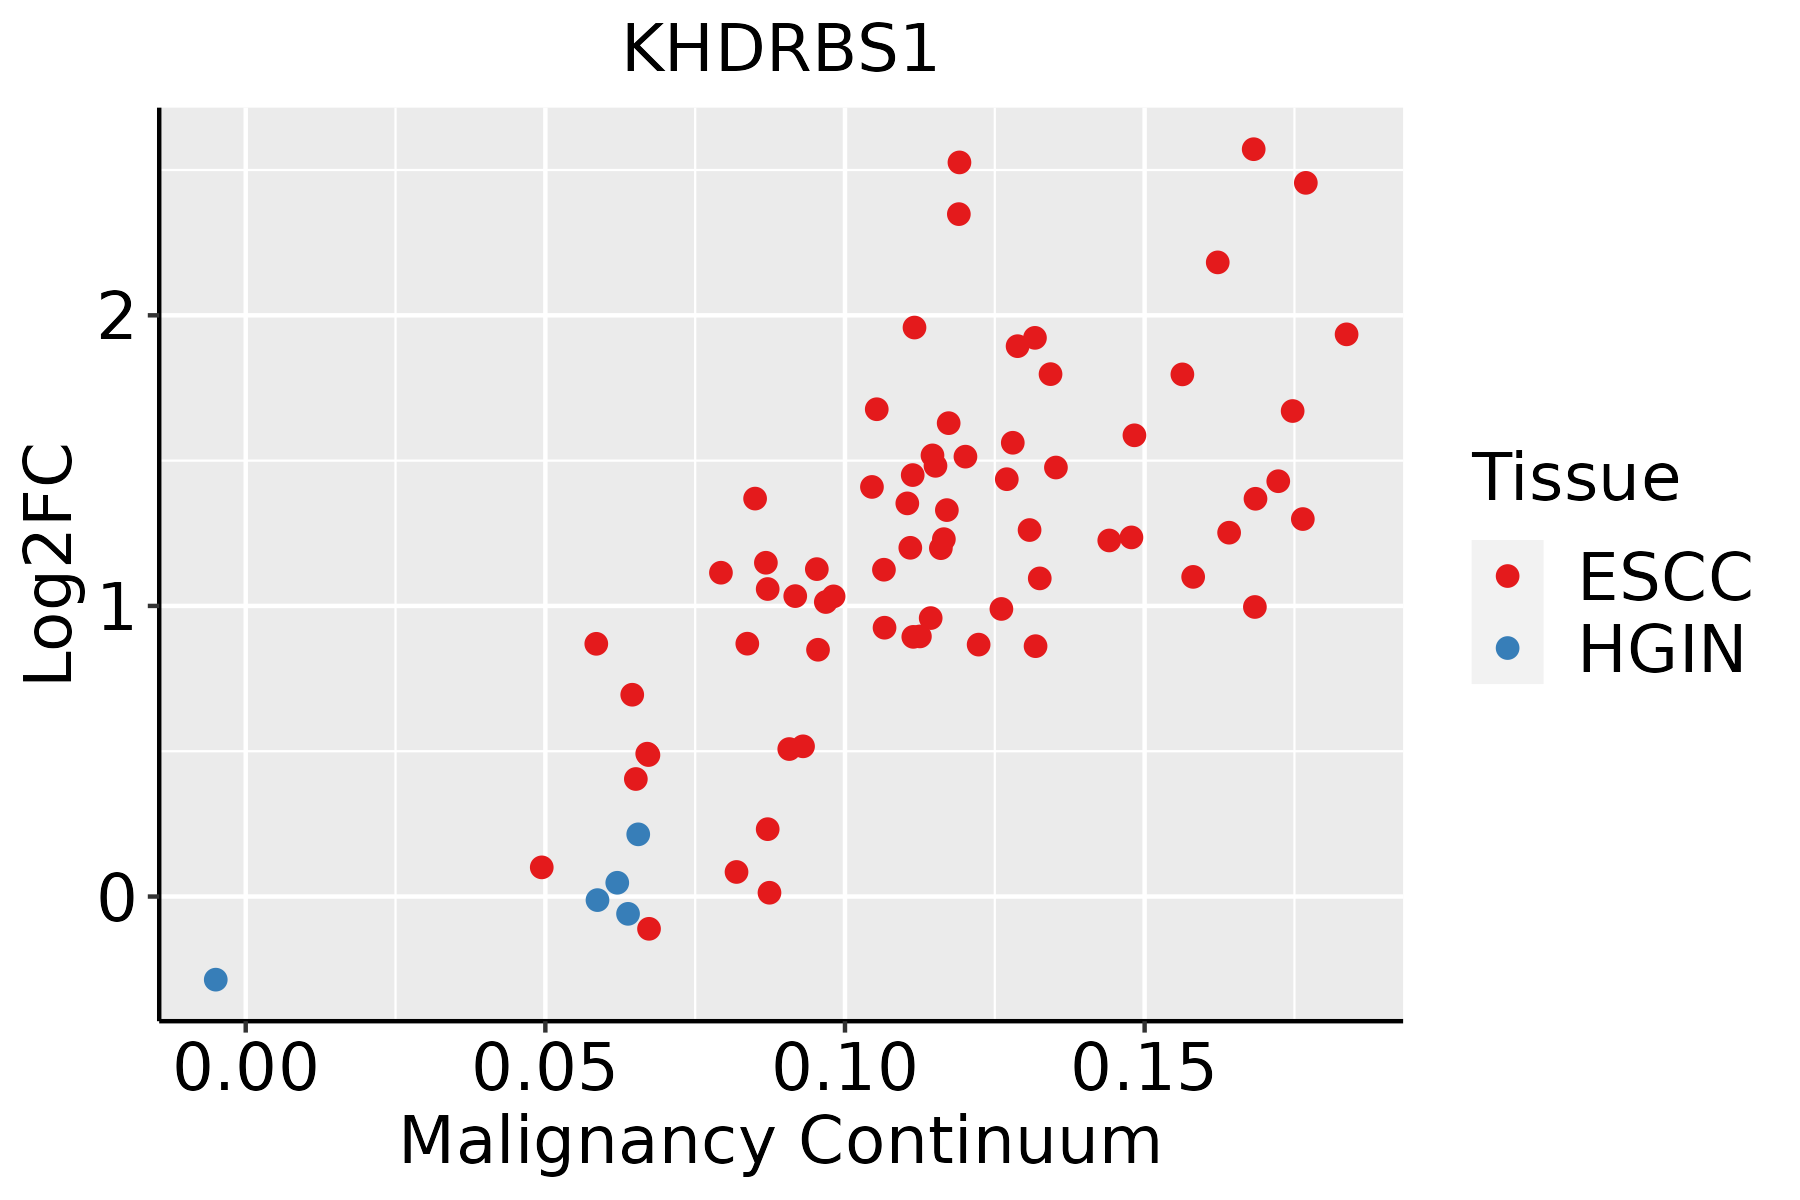 | ESCC: Esophageal squamous cell carcinoma |
| HGIN: High-grade intraepithelial neoplasias | ||
| LGIN: Low-grade intraepithelial neoplasias | ||
| Liver | 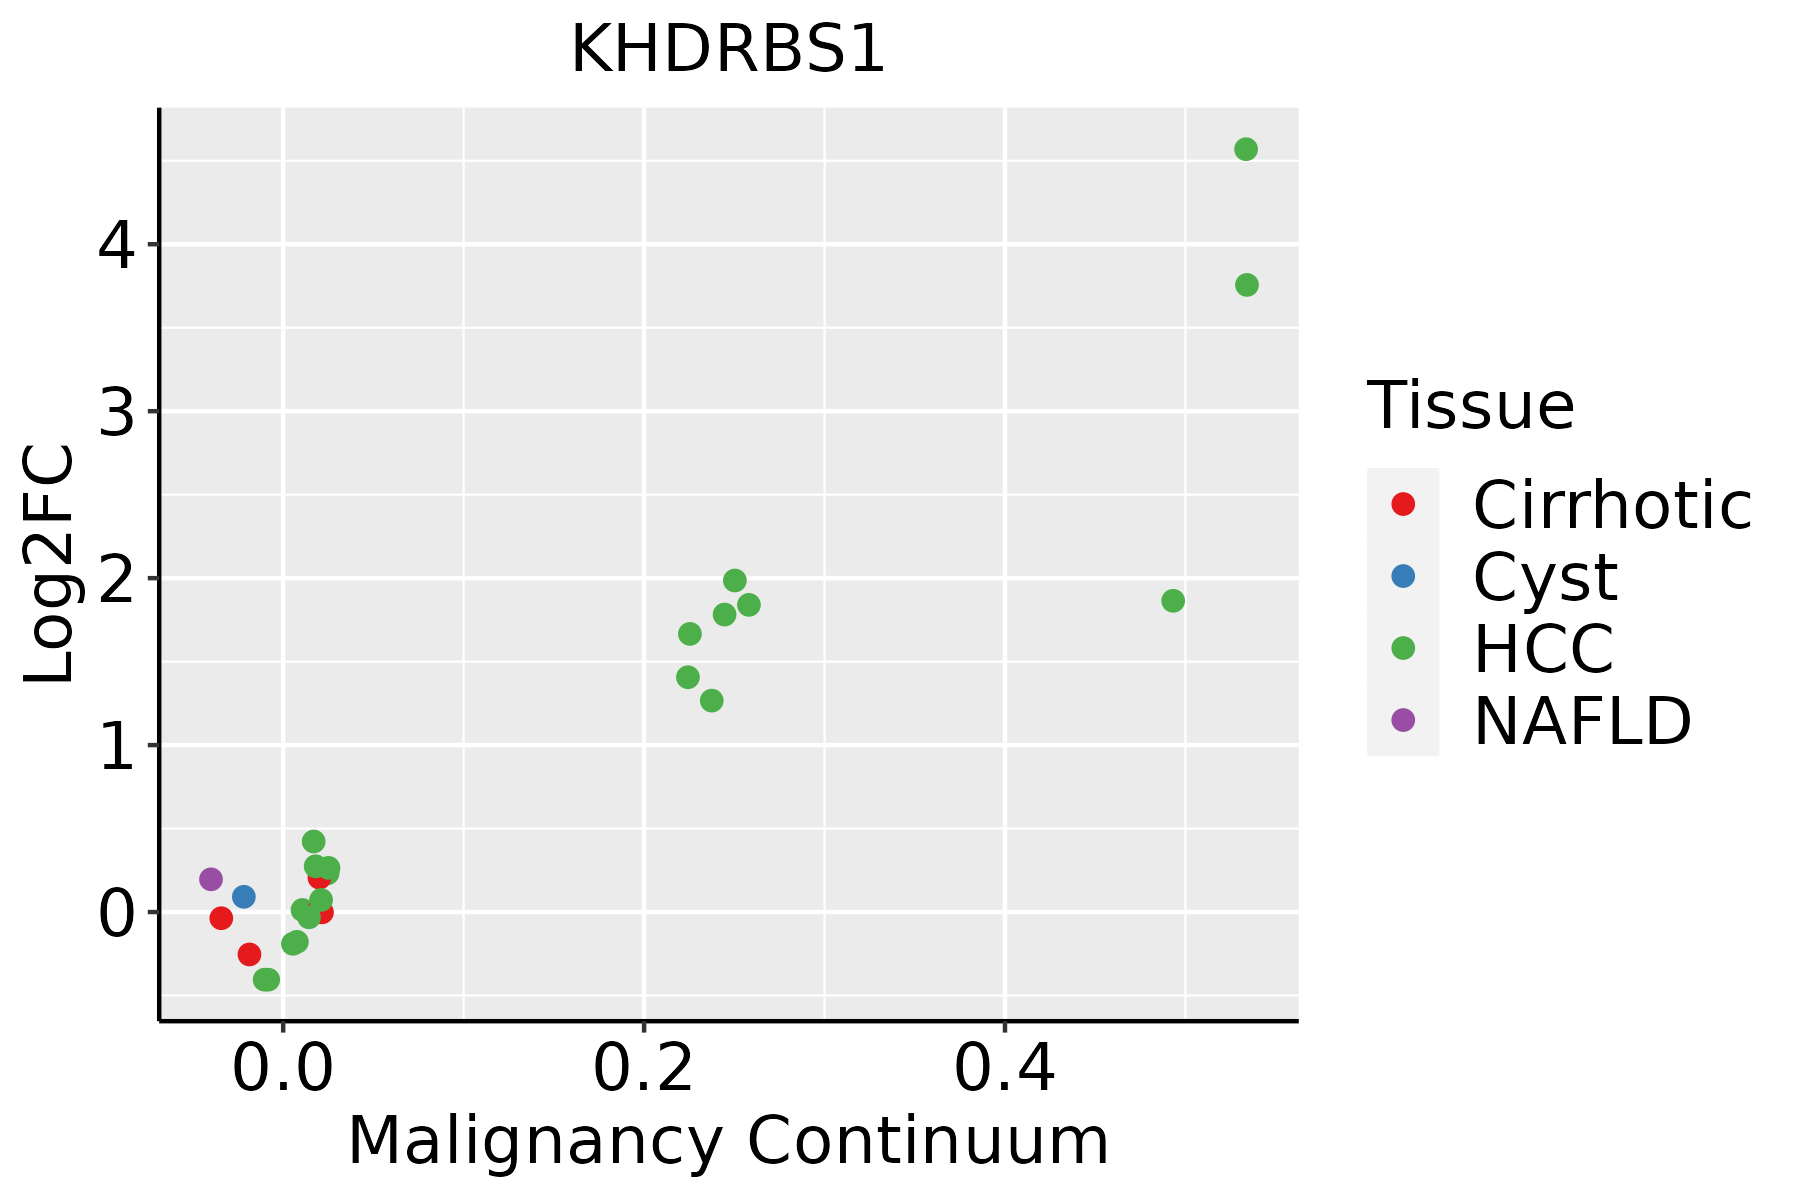 | HCC: Hepatocellular carcinoma |
| NAFLD: Non-alcoholic fatty liver disease | ||
| Lung | 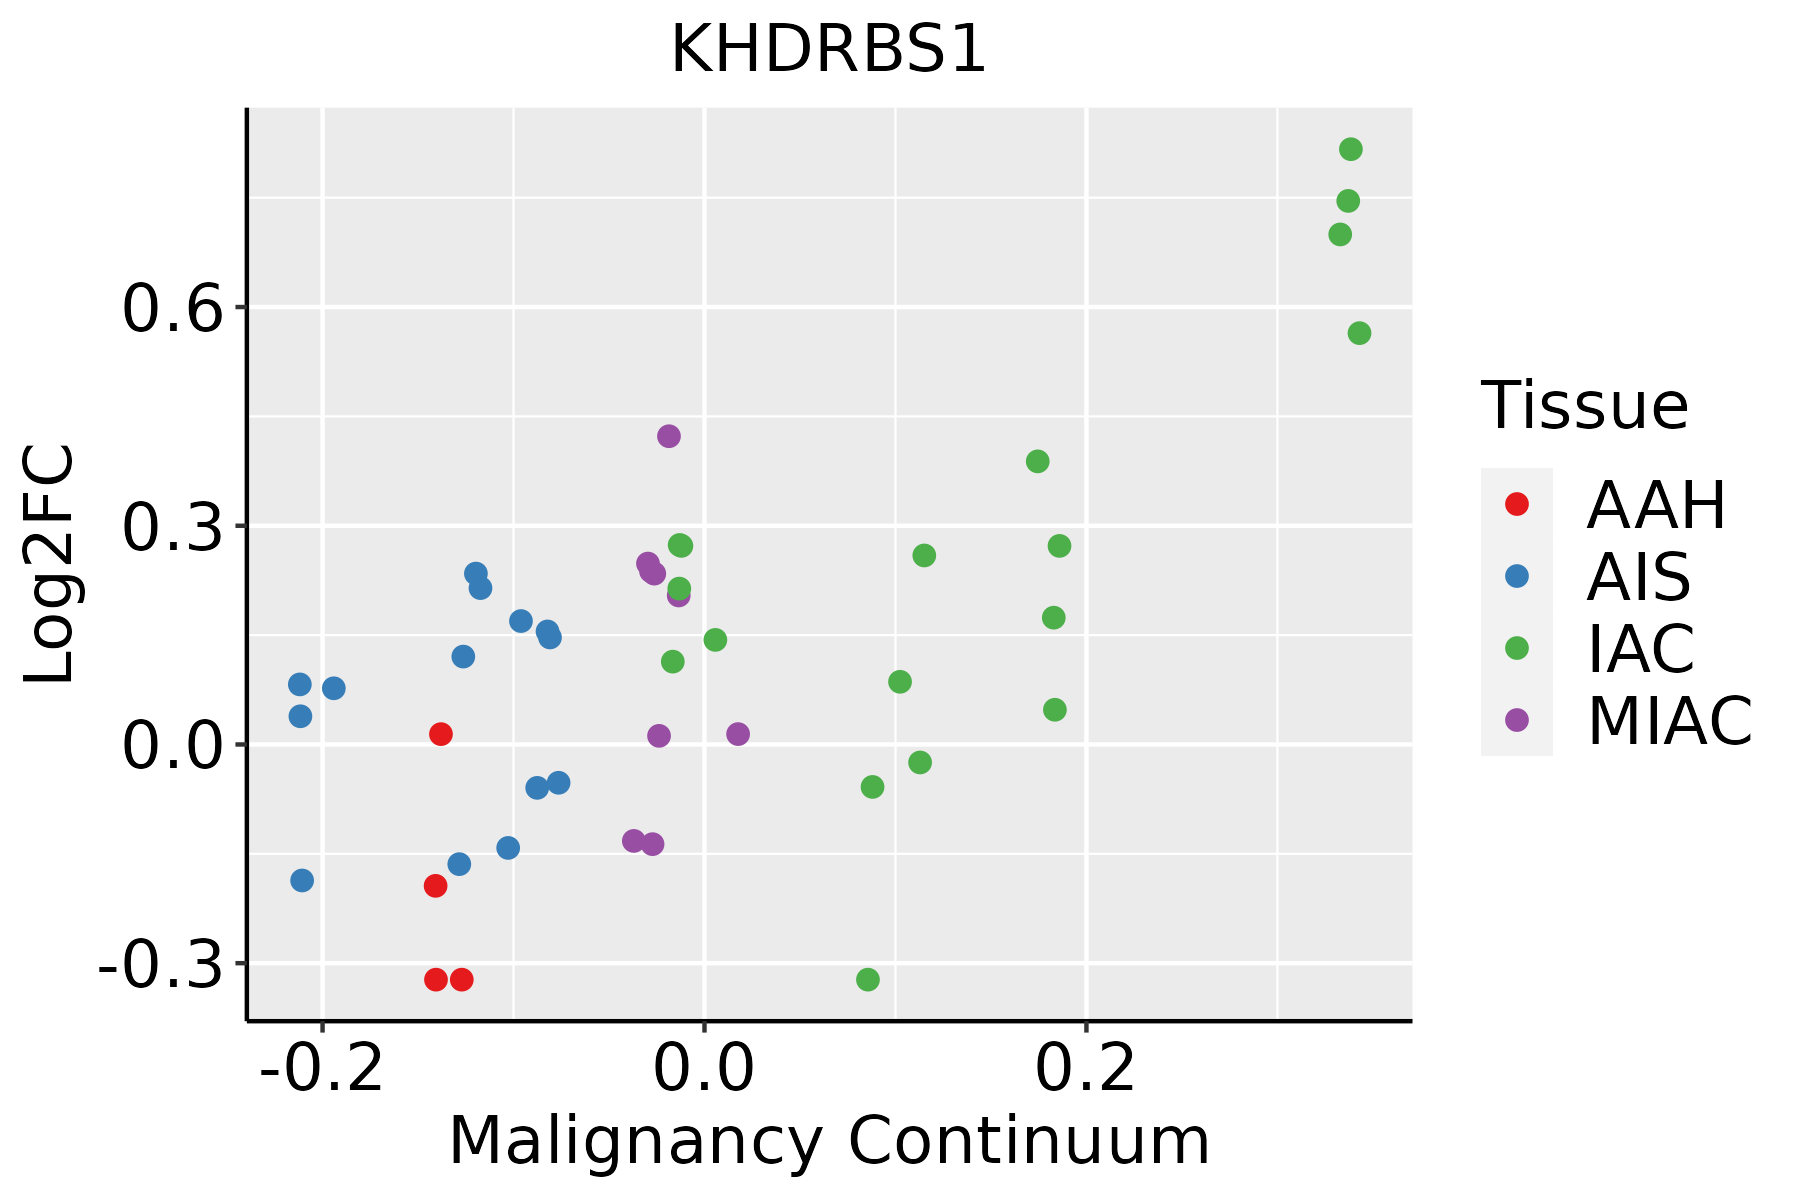 | AAH: Atypical adenomatous hyperplasia |
| AIS: Adenocarcinoma in situ | ||
| IAC: Invasive lung adenocarcinoma | ||
| MIA: Minimally invasive adenocarcinoma | ||
| Oral Cavity | 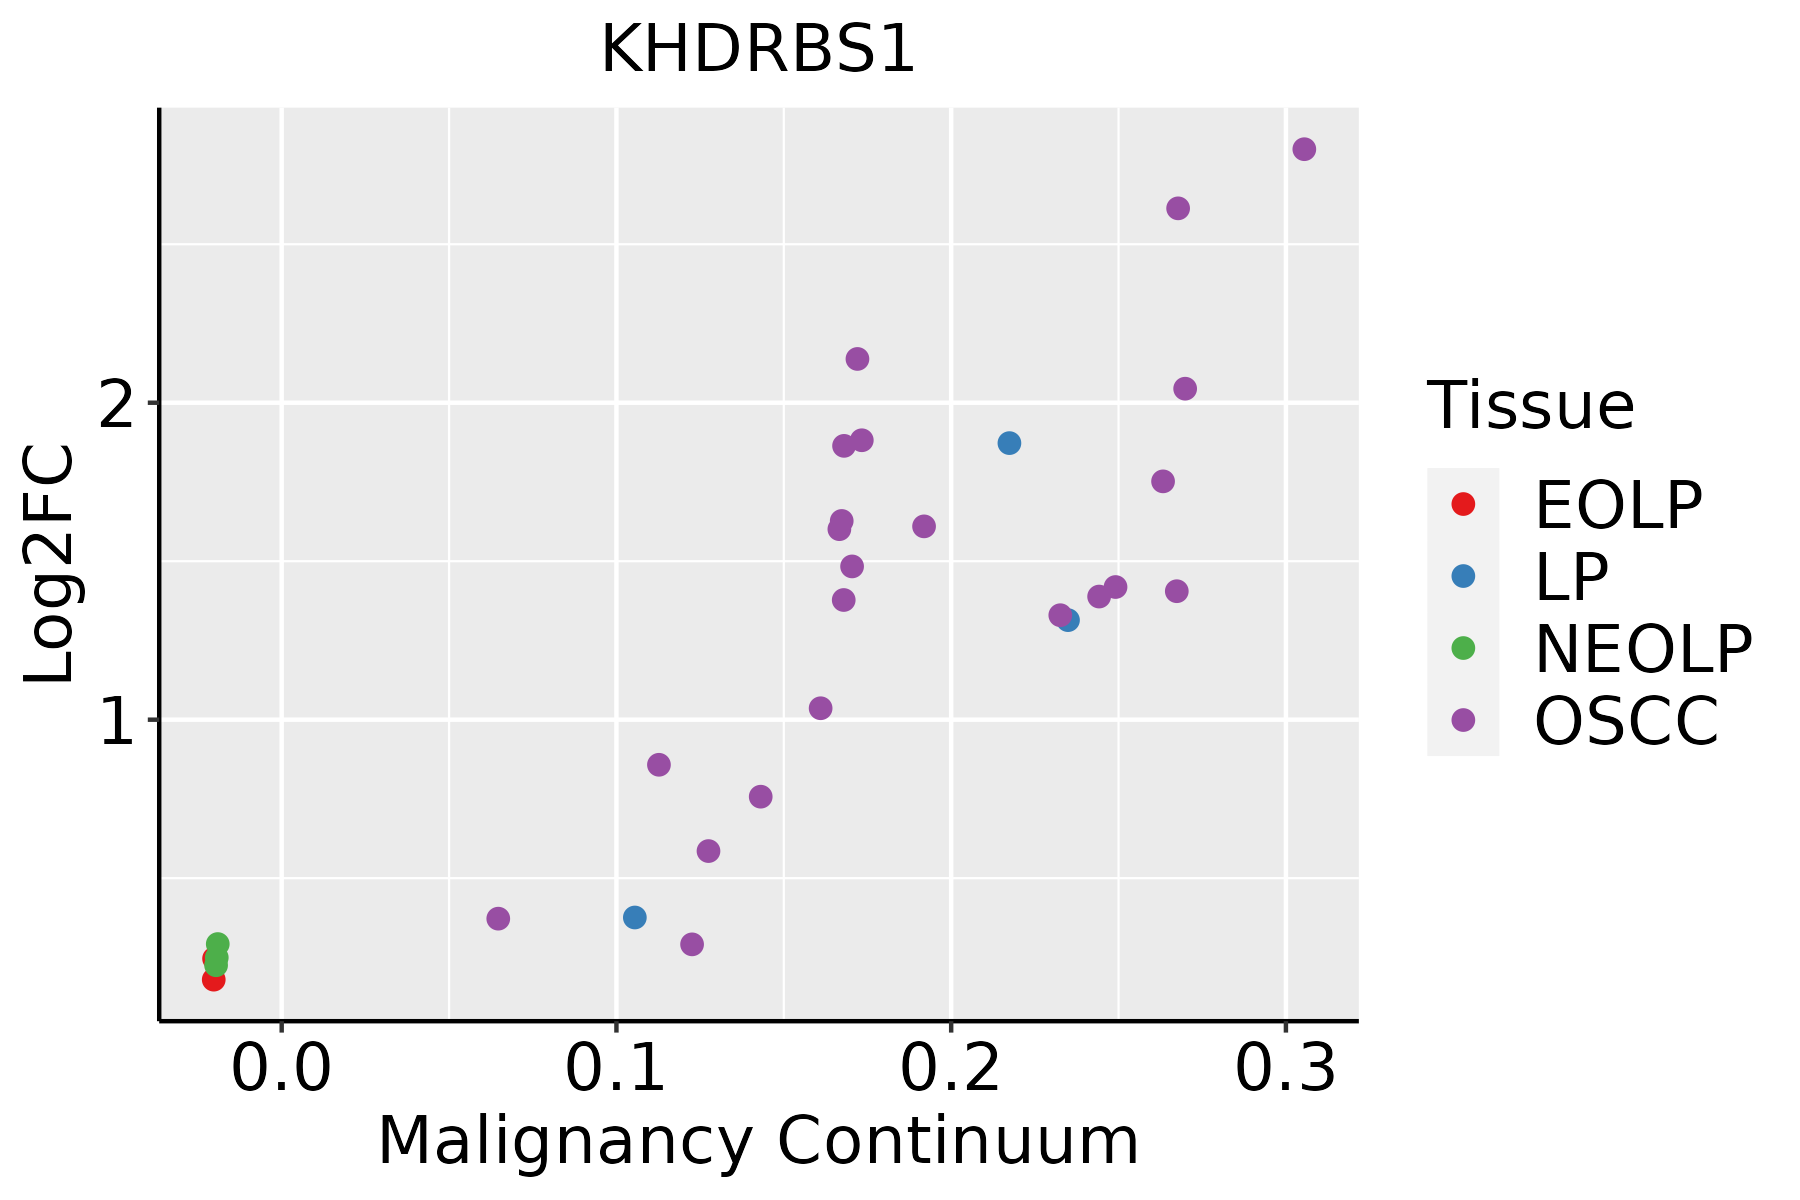 | EOLP: Erosive Oral lichen planus |
| LP: leukoplakia | ||
| NEOLP: Non-erosive oral lichen planus | ||
| OSCC: Oral squamous cell carcinoma | ||
| Prostate | 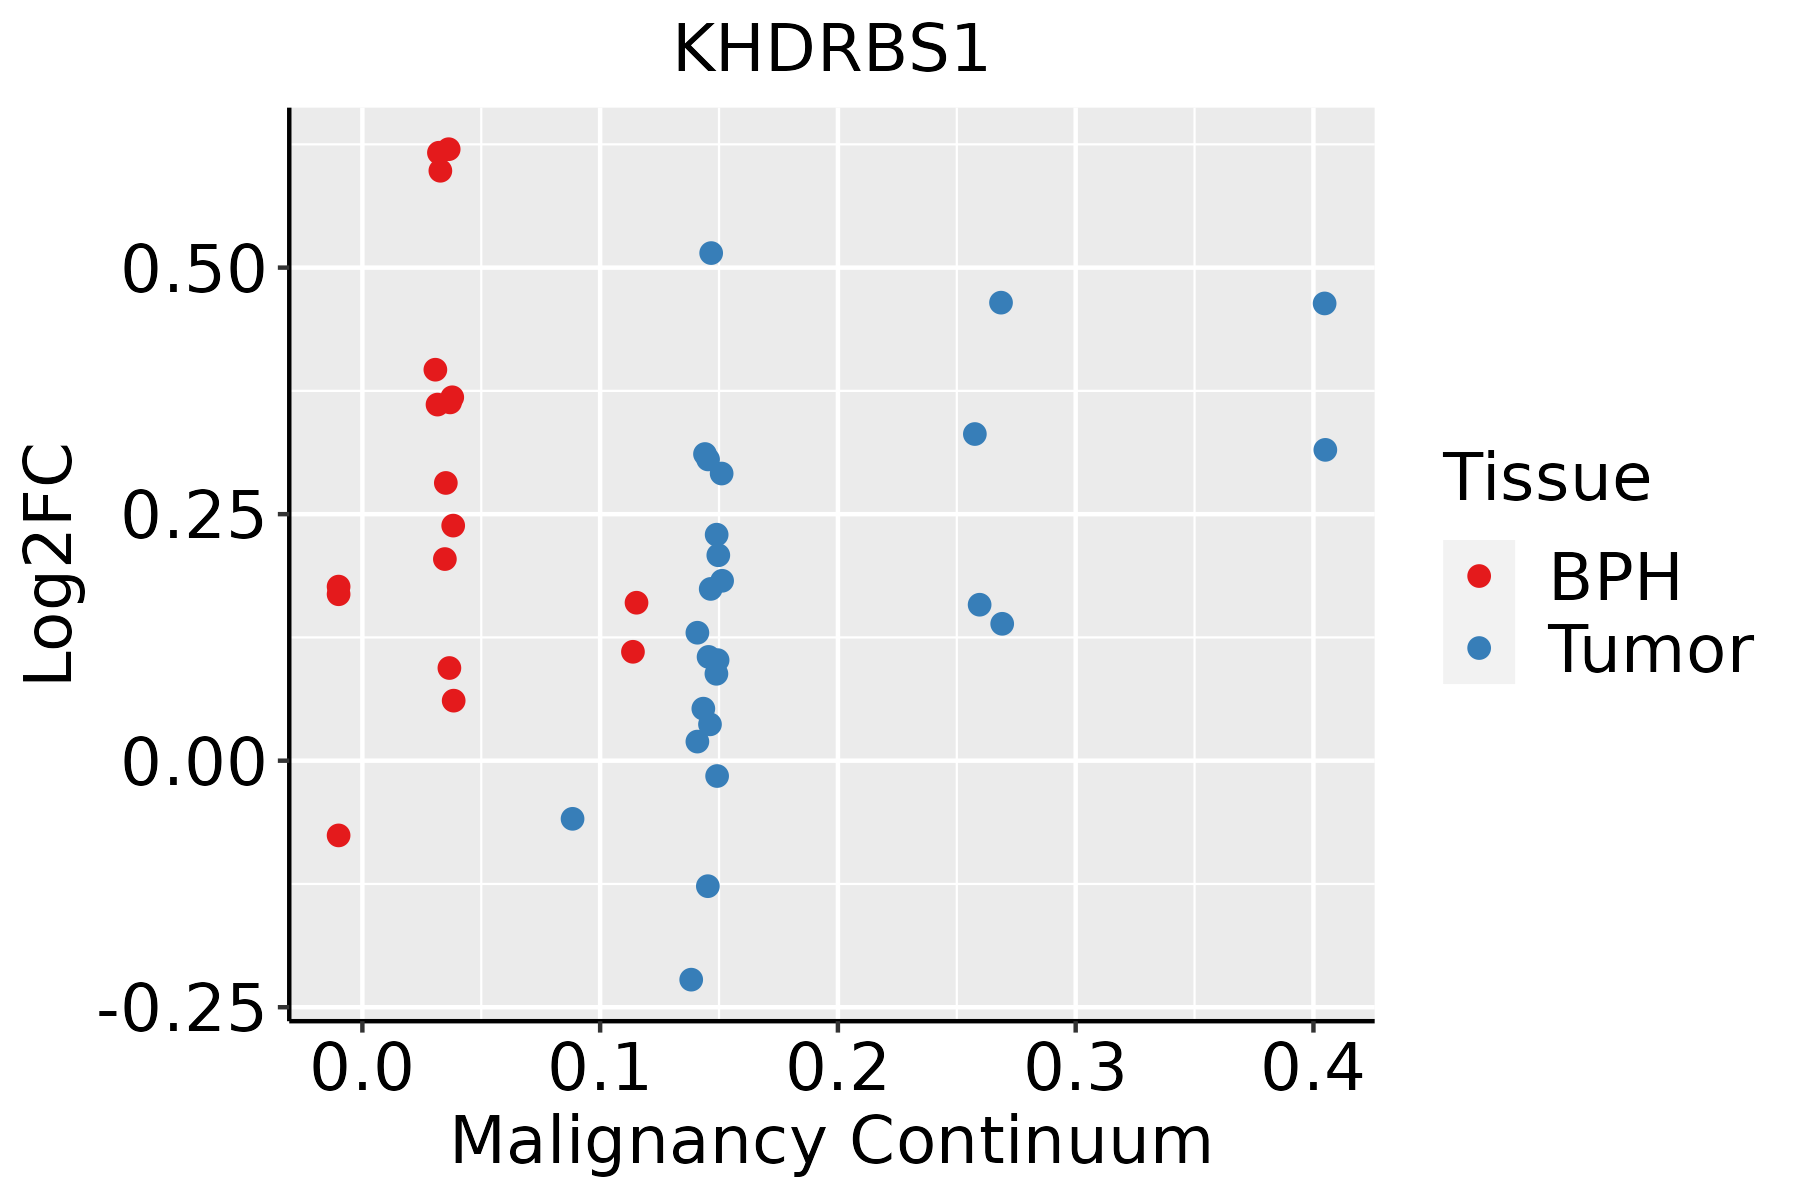 | BPH: Benign Prostatic Hyperplasia |
| Skin |  | AK: Actinic keratosis |
| cSCC: Cutaneous squamous cell carcinoma | ||
| SCCIS:squamous cell carcinoma in situ | ||
| Thyroid | 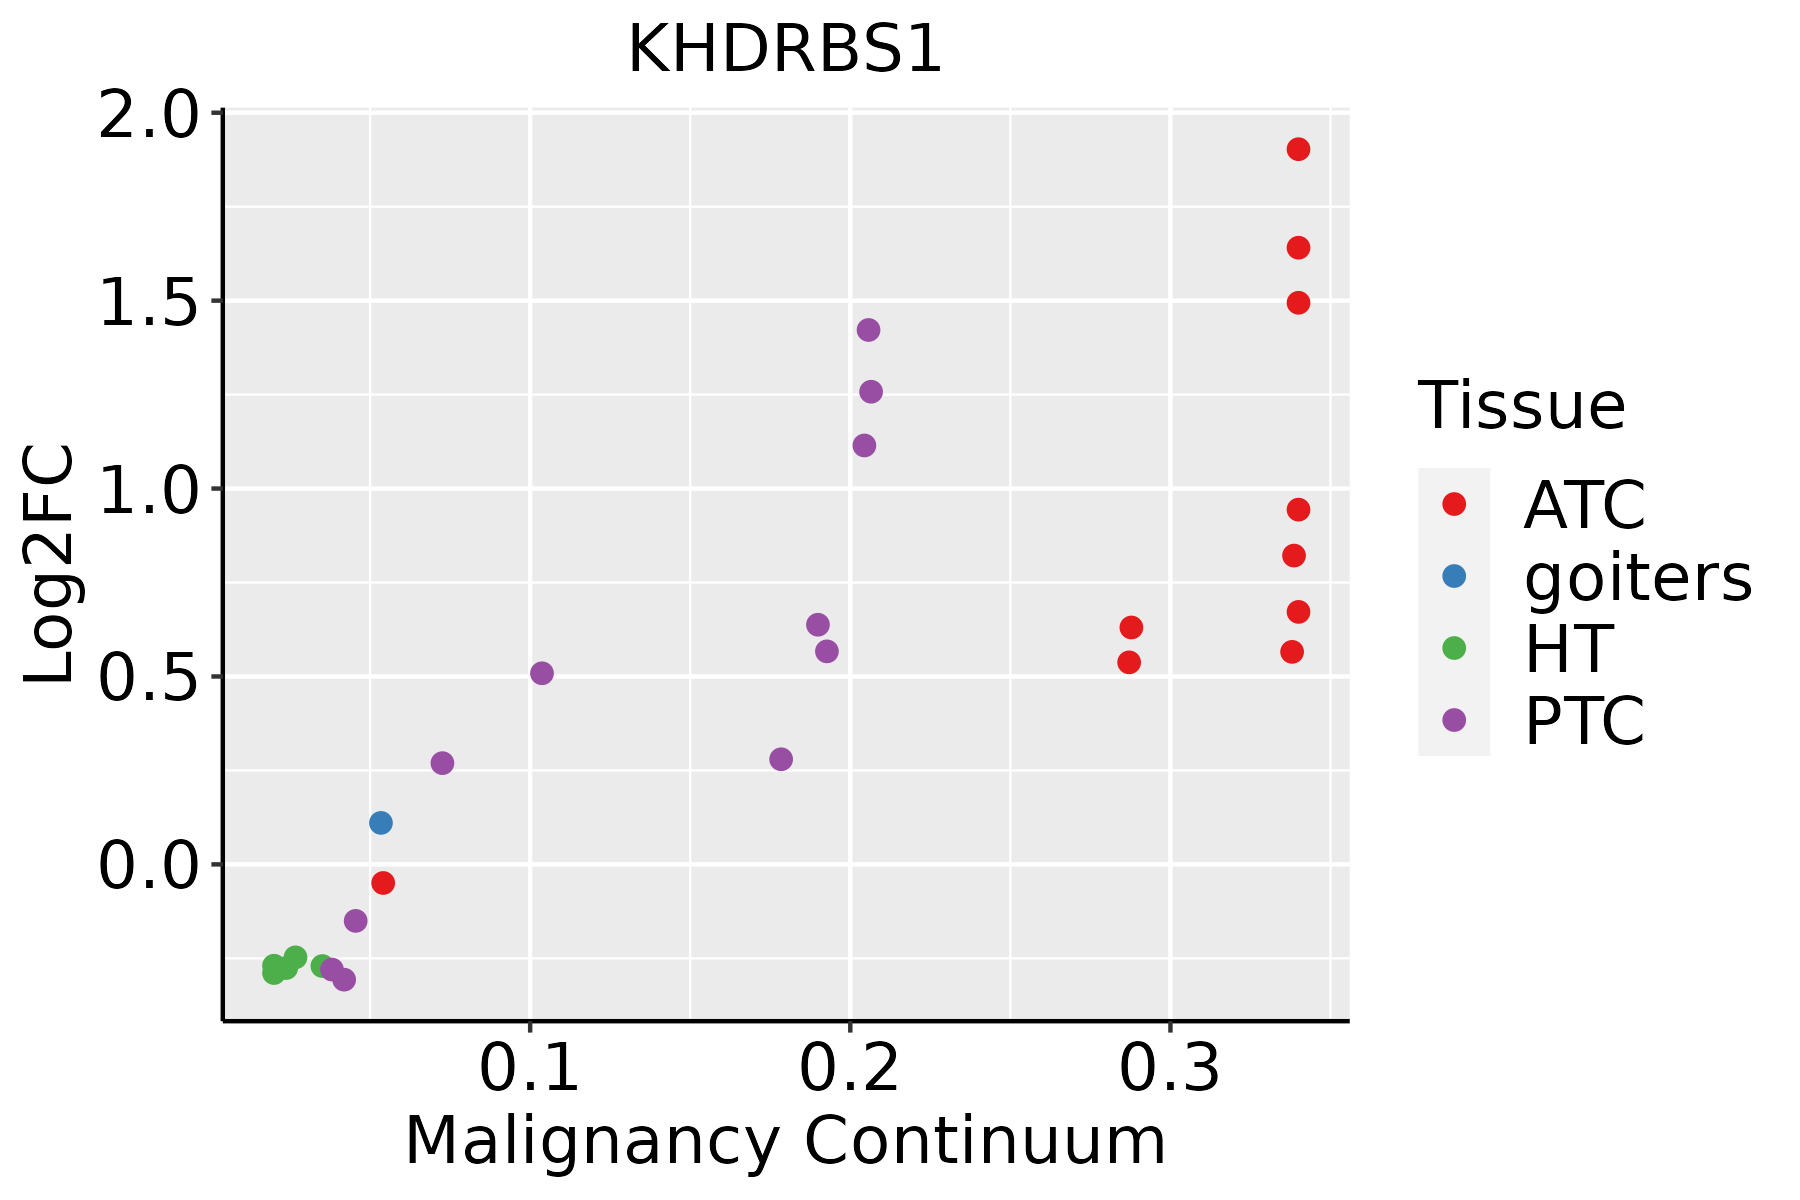 | ATC: Anaplastic thyroid cancer |
| HT: Hashimoto's thyroiditis | ||
| PTC: Papillary thyroid cancer |
| ∗log2FC in expression of this searched gene in stem-like cells from each diseased tissue sample relative to stem-like cells in normal samples in each tissue plotted against the malignancy continuum. Samples are colored based on if they are from different disease stage. |
Top |
Malignant transformation related pathway analysis |
| Find out the enriched GO biological processes and KEGG pathways involved in transition from healthy to precancer to cancer |
| Tissue | Disease Stage | Enriched GO biological Processes |
| Colorectum | AD |  |
| Colorectum | SER |  |
| Colorectum | MSS |  |
| Colorectum | MSI-H |  |
| Colorectum | FAP |  |
| ∗Top 15 enriched GO BP terms are showed in the bar plot of each disease state in each tissue. Each row represents a significant GO biological process which is colored according to the -log10(p.adjust). |
| Page: 1 2 3 4 5 6 7 8 9 |
| GO ID | Tissue | Disease Stage | Description | Gene Ratio | Bg Ratio | pvalue | p.adjust | Count |
| GO:00322392 | Oral cavity | NEOLP | regulation of nucleobase-containing compound transport | 8/2005 | 15/18723 | 5.49e-05 | 7.44e-04 | 8 |
| GO:000008231 | Oral cavity | NEOLP | G1/S transition of mitotic cell cycle | 40/2005 | 214/18723 | 3.21e-04 | 3.11e-03 | 40 |
| GO:000276422 | Oral cavity | NEOLP | immune response-regulating signaling pathway | 74/2005 | 468/18723 | 3.90e-04 | 3.63e-03 | 74 |
| GO:004477231 | Oral cavity | NEOLP | mitotic cell cycle phase transition | 67/2005 | 424/18723 | 7.30e-04 | 5.98e-03 | 67 |
| GO:000640531 | Oral cavity | NEOLP | RNA export from nucleus | 19/2005 | 84/18723 | 1.20e-03 | 8.85e-03 | 19 |
| GO:004484331 | Oral cavity | NEOLP | cell cycle G1/S phase transition | 41/2005 | 241/18723 | 1.87e-03 | 1.28e-02 | 41 |
| GO:000225313 | Oral cavity | NEOLP | activation of immune response | 55/2005 | 375/18723 | 9.87e-03 | 4.62e-02 | 55 |
| GO:000641718 | Prostate | BPH | regulation of translation | 157/3107 | 468/18723 | 9.09e-20 | 5.63e-17 | 157 |
| GO:190331116 | Prostate | BPH | regulation of mRNA metabolic process | 111/3107 | 288/18723 | 2.28e-19 | 1.17e-16 | 111 |
| GO:000838018 | Prostate | BPH | RNA splicing | 147/3107 | 434/18723 | 5.17e-19 | 2.29e-16 | 147 |
| GO:004348418 | Prostate | BPH | regulation of RNA splicing | 71/3107 | 148/18723 | 6.14e-19 | 2.53e-16 | 71 |
| GO:000641316 | Prostate | BPH | translational initiation | 59/3107 | 118/18723 | 4.78e-17 | 1.14e-14 | 59 |
| GO:005068415 | Prostate | BPH | regulation of mRNA processing | 64/3107 | 137/18723 | 1.73e-16 | 3.82e-14 | 64 |
| GO:000037517 | Prostate | BPH | RNA splicing, via transesterification reactions | 114/3107 | 324/18723 | 2.19e-16 | 4.53e-14 | 114 |
| GO:000037717 | Prostate | BPH | RNA splicing, via transesterification reactions with bulged adenosine as nucleophile | 112/3107 | 320/18723 | 6.21e-16 | 1.07e-13 | 112 |
| GO:000039817 | Prostate | BPH | mRNA splicing, via spliceosome | 112/3107 | 320/18723 | 6.21e-16 | 1.07e-13 | 112 |
| GO:004802418 | Prostate | BPH | regulation of mRNA splicing, via spliceosome | 51/3107 | 101/18723 | 3.74e-15 | 5.26e-13 | 51 |
| GO:003425017 | Prostate | BPH | positive regulation of cellular amide metabolic process | 67/3107 | 162/18723 | 5.89e-14 | 6.51e-12 | 67 |
| GO:004572717 | Prostate | BPH | positive regulation of translation | 59/3107 | 136/18723 | 1.53e-13 | 1.58e-11 | 59 |
| GO:003238610 | Prostate | BPH | regulation of intracellular transport | 106/3107 | 337/18723 | 8.77e-12 | 6.70e-10 | 106 |
| Page: 1 2 3 4 5 6 7 8 9 10 11 12 13 14 15 16 17 18 19 20 21 22 23 24 25 26 27 28 29 30 31 32 33 34 35 36 37 |
| Pathway ID | Tissue | Disease Stage | Description | Gene Ratio | Bg Ratio | pvalue | p.adjust | qvalue | Count |
| Page: 1 |
Top |
Cell-cell communication analysis |
| Identification of potential cell-cell interactions between two cell types and their ligand-receptor pairs for different disease states |
| Ligand | Receptor | LRpair | Pathway | Tissue | Disease Stage |
| Page: 1 |
Top |
Single-cell gene regulatory network inference analysis |
| Find out the significant the regulons (TFs) and the target genes of each regulon across cell types for different disease states |
| TF | Cell Type | Tissue | Disease Stage | Target Gene | RSS | Regulon Activity |
| ∗The dot plots of a searched regulon are shown for all cell subpopulations in each disease state of each tissue based on the regulon specific score inferred using pySCENIC and by calculating the average expression. |
| Page: 1 |
Top |
Somatic mutation of malignant transformation related genes |
| Annotation of somatic variants for genes involved in malignant transformation |
| Hugo Symbol | Variant Class | Variant Classification | dbSNP RS | HGVSc | HGVSp | HGVSp Short | SWISSPROT | BIOTYPE | SIFT | PolyPhen | Tumor Sample Barcode | Tissue | Histology | Sex | Age | Stage | Therapy Types | Drugs | Outcome |
| KHDRBS1 | SNV | Missense_Mutation | novel | c.845N>A | p.Arg282His | p.R282H | Q07666 | protein_coding | deleterious(0.02) | probably_damaging(0.994) | TCGA-VS-A94X-01 | Cervix | cervical & endocervical cancer | Female | <65 | I/II | Chemotherapy | cisplatin | PD |
| KHDRBS1 | SNV | Missense_Mutation | novel | c.308N>G | p.Tyr103Cys | p.Y103C | Q07666 | protein_coding | tolerated(0.05) | probably_damaging(0.981) | TCGA-5M-AAT6-01 | Colorectum | colon adenocarcinoma | Female | <65 | III/IV | Unknown | Unknown | PD |
| KHDRBS1 | SNV | Missense_Mutation | c.1106N>G | p.Tyr369Cys | p.Y369C | Q07666 | protein_coding | deleterious(0.02) | benign(0.322) | TCGA-AA-3715-01 | Colorectum | colon adenocarcinoma | Male | >=65 | I/II | Unknown | Unknown | PD | |
| KHDRBS1 | SNV | Missense_Mutation | c.637N>T | p.Arg213Cys | p.R213C | Q07666 | protein_coding | deleterious(0.02) | probably_damaging(0.998) | TCGA-AA-A01R-01 | Colorectum | colon adenocarcinoma | Male | <65 | III/IV | Chemotherapy | 5-fluorouracil | PD | |
| KHDRBS1 | SNV | Missense_Mutation | c.538N>A | p.Gln180Lys | p.Q180K | Q07666 | protein_coding | tolerated(0.76) | benign(0.127) | TCGA-AD-6548-01 | Colorectum | colon adenocarcinoma | Female | >=65 | I/II | Unknown | Unknown | SD | |
| KHDRBS1 | SNV | Missense_Mutation | novel | c.854G>A | p.Gly285Glu | p.G285E | Q07666 | protein_coding | deleterious(0.03) | benign(0.131) | TCGA-AG-A014-01 | Colorectum | rectum adenocarcinoma | Male | >=65 | I/II | Unknown | Unknown | SD |
| KHDRBS1 | insertion | Frame_Shift_Ins | novel | c.261_262insC | p.Ser90LeufsTer41 | p.S90Lfs*41 | Q07666 | protein_coding | TCGA-AD-6889-01 | Colorectum | colon adenocarcinoma | Male | >=65 | I/II | Chemotherapy | xeloda | PD | ||
| KHDRBS1 | insertion | Frame_Shift_Ins | novel | c.934dupG | p.Ala312GlyfsTer56 | p.A312Gfs*56 | Q07666 | protein_coding | TCGA-CM-6674-01 | Colorectum | colon adenocarcinoma | Male | <65 | I/II | Unknown | Unknown | SD | ||
| KHDRBS1 | SNV | Missense_Mutation | novel | c.1049N>T | p.Ala350Val | p.A350V | Q07666 | protein_coding | deleterious(0.03) | benign(0.105) | TCGA-A5-A0G2-01 | Endometrium | uterine corpus endometrioid carcinoma | Female | <65 | III/IV | Unknown | Unknown | SD |
| KHDRBS1 | SNV | Missense_Mutation | novel | c.871C>T | p.Arg291Trp | p.R291W | Q07666 | protein_coding | deleterious(0.04) | benign(0.019) | TCGA-AJ-A3NE-01 | Endometrium | uterine corpus endometrioid carcinoma | Female | <65 | I/II | Unknown | Unknown | SD |
| Page: 1 2 3 |
Top |
Related drugs of malignant transformation related genes |
| Identification of chemicals and drugs interact with genes involved in malignant transfromation |
| (DGIdb 4.0) |
| Entrez ID | Symbol | Category | Interaction Types | Drug Claim Name | Drug Name | PMIDs |
| Page: 1 |

Copyright 2023-Present -The University of Texas Health Science Center at Houston |