
|
|||||
|
 | |
| |
| |
| |
| |
| |
|
Gene: IST1 |
Gene summary for IST1 |
| Gene information | Species | Human | Gene symbol | IST1 | Gene ID | 9798 |
| Gene name | IST1 factor associated with ESCRT-III | |
| Gene Alias | CHMP8 | |
| Cytomap | 16q22.2 | |
| Gene Type | protein-coding | GO ID | GO:0000902 | UniProtAcc | P53990 |
Top |
Malignant transformation analysis |
| Identification of the aberrant gene expression in precancerous and cancerous lesions by comparing the gene expression of stem-like cells in diseased tissues with normal stem cells |
| Entrez ID | Symbol | Replicates | Species | Organ | Tissue | Adj P-value | Log2FC | Malignancy |
| 9798 | IST1 | HTA11_1938_2000001011 | Human | Colorectum | AD | 6.80e-03 | 3.49e-01 | -0.0811 |
| 9798 | IST1 | HTA11_347_2000001011 | Human | Colorectum | AD | 5.74e-07 | 4.35e-01 | -0.1954 |
| 9798 | IST1 | HTA11_696_2000001011 | Human | Colorectum | AD | 2.47e-03 | 2.98e-01 | -0.1464 |
| 9798 | IST1 | HTA11_866_3004761011 | Human | Colorectum | AD | 1.04e-05 | 4.38e-01 | 0.096 |
| 9798 | IST1 | HTA11_99999970781_79442 | Human | Colorectum | MSS | 2.68e-05 | 3.58e-01 | 0.294 |
| 9798 | IST1 | HTA11_99999971662_82457 | Human | Colorectum | MSS | 1.64e-12 | 5.98e-01 | 0.3859 |
| 9798 | IST1 | A015-C-203 | Human | Colorectum | FAP | 7.11e-13 | 7.58e-02 | -0.1294 |
| 9798 | IST1 | A002-C-201 | Human | Colorectum | FAP | 8.59e-03 | -1.43e-01 | 0.0324 |
| 9798 | IST1 | A001-C-108 | Human | Colorectum | FAP | 7.12e-04 | -2.75e-02 | -0.0272 |
| 9798 | IST1 | A002-C-205 | Human | Colorectum | FAP | 5.38e-06 | -1.50e-01 | -0.1236 |
| 9798 | IST1 | A015-C-006 | Human | Colorectum | FAP | 3.67e-03 | -8.64e-02 | -0.0994 |
| 9798 | IST1 | A015-C-106 | Human | Colorectum | FAP | 1.95e-03 | 2.62e-02 | -0.0511 |
| 9798 | IST1 | A002-C-114 | Human | Colorectum | FAP | 2.96e-03 | 5.11e-02 | -0.1561 |
| 9798 | IST1 | A015-C-104 | Human | Colorectum | FAP | 2.53e-10 | 1.88e-02 | -0.1899 |
| 9798 | IST1 | A002-C-016 | Human | Colorectum | FAP | 3.90e-06 | -5.66e-02 | 0.0521 |
| 9798 | IST1 | A015-C-002 | Human | Colorectum | FAP | 1.49e-02 | -1.41e-01 | -0.0763 |
| 9798 | IST1 | A001-C-203 | Human | Colorectum | FAP | 2.53e-03 | 3.84e-02 | -0.0481 |
| 9798 | IST1 | A002-C-116 | Human | Colorectum | FAP | 1.34e-14 | -7.64e-03 | -0.0452 |
| 9798 | IST1 | A014-C-008 | Human | Colorectum | FAP | 1.09e-02 | -1.65e-01 | -0.191 |
| 9798 | IST1 | A018-E-020 | Human | Colorectum | FAP | 1.14e-04 | -6.30e-02 | -0.2034 |
| Page: 1 2 3 4 5 6 7 |
| Tissue | Expression Dynamics | Abbreviation |
| Colorectum (GSE201348) |  | FAP: Familial adenomatous polyposis |
| CRC: Colorectal cancer | ||
| Colorectum (HTA11) | 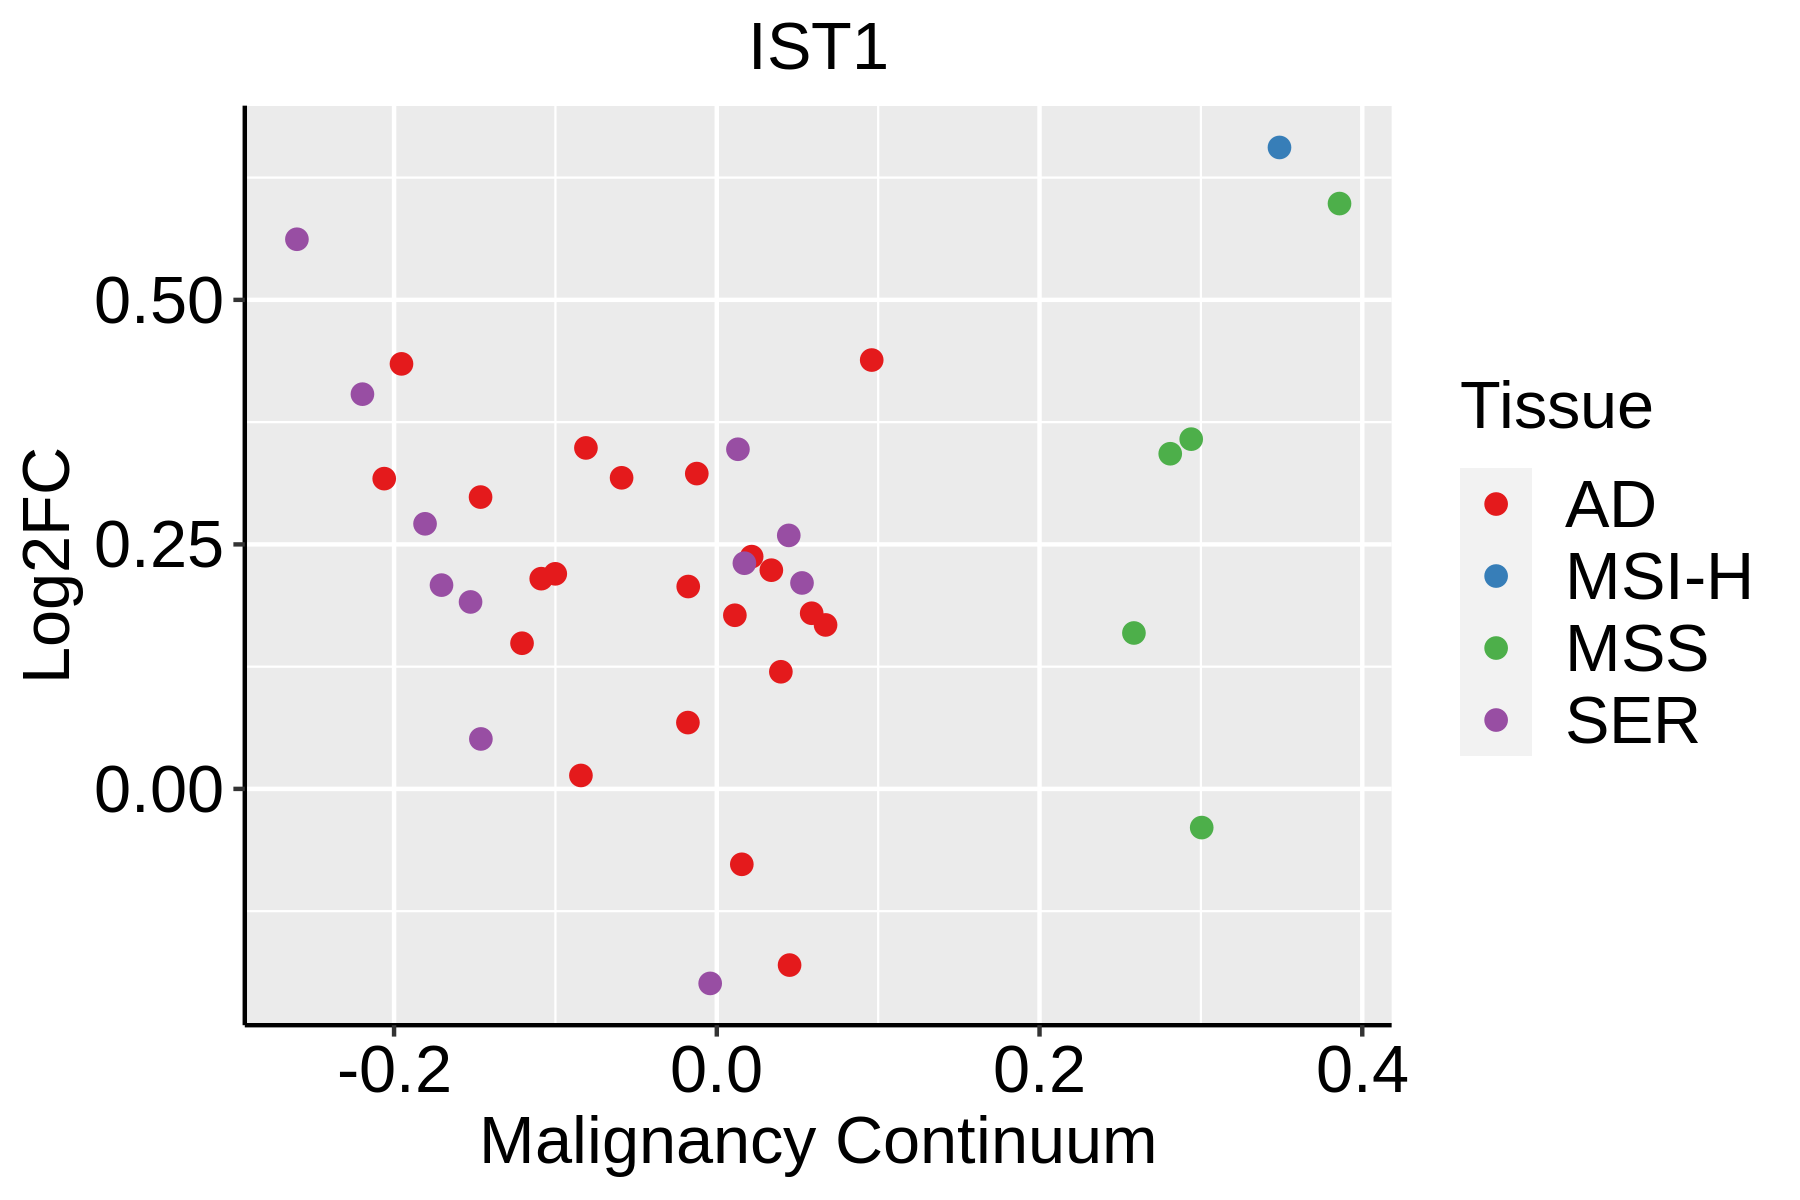 | AD: Adenomas |
| SER: Sessile serrated lesions | ||
| MSI-H: Microsatellite-high colorectal cancer | ||
| MSS: Microsatellite stable colorectal cancer | ||
| Esophagus | 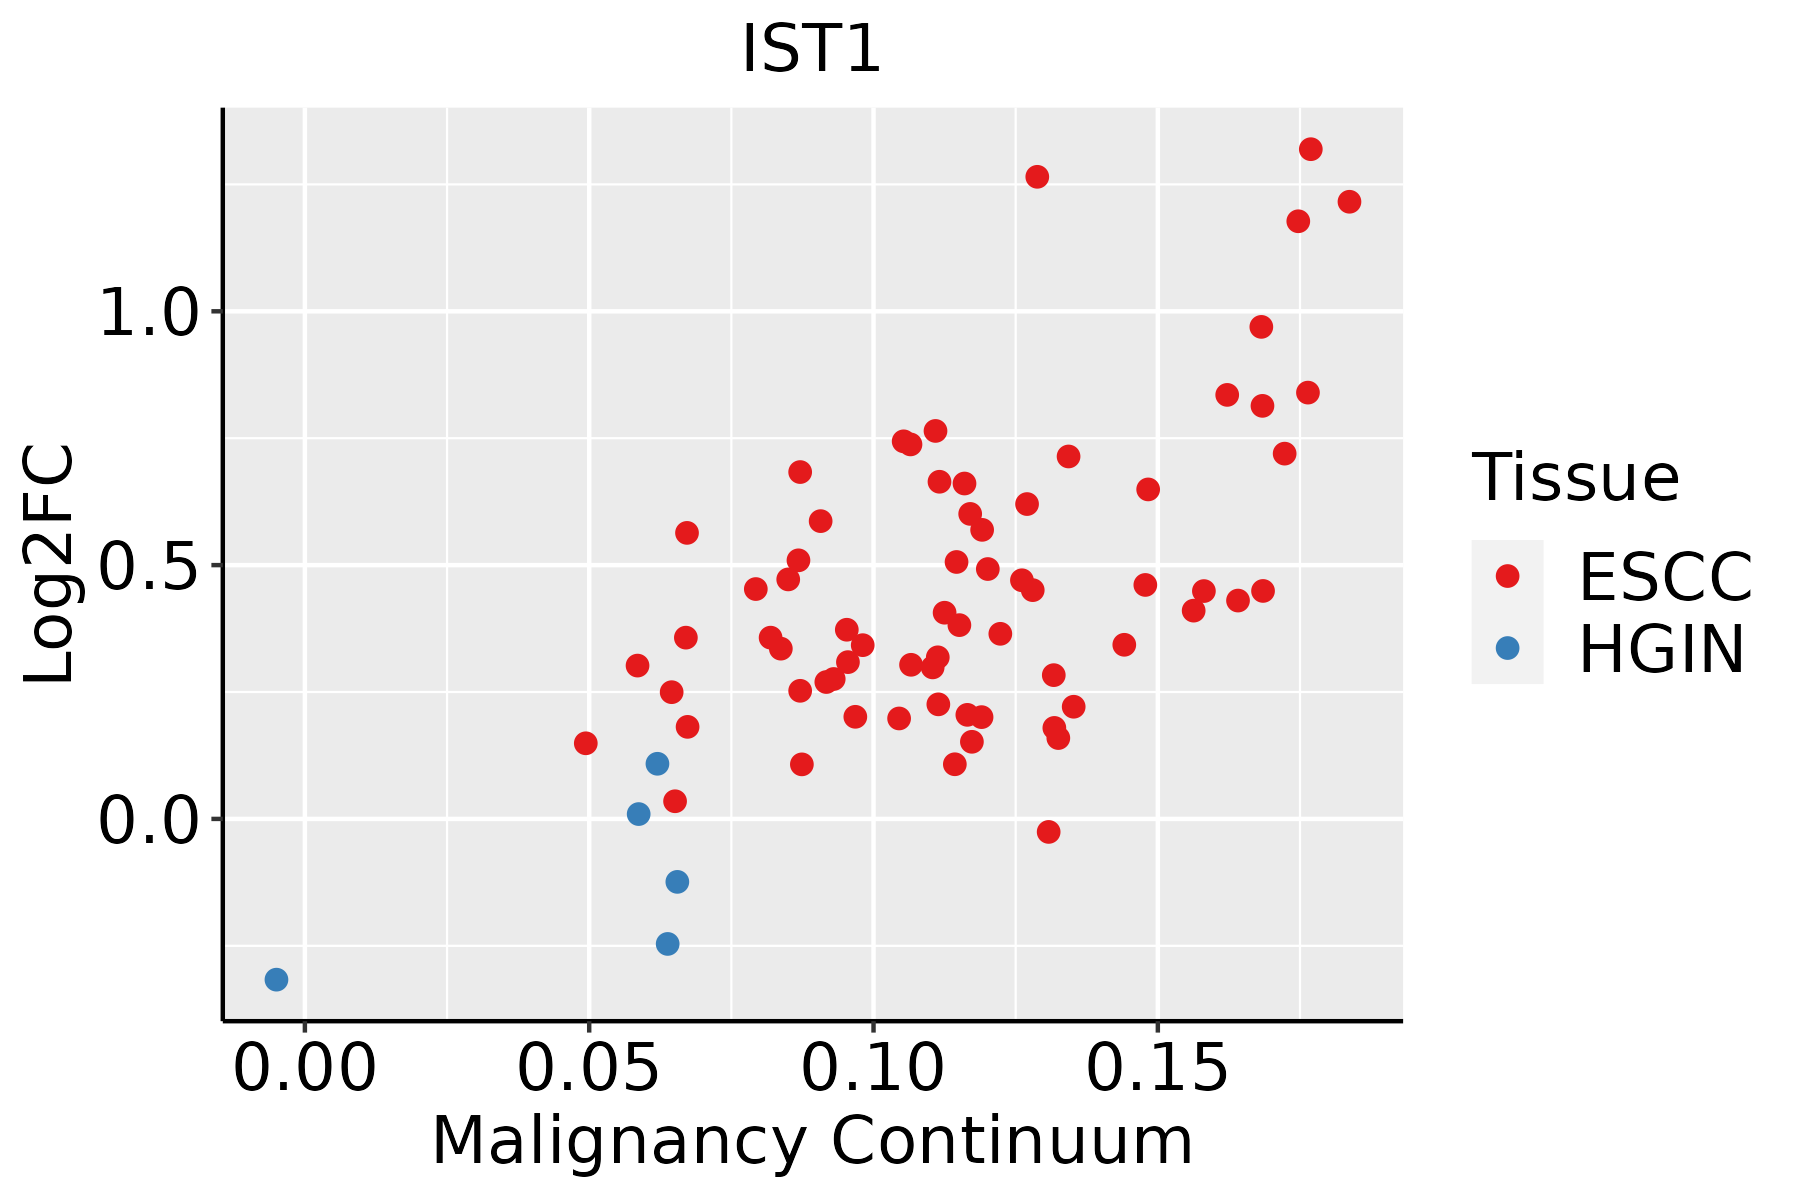 | ESCC: Esophageal squamous cell carcinoma |
| HGIN: High-grade intraepithelial neoplasias | ||
| LGIN: Low-grade intraepithelial neoplasias | ||
| Liver | 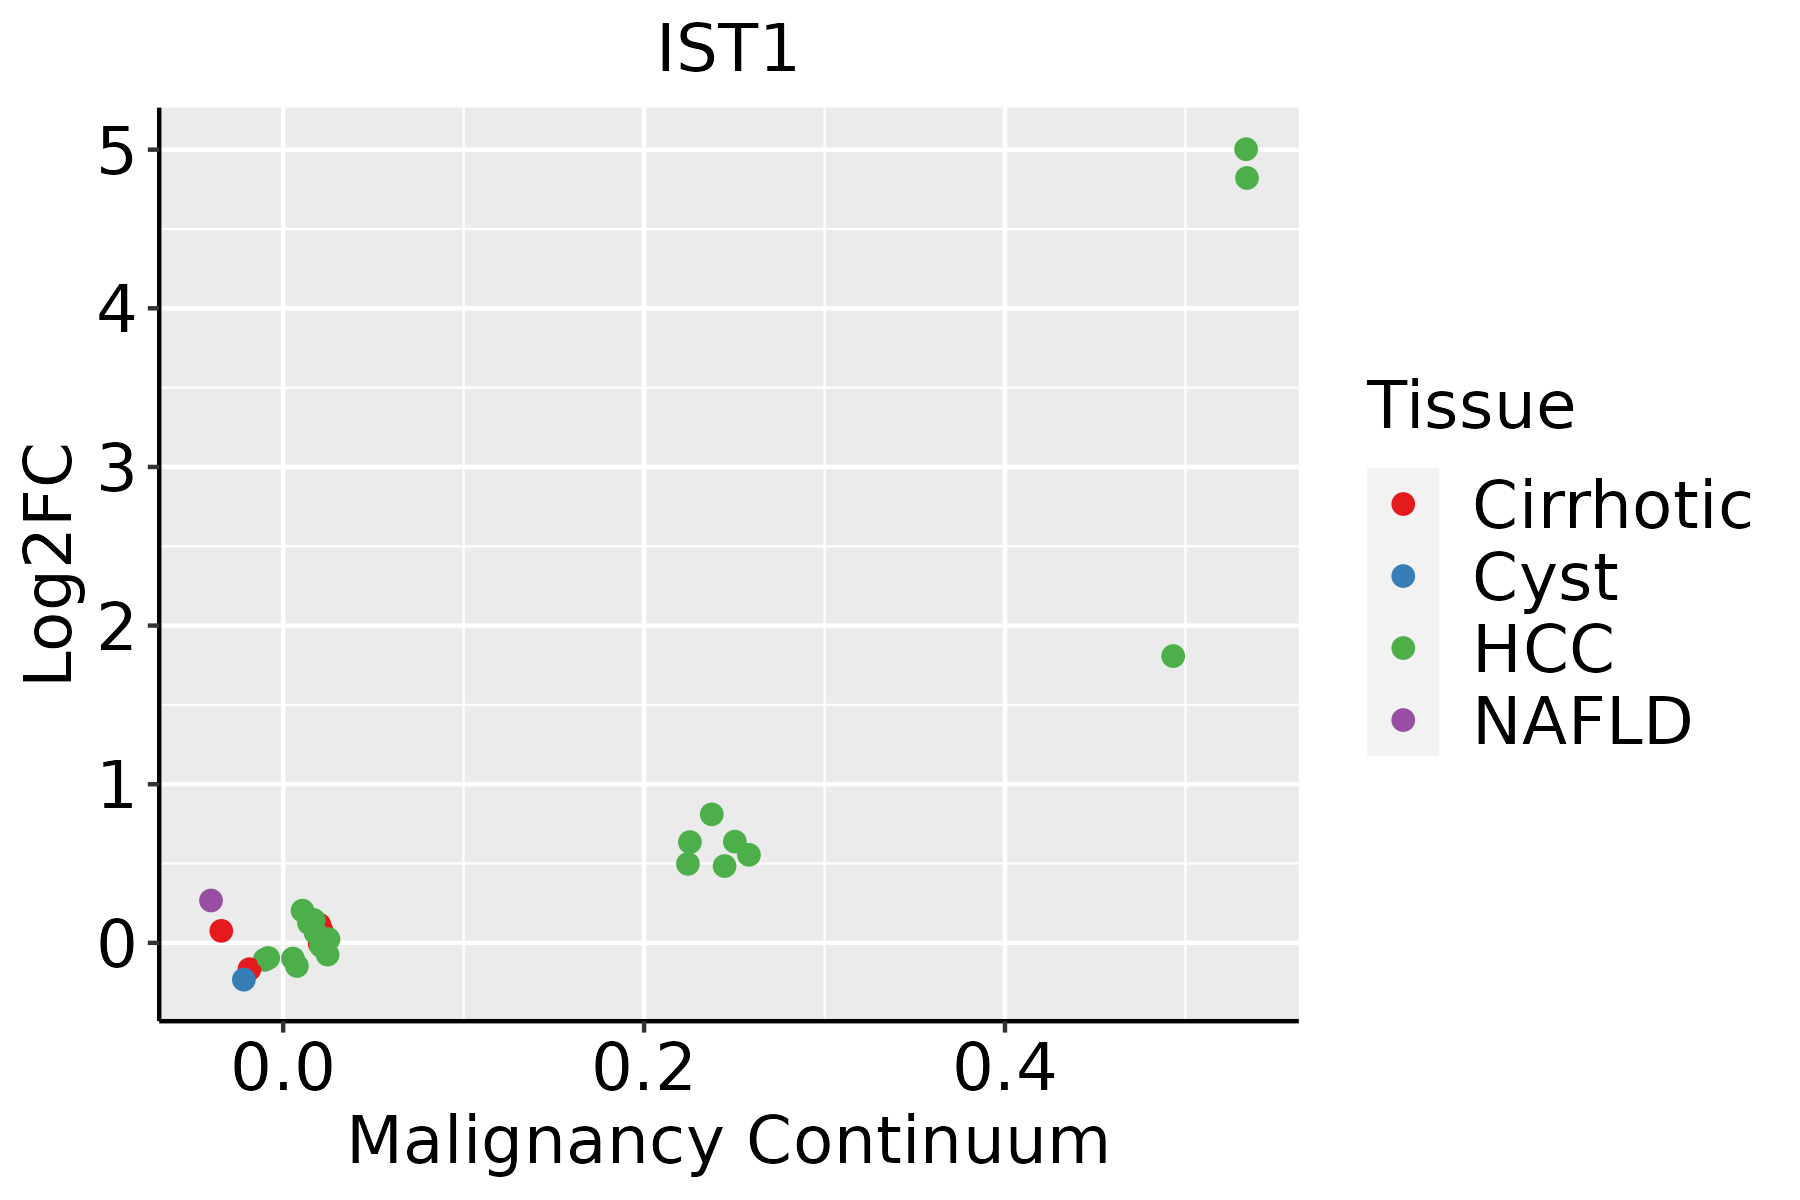 | HCC: Hepatocellular carcinoma |
| NAFLD: Non-alcoholic fatty liver disease | ||
| Oral Cavity |  | EOLP: Erosive Oral lichen planus |
| LP: leukoplakia | ||
| NEOLP: Non-erosive oral lichen planus | ||
| OSCC: Oral squamous cell carcinoma | ||
| Skin | 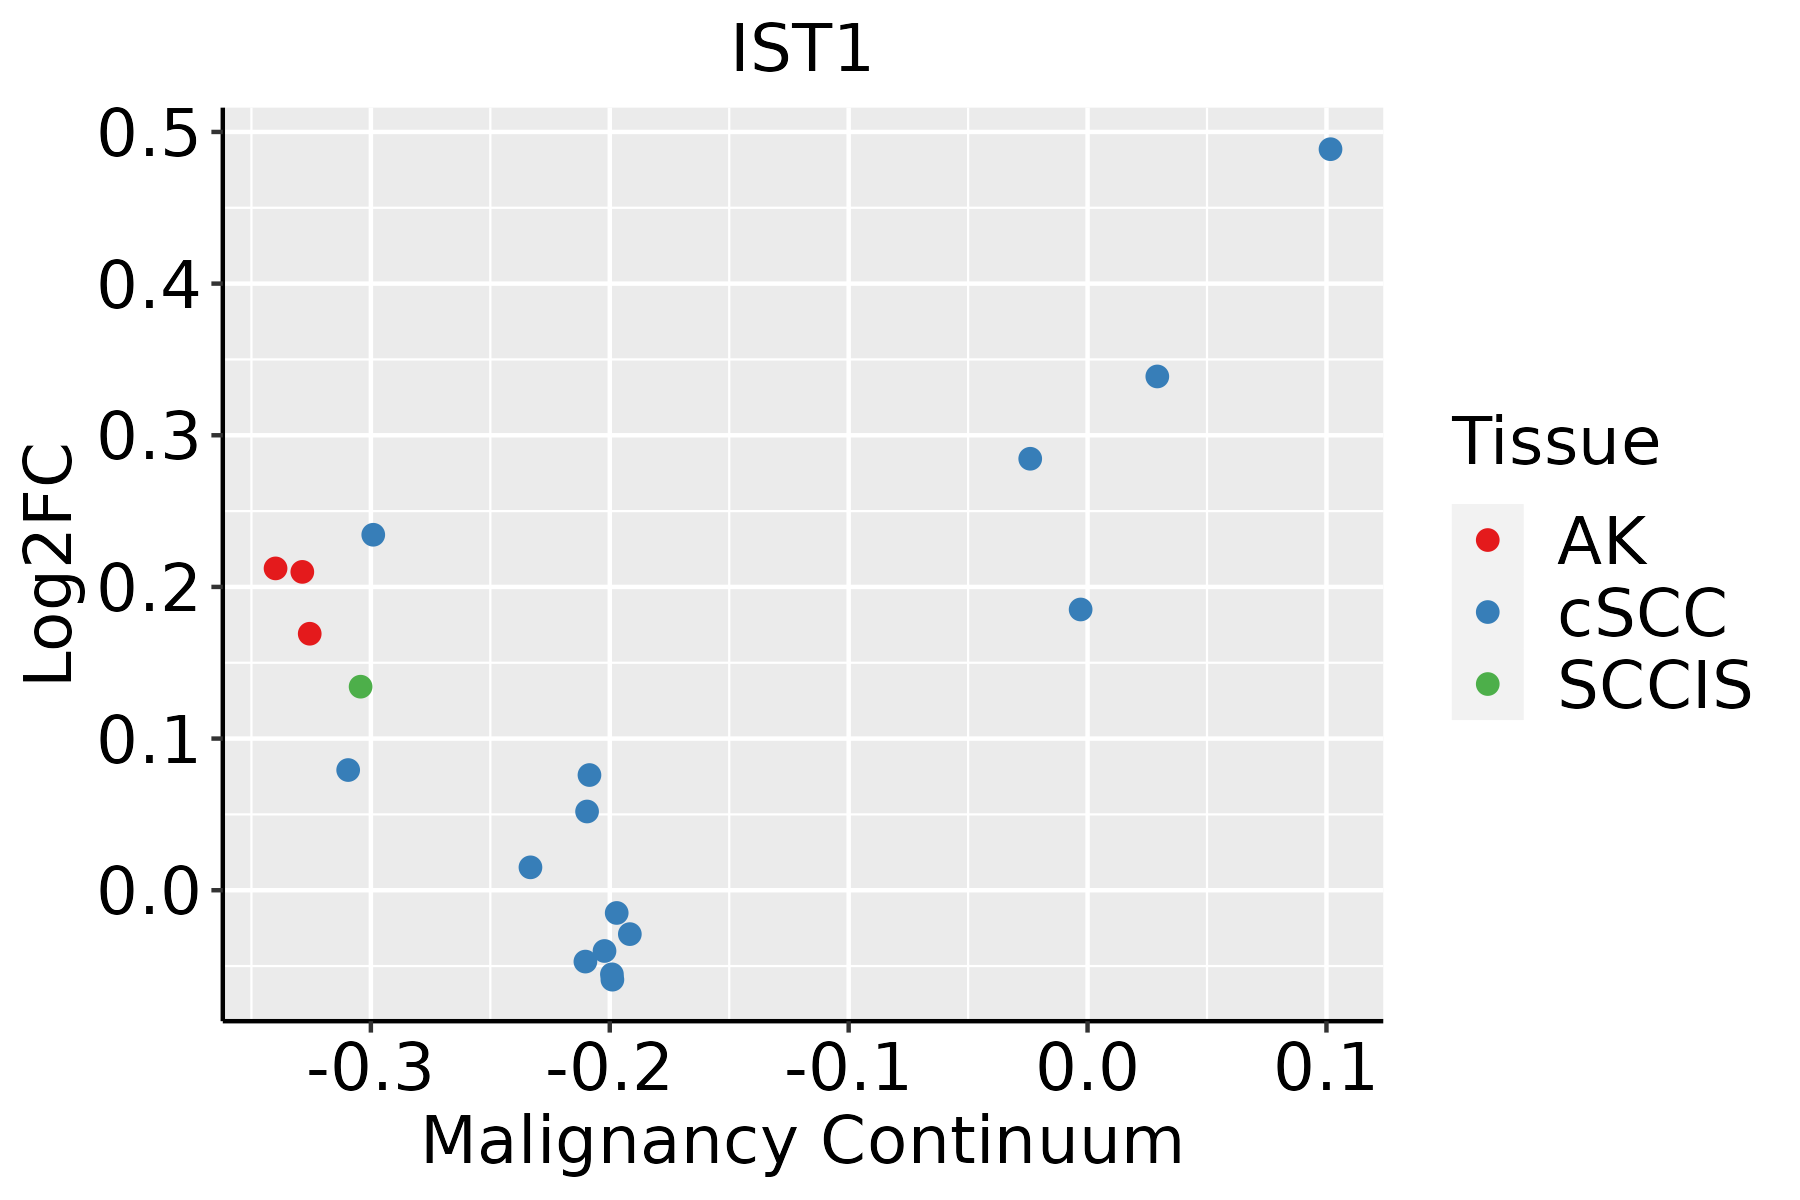 | AK: Actinic keratosis |
| cSCC: Cutaneous squamous cell carcinoma | ||
| SCCIS:squamous cell carcinoma in situ | ||
| Thyroid | 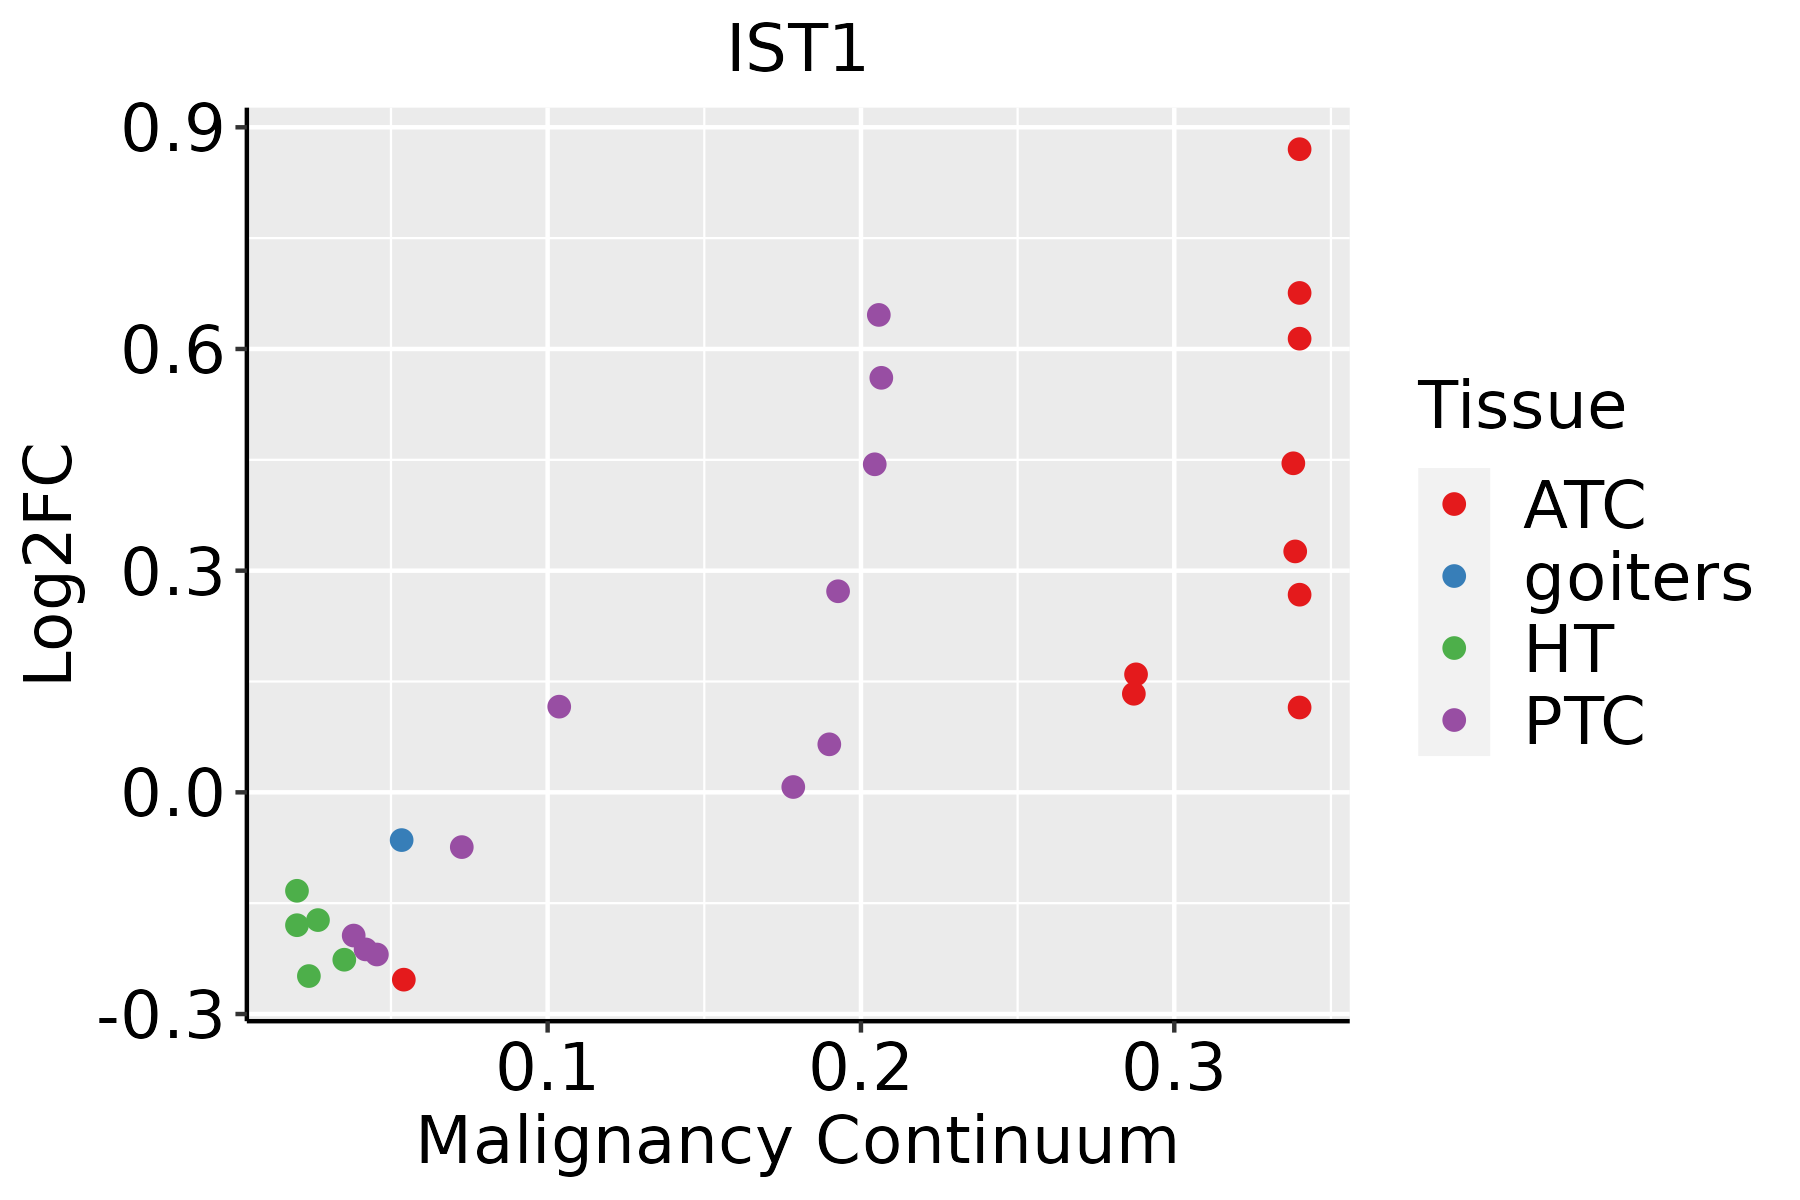 | ATC: Anaplastic thyroid cancer |
| HT: Hashimoto's thyroiditis | ||
| PTC: Papillary thyroid cancer |
| ∗log2FC in expression of this searched gene in stem-like cells from each diseased tissue sample relative to stem-like cells in normal samples in each tissue plotted against the malignancy continuum. Samples are colored based on if they are from different disease stage. |
Top |
Malignant transformation related pathway analysis |
| Find out the enriched GO biological processes and KEGG pathways involved in transition from healthy to precancer to cancer |
| Tissue | Disease Stage | Enriched GO biological Processes |
| Colorectum | AD |  |
| Colorectum | SER |  |
| Colorectum | MSS |  |
| Colorectum | MSI-H |  |
| Colorectum | FAP |  |
| ∗Top 15 enriched GO BP terms are showed in the bar plot of each disease state in each tissue. Each row represents a significant GO biological process which is colored according to the -log10(p.adjust). |
| Page: 1 2 3 4 5 6 7 8 9 |
| GO ID | Tissue | Disease Stage | Description | Gene Ratio | Bg Ratio | pvalue | p.adjust | Count |
| GO:001921614 | Oral cavity | EOLP | regulation of lipid metabolic process | 54/2218 | 331/18723 | 9.09e-03 | 4.15e-02 | 54 |
| GO:0003176 | Oral cavity | EOLP | aortic valve development | 10/2218 | 37/18723 | 9.12e-03 | 4.15e-02 | 10 |
| GO:0016202 | Oral cavity | EOLP | regulation of striated muscle tissue development | 10/2218 | 37/18723 | 9.12e-03 | 4.15e-02 | 10 |
| GO:20007791 | Oral cavity | EOLP | regulation of double-strand break repair | 18/2218 | 85/18723 | 9.81e-03 | 4.43e-02 | 18 |
| GO:005077212 | Oral cavity | EOLP | positive regulation of axonogenesis | 17/2218 | 79/18723 | 1.01e-02 | 4.55e-02 | 17 |
| GO:19013425 | Oral cavity | EOLP | regulation of vasculature development | 56/2218 | 348/18723 | 1.05e-02 | 4.71e-02 | 56 |
| GO:004277022 | Oral cavity | EOLP | signal transduction in response to DNA damage | 31/2218 | 172/18723 | 1.11e-02 | 4.90e-02 | 31 |
| GO:001071711 | Oral cavity | EOLP | regulation of epithelial to mesenchymal transition | 20/2218 | 99/18723 | 1.14e-02 | 4.99e-02 | 20 |
| GO:006156414 | Oral cavity | EOLP | axon development | 72/2218 | 467/18723 | 1.14e-02 | 5.00e-02 | 72 |
| GO:000989633 | Oral cavity | NEOLP | positive regulation of catabolic process | 111/2005 | 492/18723 | 1.19e-14 | 4.72e-12 | 111 |
| GO:003133133 | Oral cavity | NEOLP | positive regulation of cellular catabolic process | 97/2005 | 427/18723 | 3.77e-13 | 1.07e-10 | 97 |
| GO:000166725 | Oral cavity | NEOLP | ameboidal-type cell migration | 96/2005 | 475/18723 | 5.16e-10 | 4.14e-08 | 96 |
| GO:005109833 | Oral cavity | NEOLP | regulation of binding | 77/2005 | 363/18723 | 2.91e-09 | 1.76e-07 | 77 |
| GO:005109933 | Oral cavity | NEOLP | positive regulation of binding | 46/2005 | 173/18723 | 3.51e-09 | 2.04e-07 | 46 |
| GO:004593633 | Oral cavity | NEOLP | negative regulation of phosphate metabolic process | 88/2005 | 441/18723 | 5.20e-09 | 2.87e-07 | 88 |
| GO:003052231 | Oral cavity | NEOLP | intracellular receptor signaling pathway | 61/2005 | 265/18723 | 5.22e-09 | 2.87e-07 | 61 |
| GO:001056333 | Oral cavity | NEOLP | negative regulation of phosphorus metabolic process | 88/2005 | 442/18723 | 5.82e-09 | 3.15e-07 | 88 |
| GO:004232633 | Oral cavity | NEOLP | negative regulation of phosphorylation | 79/2005 | 385/18723 | 8.76e-09 | 4.48e-07 | 79 |
| GO:000170132 | Oral cavity | NEOLP | in utero embryonic development | 76/2005 | 367/18723 | 1.11e-08 | 5.44e-07 | 76 |
| GO:000150331 | Oral cavity | NEOLP | ossification | 81/2005 | 408/18723 | 2.67e-08 | 1.15e-06 | 81 |
| Page: 1 2 3 4 5 6 7 8 9 10 11 12 13 14 15 16 17 18 19 20 21 22 23 24 25 26 27 28 29 30 31 32 33 34 35 36 37 38 39 40 41 42 43 |
| Pathway ID | Tissue | Disease Stage | Description | Gene Ratio | Bg Ratio | pvalue | p.adjust | qvalue | Count |
| hsa04144 | Colorectum | AD | Endocytosis | 111/2092 | 251/8465 | 5.95e-12 | 1.42e-10 | 9.08e-11 | 111 |
| hsa041441 | Colorectum | AD | Endocytosis | 111/2092 | 251/8465 | 5.95e-12 | 1.42e-10 | 9.08e-11 | 111 |
| hsa041444 | Colorectum | MSS | Endocytosis | 102/1875 | 251/8465 | 1.85e-11 | 4.43e-10 | 2.71e-10 | 102 |
| hsa041445 | Colorectum | MSS | Endocytosis | 102/1875 | 251/8465 | 1.85e-11 | 4.43e-10 | 2.71e-10 | 102 |
| hsa041446 | Colorectum | FAP | Endocytosis | 78/1404 | 251/8465 | 6.20e-09 | 2.96e-07 | 1.80e-07 | 78 |
| hsa041447 | Colorectum | FAP | Endocytosis | 78/1404 | 251/8465 | 6.20e-09 | 2.96e-07 | 1.80e-07 | 78 |
| hsa041448 | Colorectum | CRC | Endocytosis | 65/1091 | 251/8465 | 1.27e-08 | 1.06e-06 | 7.19e-07 | 65 |
| hsa041449 | Colorectum | CRC | Endocytosis | 65/1091 | 251/8465 | 1.27e-08 | 1.06e-06 | 7.19e-07 | 65 |
| hsa0414429 | Esophagus | HGIN | Endocytosis | 76/1383 | 251/8465 | 1.74e-08 | 3.34e-07 | 2.65e-07 | 76 |
| hsa04144113 | Esophagus | HGIN | Endocytosis | 76/1383 | 251/8465 | 1.74e-08 | 3.34e-07 | 2.65e-07 | 76 |
| hsa04144210 | Esophagus | ESCC | Endocytosis | 186/4205 | 251/8465 | 9.74e-16 | 4.66e-14 | 2.39e-14 | 186 |
| hsa0414437 | Esophagus | ESCC | Endocytosis | 186/4205 | 251/8465 | 9.74e-16 | 4.66e-14 | 2.39e-14 | 186 |
| hsa0414412 | Liver | Cirrhotic | Endocytosis | 119/2530 | 251/8465 | 2.33e-09 | 4.56e-08 | 2.81e-08 | 119 |
| hsa0414413 | Liver | Cirrhotic | Endocytosis | 119/2530 | 251/8465 | 2.33e-09 | 4.56e-08 | 2.81e-08 | 119 |
| hsa0414422 | Liver | HCC | Endocytosis | 178/4020 | 251/8465 | 2.03e-14 | 5.22e-13 | 2.91e-13 | 178 |
| hsa0414432 | Liver | HCC | Endocytosis | 178/4020 | 251/8465 | 2.03e-14 | 5.22e-13 | 2.91e-13 | 178 |
| hsa0414427 | Oral cavity | OSCC | Endocytosis | 174/3704 | 251/8465 | 9.42e-17 | 4.51e-15 | 2.29e-15 | 174 |
| hsa04144112 | Oral cavity | OSCC | Endocytosis | 174/3704 | 251/8465 | 9.42e-17 | 4.51e-15 | 2.29e-15 | 174 |
| hsa0414428 | Oral cavity | LP | Endocytosis | 121/2418 | 251/8465 | 1.89e-11 | 3.70e-10 | 2.38e-10 | 121 |
| hsa0414436 | Oral cavity | LP | Endocytosis | 121/2418 | 251/8465 | 1.89e-11 | 3.70e-10 | 2.38e-10 | 121 |
| Page: 1 2 |
Top |
Cell-cell communication analysis |
| Identification of potential cell-cell interactions between two cell types and their ligand-receptor pairs for different disease states |
| Ligand | Receptor | LRpair | Pathway | Tissue | Disease Stage |
| Page: 1 |
Top |
Single-cell gene regulatory network inference analysis |
| Find out the significant the regulons (TFs) and the target genes of each regulon across cell types for different disease states |
| TF | Cell Type | Tissue | Disease Stage | Target Gene | RSS | Regulon Activity |
| ∗The dot plots of a searched regulon are shown for all cell subpopulations in each disease state of each tissue based on the regulon specific score inferred using pySCENIC and by calculating the average expression. |
| Page: 1 |
Top |
Somatic mutation of malignant transformation related genes |
| Annotation of somatic variants for genes involved in malignant transformation |
| Hugo Symbol | Variant Class | Variant Classification | dbSNP RS | HGVSc | HGVSp | HGVSp Short | SWISSPROT | BIOTYPE | SIFT | PolyPhen | Tumor Sample Barcode | Tissue | Histology | Sex | Age | Stage | Therapy Types | Drugs | Outcome |
| IST1 | SNV | Missense_Mutation | c.1018G>A | p.Glu340Lys | p.E340K | P53990 | protein_coding | tolerated(0.14) | benign(0.024) | TCGA-A8-A0A1-01 | Breast | breast invasive carcinoma | Female | >=65 | I/II | Hormone Therapy | tamoxiphen | SD | |
| IST1 | SNV | Missense_Mutation | c.943N>G | p.Pro315Ala | p.P315A | P53990 | protein_coding | tolerated(0.06) | benign(0.294) | TCGA-AO-A0J4-01 | Breast | breast invasive carcinoma | Female | <65 | I/II | Chemotherapy | doxorubicin | SD | |
| IST1 | SNV | Missense_Mutation | c.587T>A | p.Val196Asp | p.V196D | P53990 | protein_coding | deleterious(0) | probably_damaging(0.936) | TCGA-AD-6895-01 | Colorectum | colon adenocarcinoma | Male | >=65 | III/IV | Unknown | Unknown | SD | |
| IST1 | SNV | Missense_Mutation | novel | c.753N>A | p.Met251Ile | p.M251I | P53990 | protein_coding | tolerated(0.43) | benign(0) | TCGA-AD-6964-01 | Colorectum | colon adenocarcinoma | Male | <65 | III/IV | Chemotherapy | folfox | PD |
| IST1 | SNV | Missense_Mutation | c.365N>T | p.Arg122Leu | p.R122L | P53990 | protein_coding | tolerated(0.07) | probably_damaging(0.999) | TCGA-CA-5256-01 | Colorectum | colon adenocarcinoma | Female | <65 | I/II | Chemotherapy | oxaliplatin | CR | |
| IST1 | SNV | Missense_Mutation | c.976N>T | p.Pro326Ser | p.P326S | P53990 | protein_coding | tolerated(0.11) | benign(0) | TCGA-DY-A1DC-01 | Colorectum | rectum adenocarcinoma | Female | >=65 | I/II | Chemotherapy | capecitabine | PR | |
| IST1 | SNV | Missense_Mutation | c.974N>G | p.Leu325Arg | p.L325R | P53990 | protein_coding | tolerated(0.48) | benign(0.006) | TCGA-AP-A056-01 | Endometrium | uterine corpus endometrioid carcinoma | Female | <65 | I/II | Unknown | Unknown | SD | |
| IST1 | SNV | Missense_Mutation | c.191N>A | p.Arg64Gln | p.R64Q | P53990 | protein_coding | deleterious(0) | probably_damaging(0.998) | TCGA-AP-A0LM-01 | Endometrium | uterine corpus endometrioid carcinoma | Female | <65 | III/IV | Chemotherapy | cisplatin | SD | |
| IST1 | SNV | Missense_Mutation | c.82T>G | p.Leu28Val | p.L28V | P53990 | protein_coding | deleterious(0) | probably_damaging(0.993) | TCGA-AX-A0J0-01 | Endometrium | uterine corpus endometrioid carcinoma | Female | <65 | I/II | Unknown | Unknown | SD | |
| IST1 | SNV | Missense_Mutation | novel | c.1083N>C | p.Glu361Asp | p.E361D | P53990 | protein_coding | tolerated(0.94) | benign(0.007) | TCGA-DD-AACJ-01 | Liver | liver hepatocellular carcinoma | Male | >=65 | I/II | Unknown | Unknown | PD |
| Page: 1 2 |
Top |
Related drugs of malignant transformation related genes |
| Identification of chemicals and drugs interact with genes involved in malignant transfromation |
| (DGIdb 4.0) |
| Entrez ID | Symbol | Category | Interaction Types | Drug Claim Name | Drug Name | PMIDs |
| Page: 1 |

Copyright 2023-Present -The University of Texas Health Science Center at Houston |