
|
|||||
|
 | |
| |
| |
| |
| |
| |
|
Gene: HMOX1 |
Gene summary for HMOX1 |
| Gene information | Species | Human | Gene symbol | HMOX1 | Gene ID | 3162 |
| Gene name | heme oxygenase 1 | |
| Gene Alias | HMOX1D | |
| Cytomap | 22q12.3 | |
| Gene Type | protein-coding | GO ID | GO:0000302 | UniProtAcc | P09601 |
Top |
Malignant transformation analysis |
| Identification of the aberrant gene expression in precancerous and cancerous lesions by comparing the gene expression of stem-like cells in diseased tissues with normal stem cells |
| Entrez ID | Symbol | Replicates | Species | Organ | Tissue | Adj P-value | Log2FC | Malignancy |
| 3162 | HMOX1 | GSM4909281 | Human | Breast | IDC | 1.65e-07 | -5.09e-01 | 0.21 |
| 3162 | HMOX1 | GSM4909282 | Human | Breast | IDC | 1.27e-19 | -6.08e-01 | -0.0288 |
| 3162 | HMOX1 | GSM4909285 | Human | Breast | IDC | 5.06e-18 | -6.13e-01 | 0.21 |
| 3162 | HMOX1 | GSM4909286 | Human | Breast | IDC | 1.06e-23 | -6.32e-01 | 0.1081 |
| 3162 | HMOX1 | GSM4909287 | Human | Breast | IDC | 5.61e-13 | -5.50e-01 | 0.2057 |
| 3162 | HMOX1 | GSM4909288 | Human | Breast | IDC | 3.19e-04 | -5.98e-01 | 0.0988 |
| 3162 | HMOX1 | GSM4909289 | Human | Breast | IDC | 7.58e-05 | -6.37e-01 | 0.1064 |
| 3162 | HMOX1 | GSM4909290 | Human | Breast | IDC | 1.42e-10 | -5.72e-01 | 0.2096 |
| 3162 | HMOX1 | GSM4909291 | Human | Breast | IDC | 1.05e-10 | -6.04e-01 | 0.1753 |
| 3162 | HMOX1 | GSM4909293 | Human | Breast | IDC | 4.11e-21 | -6.25e-01 | 0.1581 |
| 3162 | HMOX1 | GSM4909294 | Human | Breast | IDC | 4.47e-24 | -6.33e-01 | 0.2022 |
| 3162 | HMOX1 | GSM4909295 | Human | Breast | IDC | 2.56e-07 | -5.63e-01 | 0.0898 |
| 3162 | HMOX1 | GSM4909296 | Human | Breast | IDC | 9.21e-21 | -6.19e-01 | 0.1524 |
| 3162 | HMOX1 | GSM4909297 | Human | Breast | IDC | 3.27e-25 | -6.28e-01 | 0.1517 |
| 3162 | HMOX1 | GSM4909298 | Human | Breast | IDC | 3.38e-17 | -6.16e-01 | 0.1551 |
| 3162 | HMOX1 | GSM4909299 | Human | Breast | IDC | 1.10e-21 | -6.28e-01 | 0.035 |
| 3162 | HMOX1 | GSM4909300 | Human | Breast | IDC | 4.42e-11 | -6.37e-01 | 0.0334 |
| 3162 | HMOX1 | GSM4909301 | Human | Breast | IDC | 8.69e-18 | -6.18e-01 | 0.1577 |
| 3162 | HMOX1 | GSM4909302 | Human | Breast | IDC | 5.62e-22 | -6.27e-01 | 0.1545 |
| 3162 | HMOX1 | GSM4909303 | Human | Breast | IDC | 1.46e-07 | -6.37e-01 | 0.0438 |
| Page: 1 2 3 4 |
| Tissue | Expression Dynamics | Abbreviation |
| Breast |  | IDC: Invasive ductal carcinoma |
| DCIS: Ductal carcinoma in situ | ||
| Precancer(BRCA1-mut): Precancerous lesion from BRCA1 mutation carriers | ||
| Colorectum (GSE201348) |  | FAP: Familial adenomatous polyposis |
| CRC: Colorectal cancer | ||
| Colorectum (HTA11) |  | AD: Adenomas |
| SER: Sessile serrated lesions | ||
| MSI-H: Microsatellite-high colorectal cancer | ||
| MSS: Microsatellite stable colorectal cancer | ||
| Esophagus | 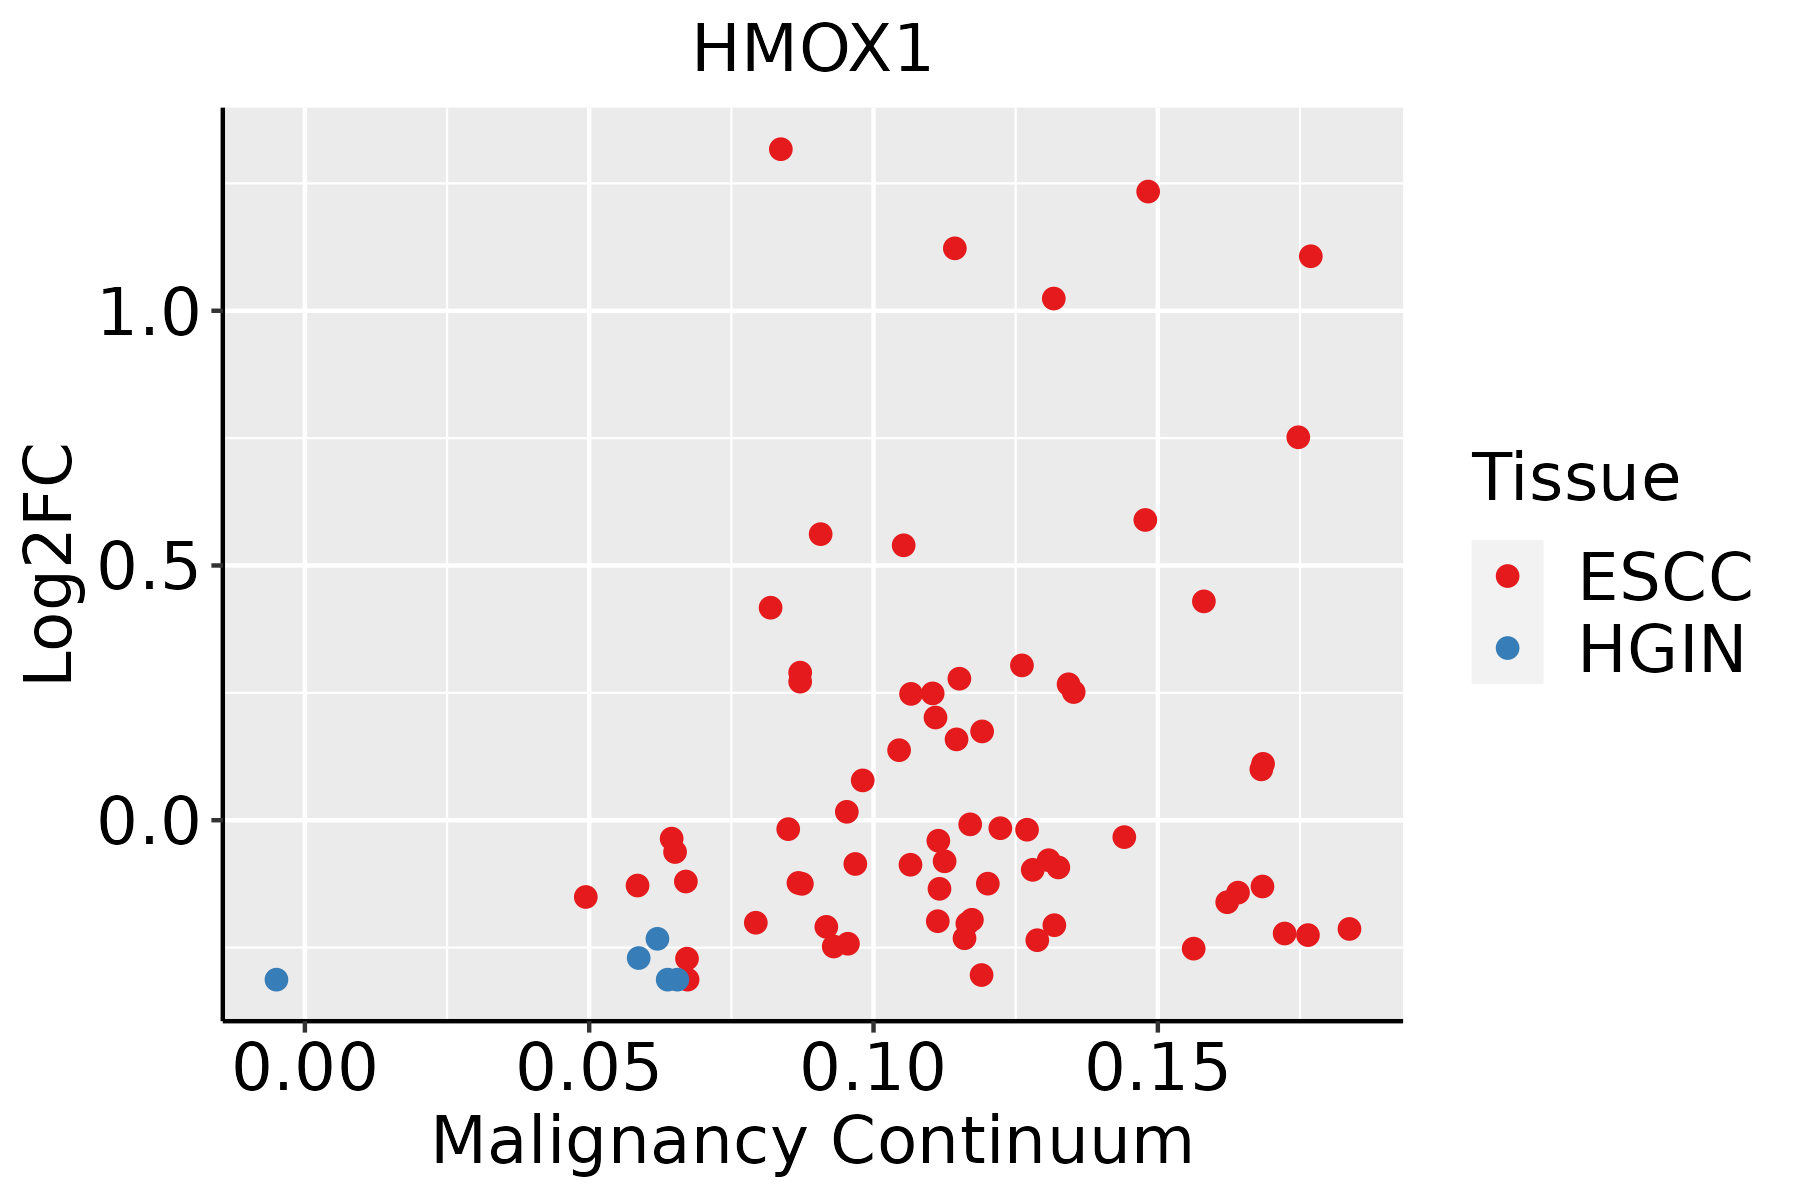 | ESCC: Esophageal squamous cell carcinoma |
| HGIN: High-grade intraepithelial neoplasias | ||
| LGIN: Low-grade intraepithelial neoplasias | ||
| Liver | 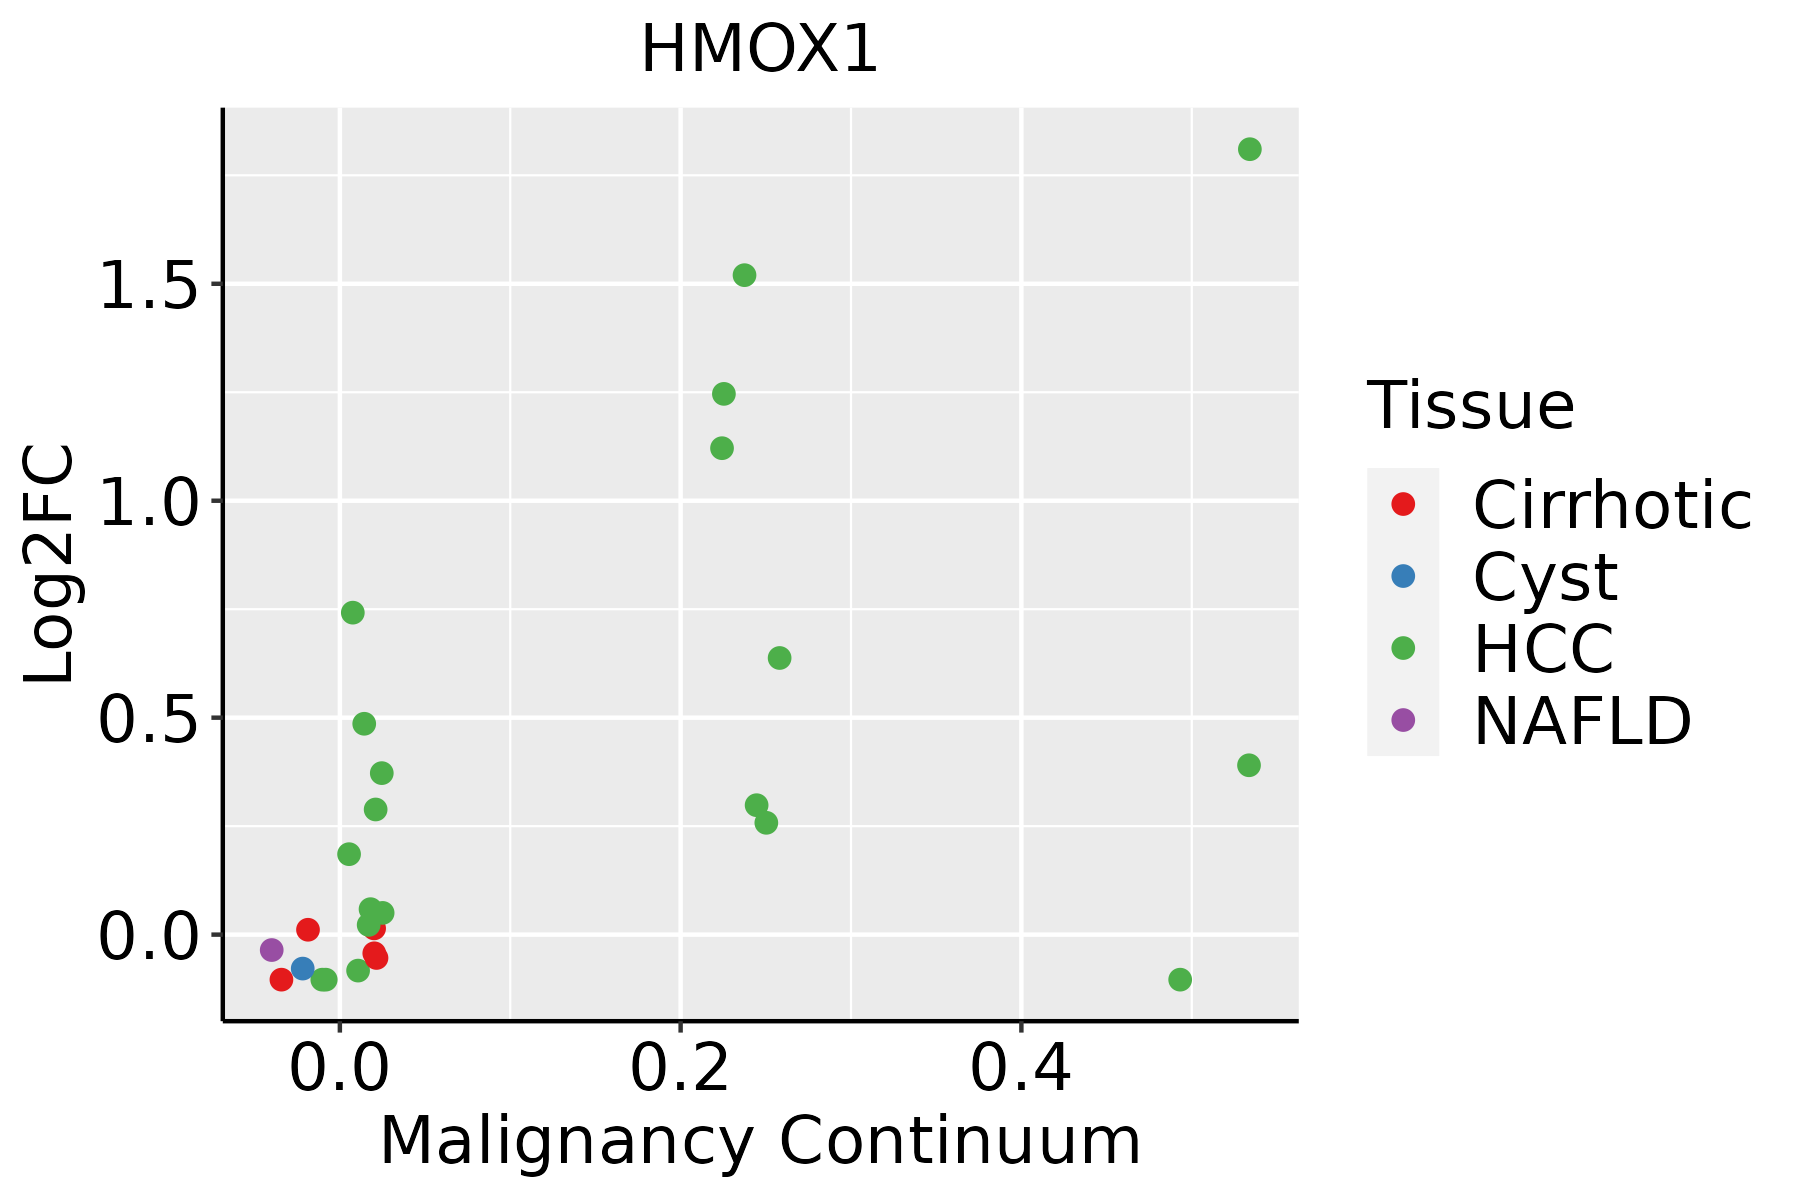 | HCC: Hepatocellular carcinoma |
| NAFLD: Non-alcoholic fatty liver disease |
| ∗log2FC in expression of this searched gene in stem-like cells from each diseased tissue sample relative to stem-like cells in normal samples in each tissue plotted against the malignancy continuum. Samples are colored based on if they are from different disease stage. |
Top |
Malignant transformation related pathway analysis |
| Find out the enriched GO biological processes and KEGG pathways involved in transition from healthy to precancer to cancer |
| Tissue | Disease Stage | Enriched GO biological Processes |
| Colorectum | AD |  |
| Colorectum | SER |  |
| Colorectum | MSS |  |
| Colorectum | MSI-H |  |
| Colorectum | FAP |  |
| ∗Top 15 enriched GO BP terms are showed in the bar plot of each disease state in each tissue. Each row represents a significant GO biological process which is colored according to the -log10(p.adjust). |
| Page: 1 2 3 4 5 6 7 8 9 |
| GO ID | Tissue | Disease Stage | Description | Gene Ratio | Bg Ratio | pvalue | p.adjust | Count |
| GO:000268316 | Esophagus | ESCC | negative regulation of immune system process | 231/8552 | 434/18723 | 8.48e-04 | 4.36e-03 | 231 |
| GO:000166720 | Esophagus | ESCC | ameboidal-type cell migration | 250/8552 | 475/18723 | 1.22e-03 | 5.97e-03 | 250 |
| GO:00162394 | Esophagus | ESCC | positive regulation of macroautophagy | 41/8552 | 63/18723 | 1.48e-03 | 6.99e-03 | 41 |
| GO:009742110 | Esophagus | ESCC | liver regeneration | 25/8552 | 35/18723 | 1.82e-03 | 8.35e-03 | 25 |
| GO:007124117 | Esophagus | ESCC | cellular response to inorganic substance | 125/8552 | 226/18723 | 2.17e-03 | 9.67e-03 | 125 |
| GO:000181916 | Esophagus | ESCC | positive regulation of cytokine production | 244/8552 | 467/18723 | 2.29e-03 | 1.01e-02 | 244 |
| GO:00550729 | Esophagus | ESCC | iron ion homeostasis | 52/8552 | 85/18723 | 2.86e-03 | 1.21e-02 | 52 |
| GO:00486597 | Esophagus | ESCC | smooth muscle cell proliferation | 103/8552 | 184/18723 | 3.08e-03 | 1.28e-02 | 103 |
| GO:190121516 | Esophagus | ESCC | negative regulation of neuron death | 115/8552 | 208/18723 | 3.24e-03 | 1.34e-02 | 115 |
| GO:00316701 | Esophagus | ESCC | cellular response to nutrient | 30/8552 | 45/18723 | 3.63e-03 | 1.48e-02 | 30 |
| GO:00434332 | Esophagus | ESCC | negative regulation of DNA-binding transcription factor activity | 103/8552 | 185/18723 | 3.86e-03 | 1.57e-02 | 103 |
| GO:007127615 | Esophagus | ESCC | cellular response to cadmium ion | 27/8552 | 40/18723 | 4.39e-03 | 1.73e-02 | 27 |
| GO:00486607 | Esophagus | ESCC | regulation of smooth muscle cell proliferation | 100/8552 | 180/18723 | 4.76e-03 | 1.85e-02 | 100 |
| GO:00330025 | Esophagus | ESCC | muscle cell proliferation | 134/8552 | 248/18723 | 4.80e-03 | 1.86e-02 | 134 |
| GO:00486615 | Esophagus | ESCC | positive regulation of smooth muscle cell proliferation | 61/8552 | 104/18723 | 5.22e-03 | 1.97e-02 | 61 |
| GO:001063120 | Esophagus | ESCC | epithelial cell migration | 187/8552 | 357/18723 | 6.05e-03 | 2.23e-02 | 187 |
| GO:00330132 | Esophagus | ESCC | tetrapyrrole metabolic process | 37/8552 | 59/18723 | 6.23e-03 | 2.29e-02 | 37 |
| GO:009013220 | Esophagus | ESCC | epithelium migration | 188/8552 | 360/18723 | 6.96e-03 | 2.54e-02 | 188 |
| GO:000268515 | Esophagus | ESCC | regulation of leukocyte migration | 114/8552 | 210/18723 | 7.26e-03 | 2.63e-02 | 114 |
| GO:00424401 | Esophagus | ESCC | pigment metabolic process | 50/8552 | 84/18723 | 7.34e-03 | 2.64e-02 | 50 |
| Page: 1 2 3 4 5 6 7 8 9 10 11 12 13 14 15 16 17 18 19 20 21 22 23 24 25 26 27 28 29 30 31 32 |
| Pathway ID | Tissue | Disease Stage | Description | Gene Ratio | Bg Ratio | pvalue | p.adjust | qvalue | Count |
| hsa0520818 | Breast | Precancer | Chemical carcinogenesis - reactive oxygen species | 68/684 | 223/8465 | 3.61e-23 | 1.14e-21 | 8.73e-22 | 68 |
| hsa0541818 | Breast | Precancer | Fluid shear stress and atherosclerosis | 28/684 | 139/8465 | 4.74e-06 | 6.00e-05 | 4.59e-05 | 28 |
| hsa0406616 | Breast | Precancer | HIF-1 signaling pathway | 23/684 | 109/8465 | 1.51e-05 | 1.59e-04 | 1.22e-04 | 23 |
| hsa0421610 | Breast | Precancer | Ferroptosis | 11/684 | 41/8465 | 2.95e-04 | 2.45e-03 | 1.88e-03 | 11 |
| hsa0520819 | Breast | Precancer | Chemical carcinogenesis - reactive oxygen species | 68/684 | 223/8465 | 3.61e-23 | 1.14e-21 | 8.73e-22 | 68 |
| hsa0541819 | Breast | Precancer | Fluid shear stress and atherosclerosis | 28/684 | 139/8465 | 4.74e-06 | 6.00e-05 | 4.59e-05 | 28 |
| hsa0406617 | Breast | Precancer | HIF-1 signaling pathway | 23/684 | 109/8465 | 1.51e-05 | 1.59e-04 | 1.22e-04 | 23 |
| hsa0421613 | Breast | Precancer | Ferroptosis | 11/684 | 41/8465 | 2.95e-04 | 2.45e-03 | 1.88e-03 | 11 |
| hsa0520824 | Breast | IDC | Chemical carcinogenesis - reactive oxygen species | 71/867 | 223/8465 | 2.55e-19 | 7.53e-18 | 5.63e-18 | 71 |
| hsa0541824 | Breast | IDC | Fluid shear stress and atherosclerosis | 34/867 | 139/8465 | 9.41e-07 | 1.61e-05 | 1.20e-05 | 34 |
| hsa0421623 | Breast | IDC | Ferroptosis | 12/867 | 41/8465 | 5.87e-04 | 4.89e-03 | 3.66e-03 | 12 |
| hsa0406623 | Breast | IDC | HIF-1 signaling pathway | 22/867 | 109/8465 | 1.36e-03 | 1.00e-02 | 7.50e-03 | 22 |
| hsa0497812 | Breast | IDC | Mineral absorption | 13/867 | 60/8465 | 6.73e-03 | 3.42e-02 | 2.56e-02 | 13 |
| hsa0520834 | Breast | IDC | Chemical carcinogenesis - reactive oxygen species | 71/867 | 223/8465 | 2.55e-19 | 7.53e-18 | 5.63e-18 | 71 |
| hsa0541834 | Breast | IDC | Fluid shear stress and atherosclerosis | 34/867 | 139/8465 | 9.41e-07 | 1.61e-05 | 1.20e-05 | 34 |
| hsa0421633 | Breast | IDC | Ferroptosis | 12/867 | 41/8465 | 5.87e-04 | 4.89e-03 | 3.66e-03 | 12 |
| hsa0406633 | Breast | IDC | HIF-1 signaling pathway | 22/867 | 109/8465 | 1.36e-03 | 1.00e-02 | 7.50e-03 | 22 |
| hsa0497813 | Breast | IDC | Mineral absorption | 13/867 | 60/8465 | 6.73e-03 | 3.42e-02 | 2.56e-02 | 13 |
| hsa0520843 | Breast | DCIS | Chemical carcinogenesis - reactive oxygen species | 70/846 | 223/8465 | 2.82e-19 | 8.29e-18 | 6.10e-18 | 70 |
| hsa0541844 | Breast | DCIS | Fluid shear stress and atherosclerosis | 34/846 | 139/8465 | 5.31e-07 | 9.03e-06 | 6.65e-06 | 34 |
| Page: 1 2 3 4 |
Top |
Cell-cell communication analysis |
| Identification of potential cell-cell interactions between two cell types and their ligand-receptor pairs for different disease states |
| Ligand | Receptor | LRpair | Pathway | Tissue | Disease Stage |
| Page: 1 |
Top |
Single-cell gene regulatory network inference analysis |
| Find out the significant the regulons (TFs) and the target genes of each regulon across cell types for different disease states |
| TF | Cell Type | Tissue | Disease Stage | Target Gene | RSS | Regulon Activity |
| ∗The dot plots of a searched regulon are shown for all cell subpopulations in each disease state of each tissue based on the regulon specific score inferred using pySCENIC and by calculating the average expression. |
| Page: 1 |
Top |
Somatic mutation of malignant transformation related genes |
| Annotation of somatic variants for genes involved in malignant transformation |
| Hugo Symbol | Variant Class | Variant Classification | dbSNP RS | HGVSc | HGVSp | HGVSp Short | SWISSPROT | BIOTYPE | SIFT | PolyPhen | Tumor Sample Barcode | Tissue | Histology | Sex | Age | Stage | Therapy Types | Drugs | Outcome |
| HMOX1 | SNV | Missense_Mutation | rs367932474 | c.141N>G | p.Phe47Leu | p.F47L | P09601 | protein_coding | deleterious(0.04) | probably_damaging(0.993) | TCGA-5L-AAT1-01 | Breast | breast invasive carcinoma | Female | <65 | III/IV | Hormone Therapy | letrozol | SD |
| HMOX1 | SNV | Missense_Mutation | c.479N>A | p.Ser160Tyr | p.S160Y | P09601 | protein_coding | deleterious(0) | probably_damaging(0.974) | TCGA-A1-A0SH-01 | Breast | breast invasive carcinoma | Female | <65 | I/II | Chemotherapy | tc | SD | |
| HMOX1 | SNV | Missense_Mutation | c.829N>G | p.Leu277Val | p.L277V | P09601 | protein_coding | tolerated(0.24) | benign(0.003) | TCGA-C5-A1BQ-01 | Cervix | cervical & endocervical cancer | Female | >=65 | III/IV | Chemotherapy | cisplatin | CR | |
| HMOX1 | SNV | Missense_Mutation | c.829N>G | p.Leu277Val | p.L277V | P09601 | protein_coding | tolerated(0.24) | benign(0.003) | TCGA-C5-A3HL-01 | Cervix | cervical & endocervical cancer | Female | >=65 | I/II | Unknown | Unknown | SD | |
| HMOX1 | SNV | Missense_Mutation | c.196N>C | p.Glu66Gln | p.E66Q | P09601 | protein_coding | deleterious(0) | probably_damaging(0.947) | TCGA-DR-A0ZM-01 | Cervix | cervical & endocervical cancer | Female | <65 | III/IV | Unspecific | Cisplatin | SD | |
| HMOX1 | SNV | Missense_Mutation | rs768800478 | c.452N>T | p.Ala151Val | p.A151V | P09601 | protein_coding | deleterious(0) | probably_damaging(0.991) | TCGA-AA-3966-01 | Colorectum | colon adenocarcinoma | Female | >=65 | I/II | Unknown | Unknown | SD |
| HMOX1 | SNV | Missense_Mutation | c.186N>T | p.Glu62Asp | p.E62D | P09601 | protein_coding | deleterious(0) | probably_damaging(1) | TCGA-AA-A010-01 | Colorectum | colon adenocarcinoma | Female | <65 | I/II | Chemotherapy | folinic | CR | |
| HMOX1 | SNV | Missense_Mutation | rs766615761 | c.199N>T | p.Arg67Cys | p.R67C | P09601 | protein_coding | deleterious(0.01) | probably_damaging(0.941) | TCGA-AZ-4313-01 | Colorectum | colon adenocarcinoma | Female | <65 | I/II | Unknown | Unknown | SD |
| HMOX1 | SNV | Missense_Mutation | c.767N>G | p.Lys256Arg | p.K256R | P09601 | protein_coding | tolerated(0.2) | benign(0.014) | TCGA-DM-A1DA-01 | Colorectum | colon adenocarcinoma | Female | >=65 | III/IV | Unknown | Unknown | SD | |
| HMOX1 | SNV | Missense_Mutation | novel | c.368N>A | p.Arg123His | p.R123H | P09601 | protein_coding | tolerated(0.07) | benign(0.023) | TCGA-A5-A2K3-01 | Endometrium | uterine corpus endometrioid carcinoma | Female | >=65 | I/II | Chemotherapy | carboplatin | SD |
| Page: 1 2 3 4 |
Top |
Related drugs of malignant transformation related genes |
| Identification of chemicals and drugs interact with genes involved in malignant transfromation |
| (DGIdb 4.0) |
| Entrez ID | Symbol | Category | Interaction Types | Drug Claim Name | Drug Name | PMIDs |
| 3162 | HMOX1 | ENZYME, DRUGGABLE GENOME, DRUG RESISTANCE | ZNCL2 | 9175711 | ||
| 3162 | HMOX1 | ENZYME, DRUGGABLE GENOME, DRUG RESISTANCE | NEUROTROPHIC FACTOR | 16298686 | ||
| 3162 | HMOX1 | ENZYME, DRUGGABLE GENOME, DRUG RESISTANCE | HORMONES | 16214137 | ||
| 3162 | HMOX1 | ENZYME, DRUGGABLE GENOME, DRUG RESISTANCE | SELENIUM | 12751798 | ||
| 3162 | HMOX1 | ENZYME, DRUGGABLE GENOME, DRUG RESISTANCE | Stannsoporfin | STANNSOPORFIN | ||
| 3162 | HMOX1 | ENZYME, DRUGGABLE GENOME, DRUG RESISTANCE | STANNSOPORFIN | STANNSOPORFIN | ||
| 3162 | HMOX1 | ENZYME, DRUGGABLE GENOME, DRUG RESISTANCE | SORAFENIB | SORAFENIB | 26309414 | |
| 3162 | HMOX1 | ENZYME, DRUGGABLE GENOME, DRUG RESISTANCE | SUNITINIB | SUNITINIB | 26309414 | |
| 3162 | HMOX1 | ENZYME, DRUGGABLE GENOME, DRUG RESISTANCE | ASPIRIN | ASPIRIN | 12927812 | |
| 3162 | HMOX1 | ENZYME, DRUGGABLE GENOME, DRUG RESISTANCE | VITAMIN D | 15225803 |
| Page: 1 2 |

Copyright 2023-Present -The University of Texas Health Science Center at Houston |