Schematic overview of the cellular and molecular mechanisms involved in the cancer progression, including the proposed cellular and molecular mechanisms in cancer cells trajectory. AT1: alveolar type 1 cells; AT2: alveolar type 2 cells; AAH: atypical adenomatous hyperplasia; AIS: adenocarcinoma in situ; MIA: minimally invasive adenocarcinoma; IA: invasive adenocarcinoma; EMT: epithelial-mesenchymal transition

Home

Download

Statistics

Help

Contact

Center for Computational Systems Medicine
leaf

Gene summary

leaf

Malignant transformation analysis

leaf

Malignant transformation related pathway analysis

leaf

Cell-cell communication analysis

leaf

Single-cell gene regulatory network inference analysis

leaf

Somatic mutation of malignant transformation related genes

leaf

Related drugs of malignant transformation related genes

Gene: GOLGA4

Gene summary for GOLGA4

check button Gene summary.

Gene informationSpeciesHuman
Gene symbol

GOLGA4

Gene ID

2803

Gene namegolgin A4
Gene AliasCRPF46
Cytomap3p22.2
Gene Typeprotein-coding
GO ID

GO:0000902

UniProtAcc

Q13439


Top

Malignant transformation analysis

check button Identification of the aberrant gene expression in precancerous and cancerous lesions by comparing the gene expression of stem-like cells in diseased tissues with normal stem cells
check button Malignant transformation involving gene list.
Entrez IDSymbolReplicatesSpeciesOrganTissueAdj P-valueLog2FCMalignancy
2803GOLGA4CA_HPV_1HumanCervixCC2.95e-09-2.78e-010.0264
2803GOLGA4N_HPV_1HumanCervixN_HPV4.28e-03-2.64e-010.0079
2803GOLGA4CCI_2HumanCervixCC2.02e-055.84e-010.5249
2803GOLGA4CCI_3HumanCervixCC1.79e-036.17e-010.516
2803GOLGA4CCII_1HumanCervixCC3.07e-03-4.62e-010.3249
2803GOLGA4TumorHumanCervixCC1.10e-11-4.53e-010.1241
2803GOLGA4sample3HumanCervixCC4.35e-12-3.35e-010.1387
2803GOLGA4H2HumanCervixHSIL_HPV1.93e-042.46e-010.0632
2803GOLGA4T3HumanCervixCC3.96e-06-3.62e-010.1389
2803GOLGA4HTA11_3410_2000001011HumanColorectumAD1.64e-43-9.37e-010.0155
2803GOLGA4HTA11_2487_2000001011HumanColorectumSER1.13e-07-5.83e-01-0.1808
2803GOLGA4HTA11_2951_2000001011HumanColorectumAD4.20e-05-9.17e-010.0216
2803GOLGA4HTA11_3361_2000001011HumanColorectumAD4.49e-11-6.91e-01-0.1207
2803GOLGA4HTA11_5212_2000001011HumanColorectumAD1.38e-05-7.55e-01-0.2061
2803GOLGA4HTA11_5216_2000001011HumanColorectumSER4.28e-02-5.48e-01-0.1462
2803GOLGA4HTA11_9341_2000001011HumanColorectumSER1.18e-03-8.68e-01-0.00410000000000005
2803GOLGA4HTA11_7862_2000001011HumanColorectumAD1.25e-11-8.54e-01-0.0179
2803GOLGA4HTA11_866_3004761011HumanColorectumAD3.55e-24-8.24e-010.096
2803GOLGA4HTA11_4255_2000001011HumanColorectumSER2.42e-03-7.21e-010.0446
2803GOLGA4HTA11_9408_2000001011HumanColorectumAD1.23e-04-8.70e-010.0451
Page: 1 2 3 4 5 6 7 8 9 10 11 12 13 14 

check button Transcriptomic changes along malignancy continuum.
TissueExpression DynamicsAbbreviation
CervixThe image shows the transcriptomic changes along malignancy continuum.log2FC in expression of this searched gene in stem-like cells from each diseased tissue sample relative to stem-like cells in normal samples in each tissue plotted against the malignancy continuum. Samples are colored based on if they are from different disease stage.CC: Cervix cancer
HSIL_HPV: HPV-infected high-grade squamous intraepithelial lesions
N_HPV: HPV-infected normal cervix
Colorectum (GSE201348)The image shows the transcriptomic changes along malignancy continuum.log2FC in expression of this searched gene in stem-like cells from each diseased tissue sample relative to stem-like cells in normal samples in each tissue plotted against the malignancy continuum. Samples are colored based on if they are from different disease stage.FAP: Familial adenomatous polyposis
CRC: Colorectal cancer
Colorectum (HTA11)The image shows the transcriptomic changes along malignancy continuum.log2FC in expression of this searched gene in stem-like cells from each diseased tissue sample relative to stem-like cells in normal samples in each tissue plotted against the malignancy continuum. Samples are colored based on if they are from different disease stage.AD: Adenomas
SER: Sessile serrated lesions
MSI-H: Microsatellite-high colorectal cancer
MSS: Microsatellite stable colorectal cancer
EsophagusThe image shows the transcriptomic changes along malignancy continuum.log2FC in expression of this searched gene in stem-like cells from each diseased tissue sample relative to stem-like cells in normal samples in each tissue plotted against the malignancy continuum. Samples are colored based on if they are from different disease stage.ESCC: Esophageal squamous cell carcinoma
HGIN: High-grade intraepithelial neoplasias
LGIN: Low-grade intraepithelial neoplasias
GCThe image shows the transcriptomic changes along malignancy continuum.log2FC in expression of this searched gene in stem-like cells from each diseased tissue sample relative to stem-like cells in normal samples in each tissue plotted against the malignancy continuum. Samples are colored based on if they are from different disease stage.
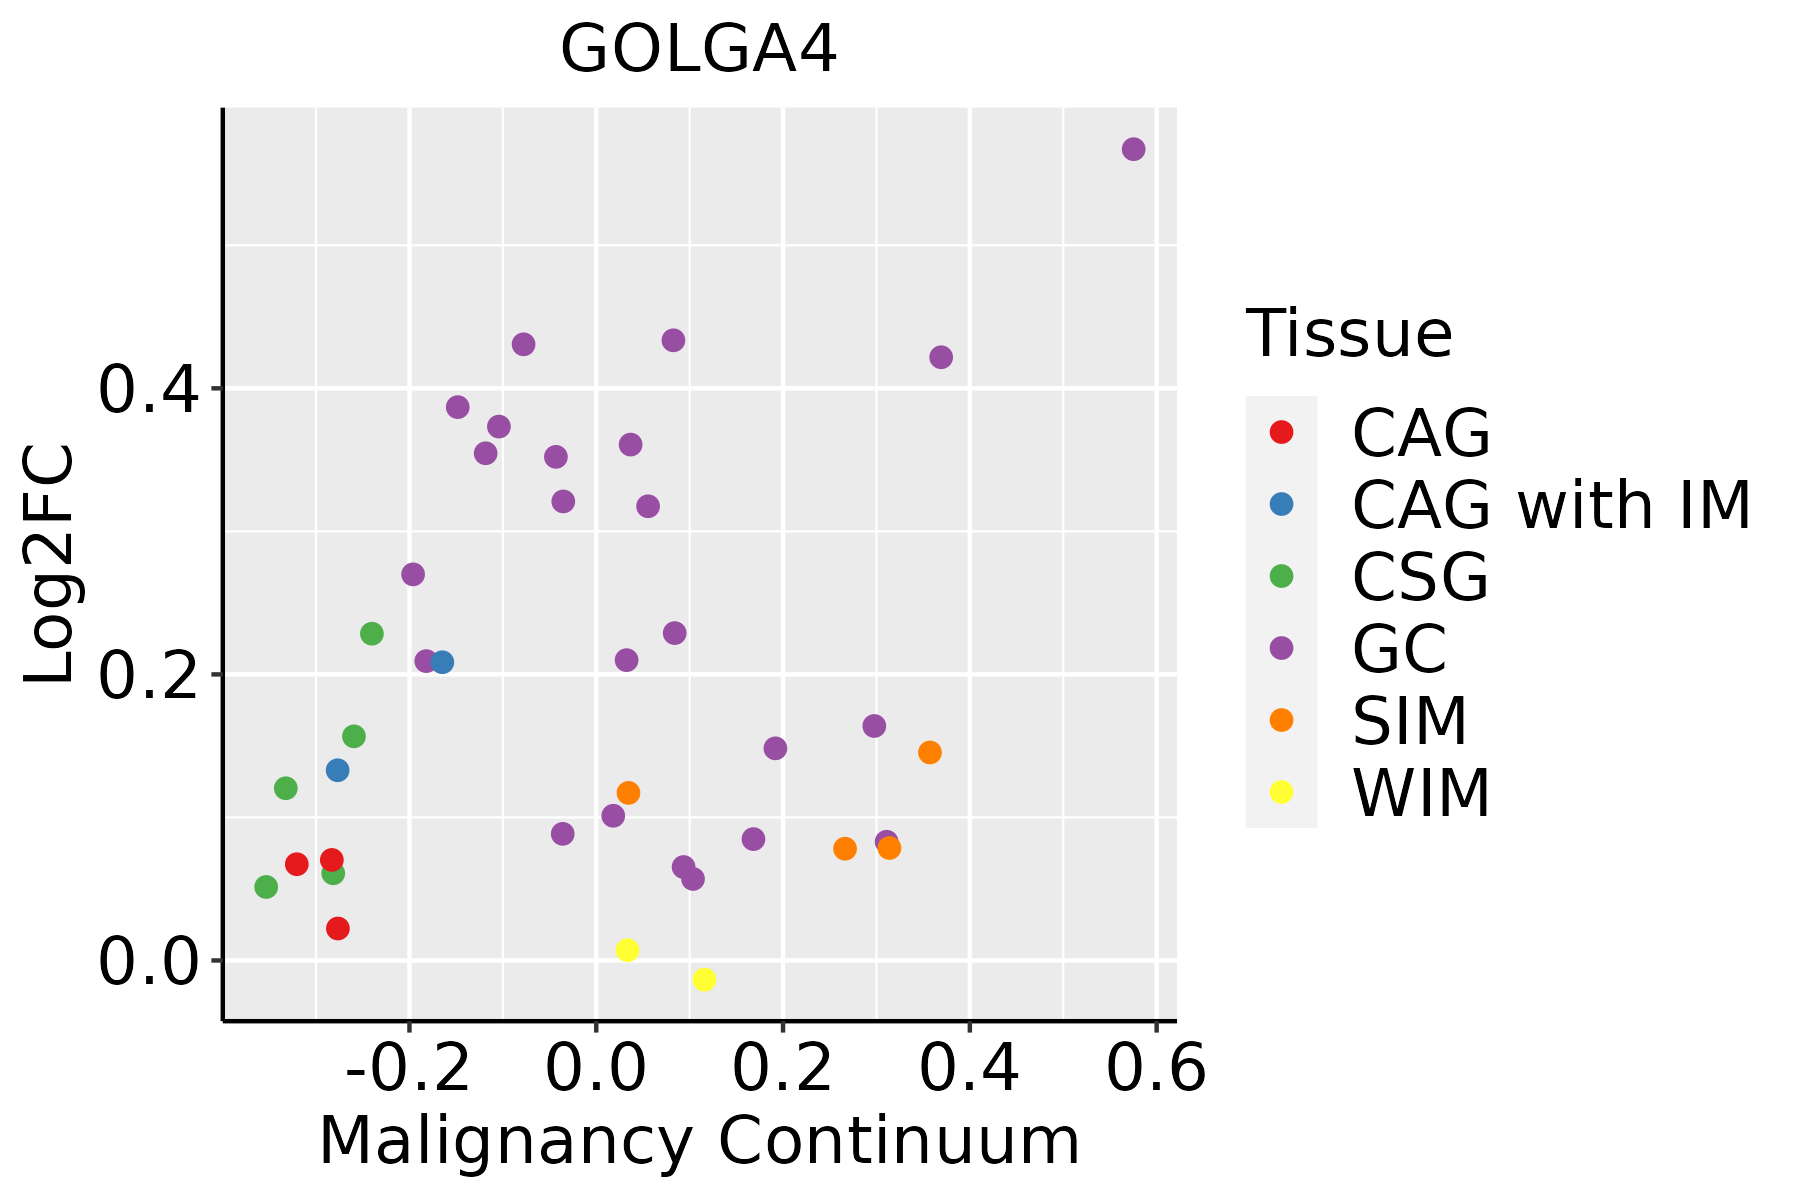
CAG: Chronic atrophic gastritis
CAG with IM: Chronic atrophic gastritis with intestinal metaplasia
CSG: Chronic superficial gastritis
GC: Gastric cancer
SIM: Severe intestinal metaplasia
WIM: Wild intestinal metaplasia
LiverThe image shows the transcriptomic changes along malignancy continuum.log2FC in expression of this searched gene in stem-like cells from each diseased tissue sample relative to stem-like cells in normal samples in each tissue plotted against the malignancy continuum. Samples are colored based on if they are from different disease stage.
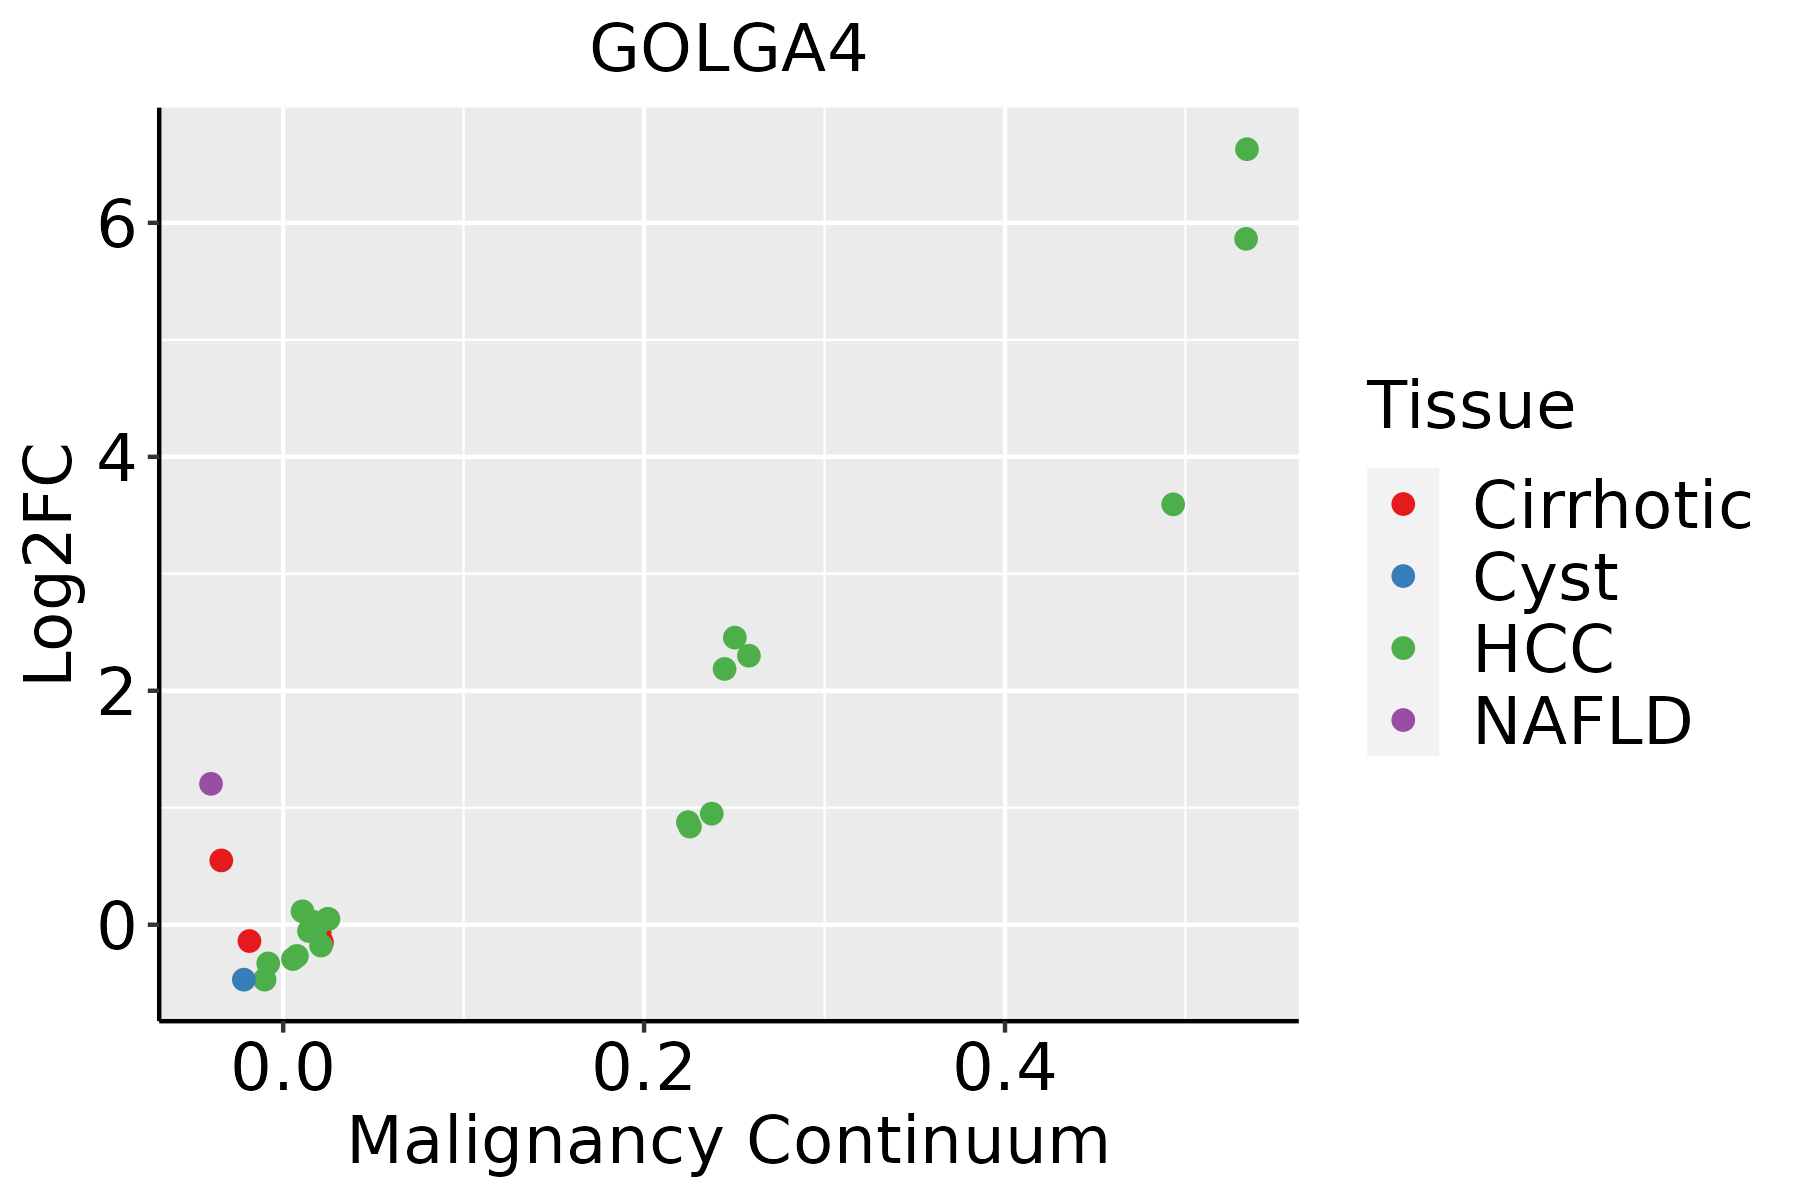
HCC: Hepatocellular carcinoma
NAFLD: Non-alcoholic fatty liver disease
LungThe image shows the transcriptomic changes along malignancy continuum.log2FC in expression of this searched gene in stem-like cells from each diseased tissue sample relative to stem-like cells in normal samples in each tissue plotted against the malignancy continuum. Samples are colored based on if they are from different disease stage.
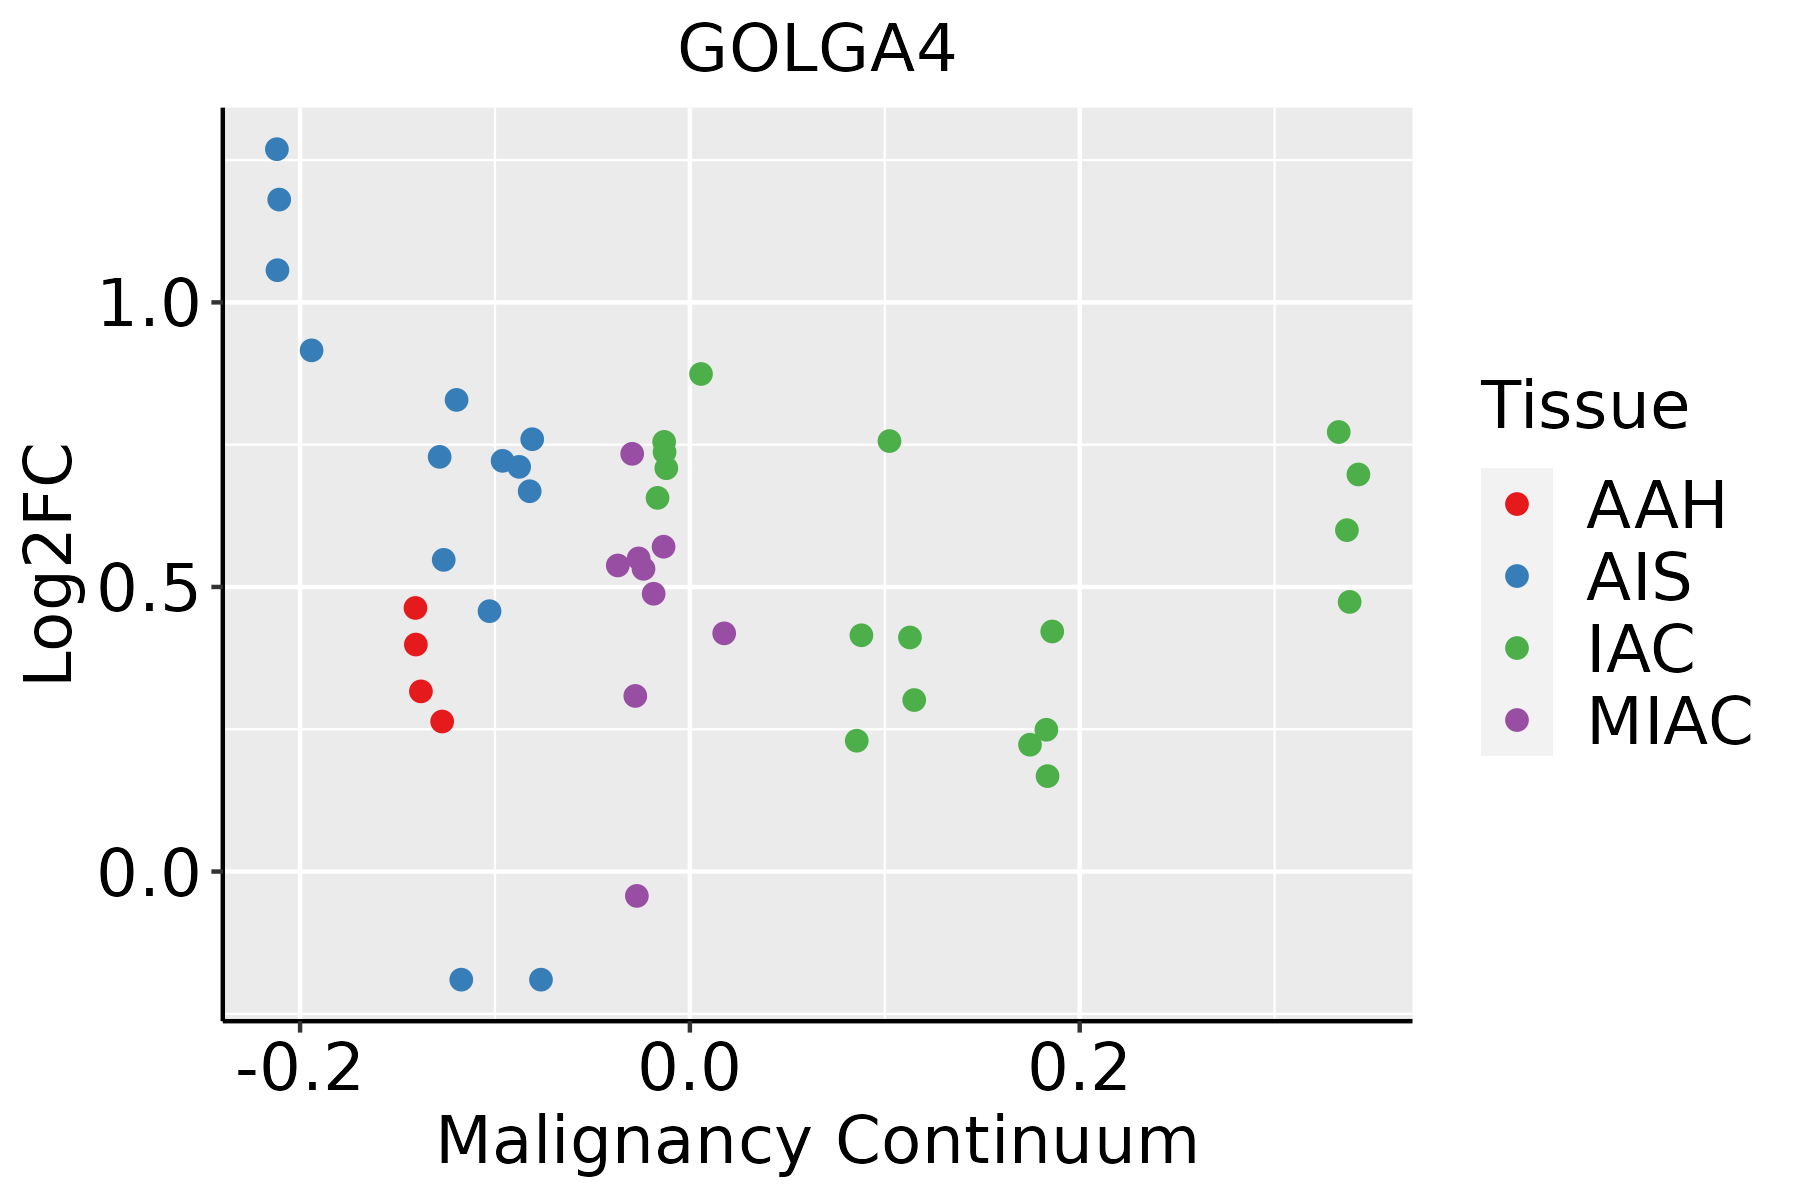
AAH: Atypical adenomatous hyperplasia
AIS: Adenocarcinoma in situ
IAC: Invasive lung adenocarcinoma
MIA: Minimally invasive adenocarcinoma
Oral CavityThe image shows the transcriptomic changes along malignancy continuum.log2FC in expression of this searched gene in stem-like cells from each diseased tissue sample relative to stem-like cells in normal samples in each tissue plotted against the malignancy continuum. Samples are colored based on if they are from different disease stage.
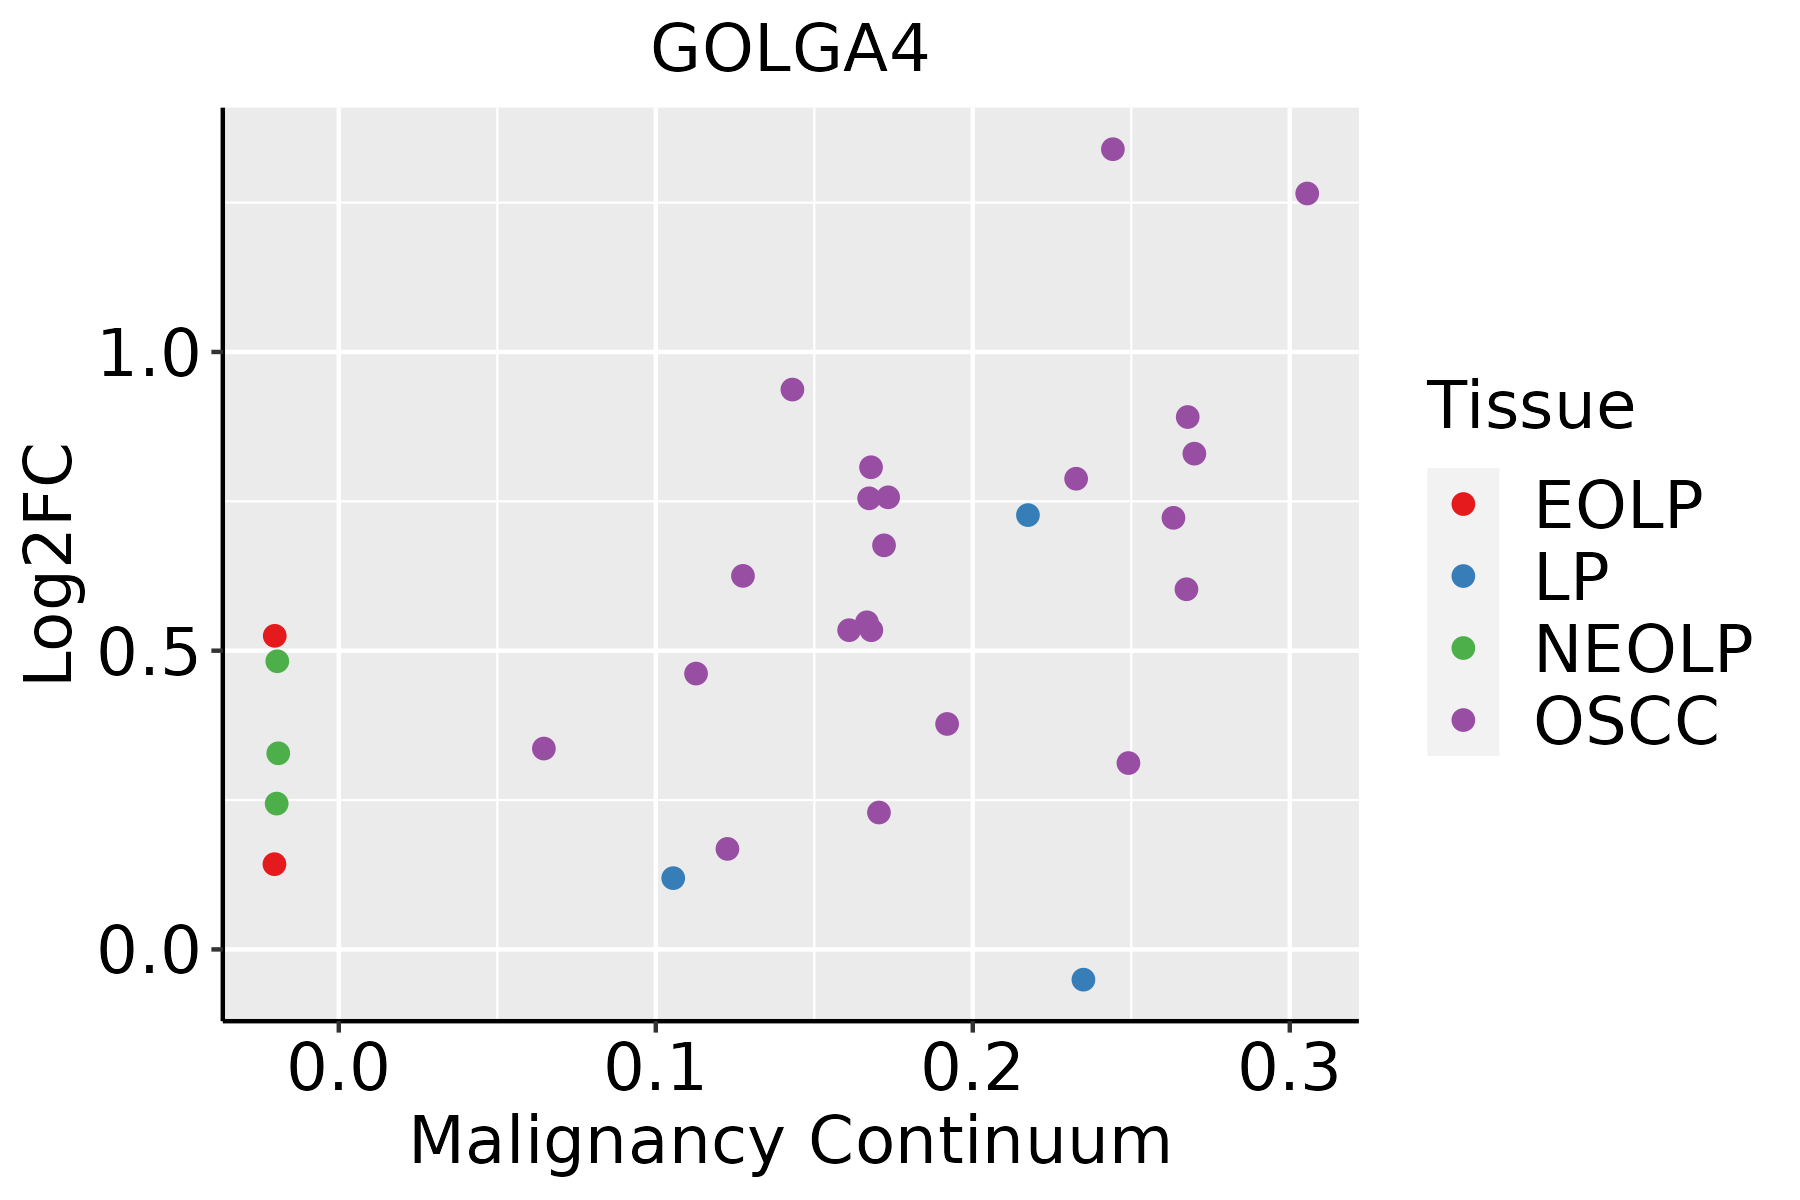
EOLP: Erosive Oral lichen planus
LP: leukoplakia
NEOLP: Non-erosive oral lichen planus
OSCC: Oral squamous cell carcinoma
ProstateThe image shows the transcriptomic changes along malignancy continuum.log2FC in expression of this searched gene in stem-like cells from each diseased tissue sample relative to stem-like cells in normal samples in each tissue plotted against the malignancy continuum. Samples are colored based on if they are from different disease stage.
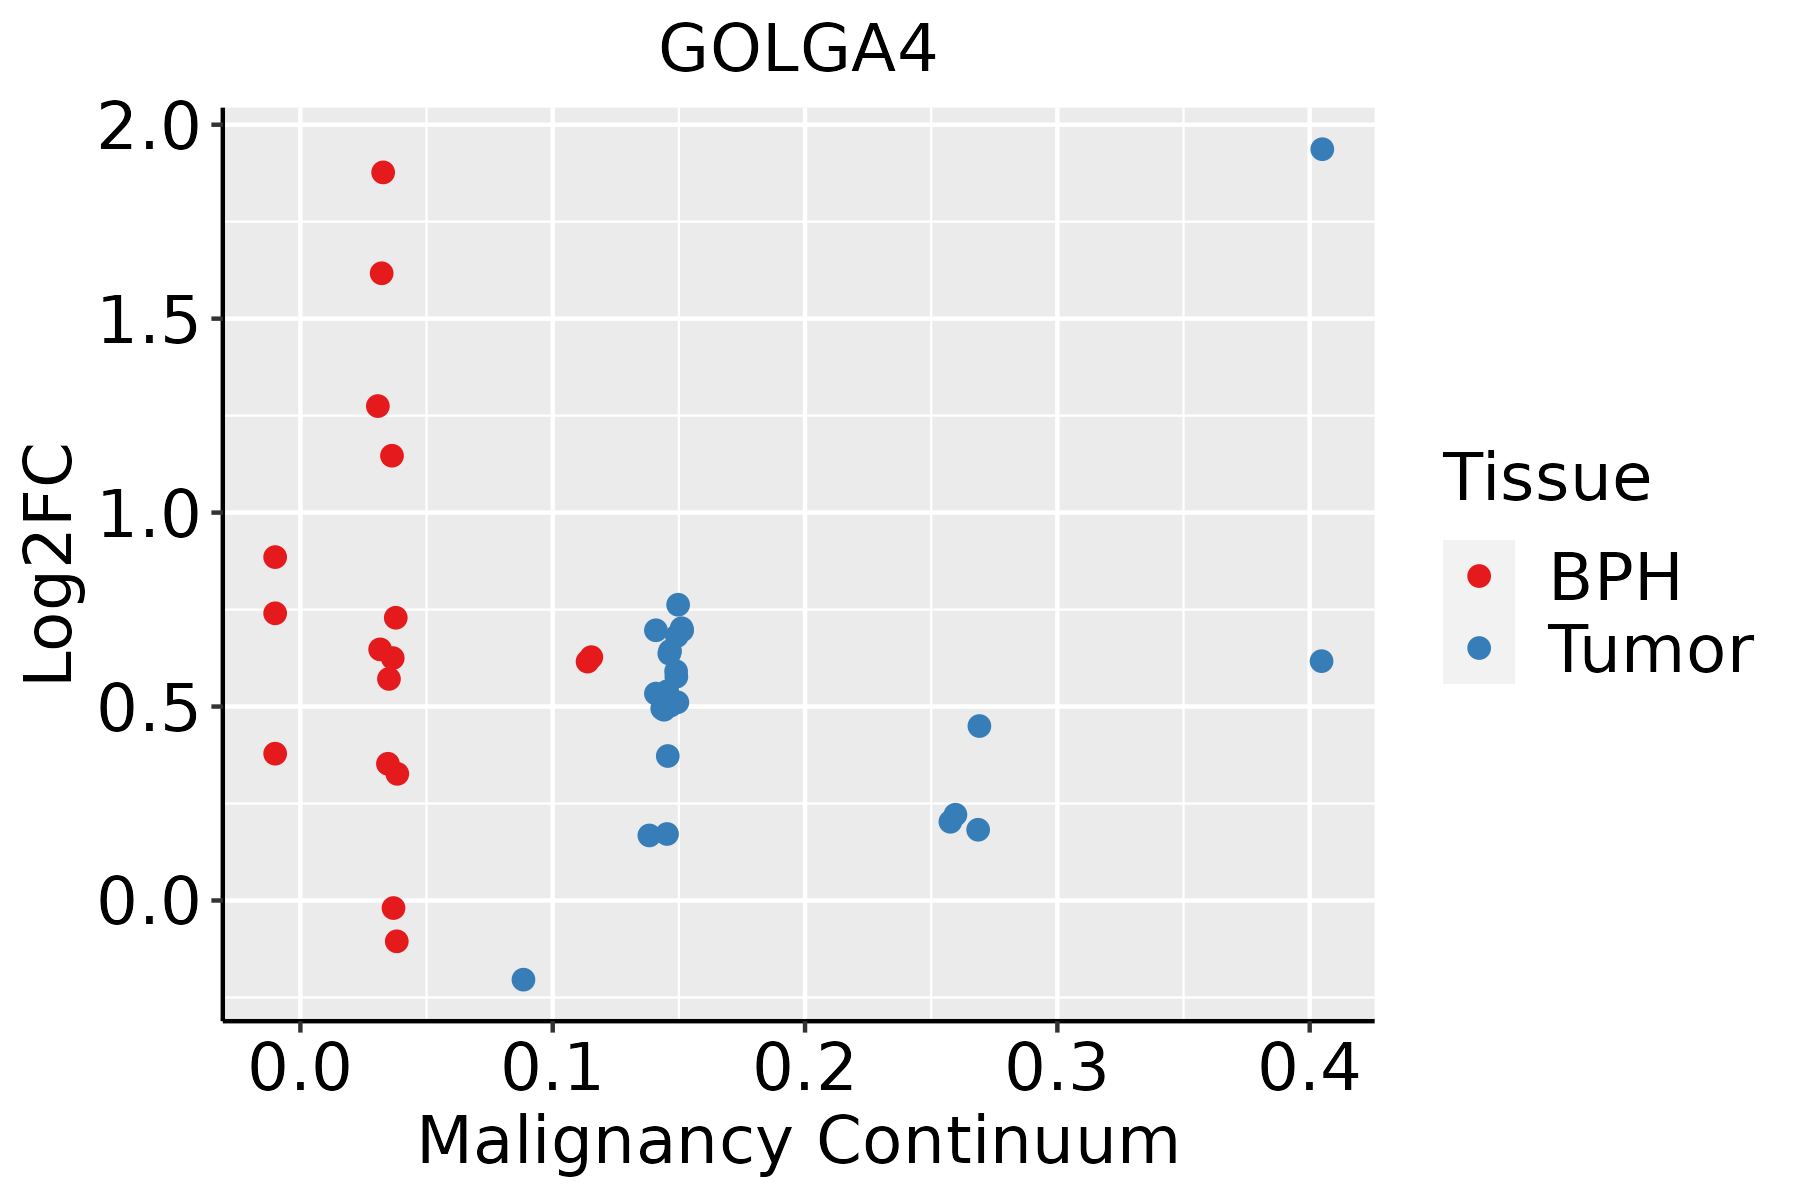
BPH: Benign Prostatic Hyperplasia
SkinThe image shows the transcriptomic changes along malignancy continuum.log2FC in expression of this searched gene in stem-like cells from each diseased tissue sample relative to stem-like cells in normal samples in each tissue plotted against the malignancy continuum. Samples are colored based on if they are from different disease stage.AK: Actinic keratosis
cSCC: Cutaneous squamous cell carcinoma
SCCIS:squamous cell carcinoma in situ
ThyroidThe image shows the transcriptomic changes along malignancy continuum.log2FC in expression of this searched gene in stem-like cells from each diseased tissue sample relative to stem-like cells in normal samples in each tissue plotted against the malignancy continuum. Samples are colored based on if they are from different disease stage.ATC: Anaplastic thyroid cancer
HT: Hashimoto's thyroiditis
PTC: Papillary thyroid cancer
∗log2FC in expression of this searched gene in stem-like cells from each diseased tissue sample relative to stem-like cells in normal samples in each tissue plotted against the malignancy continuum. Samples are colored based on if they are from different disease stage.

Top

Malignant transformation related pathway analysis

check buttonFind out the enriched GO biological processes and KEGG pathways involved in transition from healthy to precancer to cancer
check button Figure of enriched GO biological processes.
TissueDisease StageEnriched GO biological Processes
ColorectumADGO analysis - Figure of enriched GO biological processes: Top 15 enriched GO BP terms are showed in the bar plot of each disease state in each tissue. Each row represents a significant GO biological process which is colored according to the -log10(p.adjust).
ColorectumSERGO analysis - Figure of enriched GO biological processes: Top 15 enriched GO BP terms are showed in the bar plot of each disease state in each tissue. Each row represents a significant GO biological process which is colored according to the -log10(p.adjust).
ColorectumMSSGO analysis - Figure of enriched GO biological processes: Top 15 enriched GO BP terms are showed in the bar plot of each disease state in each tissue. Each row represents a significant GO biological process which is colored according to the -log10(p.adjust).
ColorectumMSI-HGO analysis - Figure of enriched GO biological processes: Top 15 enriched GO BP terms are showed in the bar plot of each disease state in each tissue. Each row represents a significant GO biological process which is colored according to the -log10(p.adjust).
ColorectumFAPGO analysis - Figure of enriched GO biological processes: Top 15 enriched GO BP terms are showed in the bar plot of each disease state in each tissue. Each row represents a significant GO biological process which is colored according to the -log10(p.adjust).
∗Top 15 enriched GO BP terms are showed in the bar plot of each disease state in each tissue. Each row represents a significant GO biological process which is colored according to the -log10(p.adjust).
Page: 1 2 3 4 5 6 7 8 9 

check button Enriched GO biological processes.
GO IDTissueDisease StageDescriptionGene RatioBg Ratiopvaluep.adjustCount
GO:006195122SkincSCCestablishment of protein localization to plasma membrane30/486460/187235.67e-055.67e-0430
GO:004300115SkincSCCGolgi to plasma membrane protein transport22/486440/187238.93e-058.37e-0422
GO:0032535111SkincSCCregulation of cellular component size131/4864383/187231.89e-041.59e-03131
GO:000155824SkincSCCregulation of cell growth140/4864414/187232.07e-041.72e-03140
GO:001072016SkincSCCpositive regulation of cell development105/4864298/187232.30e-041.89e-03105
GO:003134622SkincSCCpositive regulation of cell projection organization120/4864353/187234.49e-043.44e-03120
GO:005076913SkincSCCpositive regulation of neurogenesis80/4864225/187238.85e-046.07e-0380
GO:003030722SkincSCCpositive regulation of cell growth61/4864166/187231.39e-038.78e-0361
GO:005076722SkincSCCregulation of neurogenesis118/4864364/187233.32e-031.81e-02118
GO:001097522SkincSCCregulation of neuron projection development141/4864445/187233.72e-031.99e-02141
GO:006156422SkincSCCaxon development146/4864467/187235.50e-032.73e-02146
GO:00507729SkincSCCpositive regulation of axonogenesis31/486479/187236.63e-033.23e-0231
GO:006056023SkincSCCdevelopmental growth involved in morphogenesis78/4864234/187237.08e-033.40e-0278
GO:004592719SkincSCCpositive regulation of growth85/4864259/187238.03e-033.73e-0285
GO:199013823SkincSCCneuron projection extension59/4864172/187239.20e-034.20e-0259
GO:005196213SkincSCCpositive regulation of nervous system development88/4864272/187231.07e-024.66e-0288
GO:00325355StomachGCregulation of cellular component size44/1159383/187235.66e-051.31e-0344
GO:003253511StomachCAG with IMregulation of cellular component size41/1050383/187235.55e-051.38e-0341
GO:00726596StomachCAG with IMprotein localization to plasma membrane27/1050284/187235.25e-034.19e-0227
GO:003253521StomachCSGregulation of cellular component size41/1034383/187233.94e-051.04e-0341
Page: 1 2 3 4 5 6 7 8 9 10 11 12 13 14 15 16 17 18 19 20 21 22 23 24 25 26 27 28 29 30 31 32 

check button Enriched KEGG pathways.
Pathway IDTissueDisease StageDescriptionGene RatioBg Ratiopvaluep.adjustqvalueCount
Page: 1 

Top

Cell-cell communication analysis

check buttonIdentification of potential cell-cell interactions between two cell types and their ligand-receptor pairs for different disease states
LigandReceptorLRpairPathwayTissueDisease Stage
Page: 1 

Top

Single-cell gene regulatory network inference analysis

check buttonFind out the significant the regulons (TFs) and the target genes of each regulon across cell types for different disease states
TFCell TypeTissueDisease StageTarget GeneRSSRegulon Activity
∗The dot plots of a searched regulon are shown for all cell subpopulations in each disease state of each tissue based on the regulon specific score inferred using pySCENIC and by calculating the average expression.
Page: 1 

Top

Somatic mutation of malignant transformation related genes

check buttonAnnotation of somatic variants for genes involved in malignant transformation
Hugo SymbolVariant ClassVariant ClassificationdbSNP RSHGVScHGVSpHGVSp ShortSWISSPROTBIOTYPESIFTPolyPhenTumor Sample BarcodeTissueHistologySexAgeStageTherapy TypesDrugsOutcome
GOLGA4SNVMissense_Mutationc.3932A>Gp.Asn1311Serp.N1311SQ13439protein_codingtolerated(0.75)benign(0.001)TCGA-A8-A07L-01Breastbreast invasive carcinomaFemale<65III/IVChemotherapyCR
GOLGA4SNVMissense_Mutationc.3722N>Ap.Ile1241Asnp.I1241NQ13439protein_codingtolerated(0.55)benign(0.037)TCGA-A8-A0A1-01Breastbreast invasive carcinomaFemale>=65I/IIHormone TherapytamoxiphenSD
GOLGA4SNVMissense_Mutationrs768808136c.296N>Ap.Arg99Glnp.R99QQ13439protein_codingdeleterious(0.02)probably_damaging(0.996)TCGA-AN-A046-01Breastbreast invasive carcinomaFemale>=65I/IIUnknownUnknownSD
GOLGA4SNVMissense_Mutationrs764030527c.4237N>Ap.Glu1413Lysp.E1413KQ13439protein_codingdeleterious(0)possibly_damaging(0.864)TCGA-AN-A046-01Breastbreast invasive carcinomaFemale>=65I/IIUnknownUnknownSD
GOLGA4SNVMissense_Mutationrs750023676c.6565N>Ap.Glu2189Lysp.E2189KQ13439protein_codingdeleterious(0)probably_damaging(0.922)TCGA-AN-A046-01Breastbreast invasive carcinomaFemale>=65I/IIUnknownUnknownSD
GOLGA4SNVMissense_Mutationnovelc.431G>Ap.Ser144Asnp.S144NQ13439protein_codingdeleterious(0)probably_damaging(0.994)TCGA-AO-A1KP-01Breastbreast invasive carcinomaFemale>=65I/IIChemotherapyfluorouracilSD
GOLGA4SNVMissense_Mutationc.1411N>Ap.Glu471Lysp.E471KQ13439protein_codingdeleterious(0)probably_damaging(0.959)TCGA-BH-A0AW-01Breastbreast invasive carcinomaFemale<65I/IIChemotherapycarboplatinSD
GOLGA4SNVMissense_Mutationc.6097N>Ap.Glu2033Lysp.E2033KQ13439protein_codingdeleterious(0)probably_damaging(0.911)TCGA-BH-A0HP-01Breastbreast invasive carcinomaFemale>=65III/IVChemotherapydoxorubicinSD
GOLGA4SNVMissense_Mutationc.1885N>Ap.Val629Ilep.V629IQ13439protein_codingtolerated(0.36)benign(0)TCGA-BH-A18G-01Breastbreast invasive carcinomaFemale>=65I/IIUnknownUnknownSD
GOLGA4SNVMissense_Mutationc.1372N>Ap.Glu458Lysp.E458KQ13439protein_codingdeleterious(0.02)probably_damaging(0.922)TCGA-BH-A18K-01Breastbreast invasive carcinomaFemale<65I/IIUnknownUnknownPD
Page: 1 2 3 4 5 6 7 8 9 10 11 12 13 14 15 16 17 18 19 20 21 22 

Top

Related drugs of malignant transformation related genes

check buttonIdentification of chemicals and drugs interact with genes involved in malignant transfromation
(DGIdb 4.0)
Entrez IDSymbolCategoryInteraction TypesDrug Claim NameDrug NamePMIDs
Page: 1