
|
|||||
|
 | |
| |
| |
| |
| |
| |
|
Gene: GBP1 |
Gene summary for GBP1 |
| Gene information | Species | Human | Gene symbol | GBP1 | Gene ID | 2633 |
| Gene name | guanylate binding protein 1 | |
| Gene Alias | GBP1 | |
| Cytomap | 1p22.2 | |
| Gene Type | protein-coding | GO ID | GO:0000165 | UniProtAcc | P32455 |
Top |
Malignant transformation analysis |
| Identification of the aberrant gene expression in precancerous and cancerous lesions by comparing the gene expression of stem-like cells in diseased tissues with normal stem cells |
| Entrez ID | Symbol | Replicates | Species | Organ | Tissue | Adj P-value | Log2FC | Malignancy |
| 2633 | GBP1 | GSM4909281 | Human | Breast | IDC | 9.64e-23 | 6.76e-01 | 0.21 |
| 2633 | GBP1 | GSM4909286 | Human | Breast | IDC | 3.11e-02 | -8.38e-02 | 0.1081 |
| 2633 | GBP1 | GSM4909287 | Human | Breast | IDC | 2.32e-04 | 3.43e-01 | 0.2057 |
| 2633 | GBP1 | GSM4909301 | Human | Breast | IDC | 3.11e-02 | -8.05e-02 | 0.1577 |
| 2633 | GBP1 | GSM4909311 | Human | Breast | IDC | 1.48e-02 | -8.42e-02 | 0.1534 |
| 2633 | GBP1 | GSM4909319 | Human | Breast | IDC | 1.48e-02 | -8.42e-02 | 0.1563 |
| 2633 | GBP1 | NCCBC5 | Human | Breast | DCIS | 3.62e-06 | 3.73e-01 | 0.2046 |
| 2633 | GBP1 | P2 | Human | Breast | IDC | 6.13e-16 | 8.00e-01 | 0.21 |
| 2633 | GBP1 | DCIS2 | Human | Breast | DCIS | 2.12e-06 | 5.83e-02 | 0.0085 |
| 2633 | GBP1 | CA_HPV_1 | Human | Cervix | CC | 4.19e-25 | 8.72e-01 | 0.0264 |
| 2633 | GBP1 | CA_HPV_2 | Human | Cervix | CC | 1.88e-02 | 2.53e-01 | 0.0391 |
| 2633 | GBP1 | N_HPV_2 | Human | Cervix | N_HPV | 3.78e-03 | 2.02e-01 | -0.0131 |
| 2633 | GBP1 | CCI_2 | Human | Cervix | CC | 7.53e-10 | 9.02e-01 | 0.5249 |
| 2633 | GBP1 | Tumor | Human | Cervix | CC | 2.41e-07 | 4.03e-01 | 0.1241 |
| 2633 | GBP1 | sample1 | Human | Cervix | CC | 2.13e-17 | 7.89e-01 | 0.0959 |
| 2633 | GBP1 | sample3 | Human | Cervix | CC | 1.46e-09 | 3.64e-01 | 0.1387 |
| 2633 | GBP1 | T1 | Human | Cervix | CC | 9.70e-18 | 6.31e-01 | 0.0918 |
| 2633 | GBP1 | T3 | Human | Cervix | CC | 4.38e-11 | 4.01e-01 | 0.1389 |
| 2633 | GBP1 | LZE4T | Human | Esophagus | ESCC | 1.53e-10 | 4.67e-01 | 0.0811 |
| 2633 | GBP1 | LZE8T | Human | Esophagus | ESCC | 1.35e-08 | 4.04e-01 | 0.067 |
| Page: 1 2 3 4 5 6 7 |
| Tissue | Expression Dynamics | Abbreviation |
| Breast | 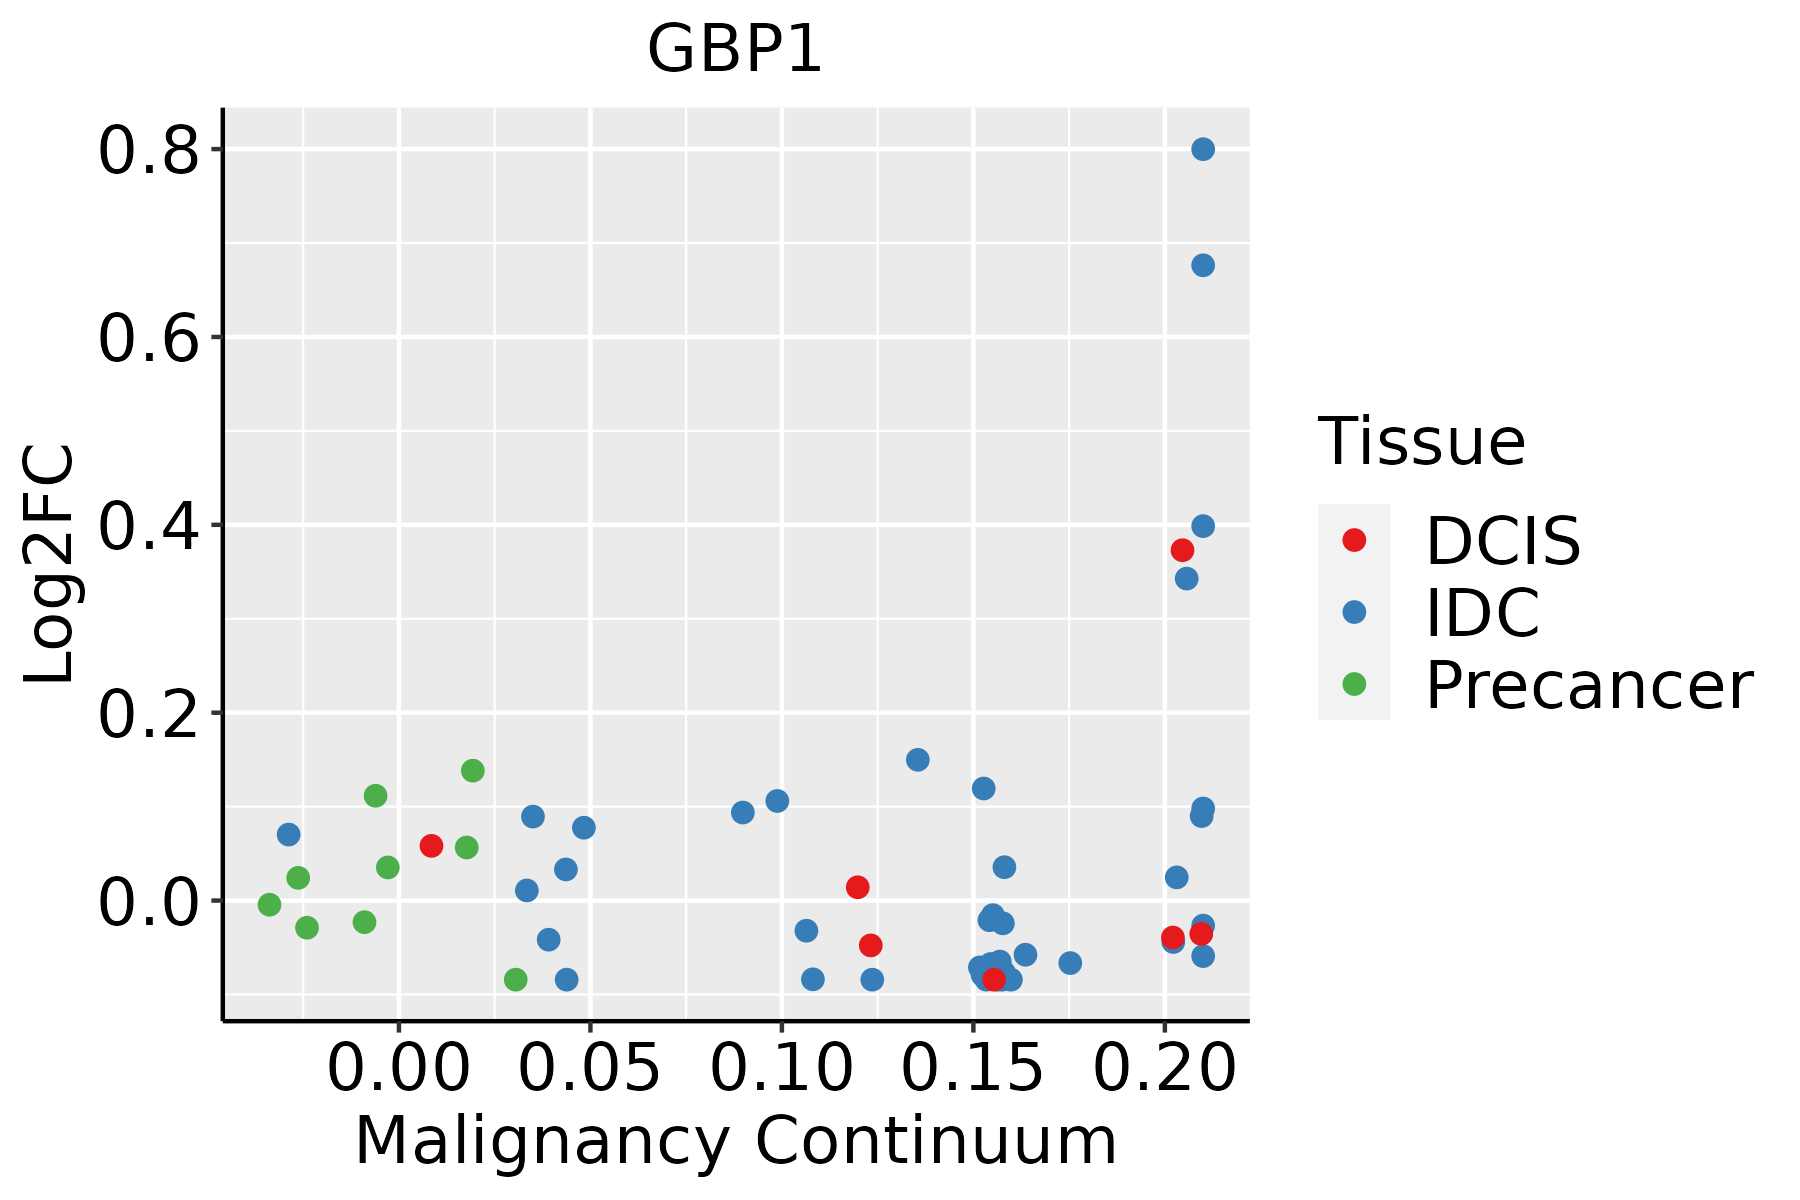 | IDC: Invasive ductal carcinoma |
| DCIS: Ductal carcinoma in situ | ||
| Precancer(BRCA1-mut): Precancerous lesion from BRCA1 mutation carriers | ||
| Cervix |  | CC: Cervix cancer |
| HSIL_HPV: HPV-infected high-grade squamous intraepithelial lesions | ||
| N_HPV: HPV-infected normal cervix | ||
| Esophagus | 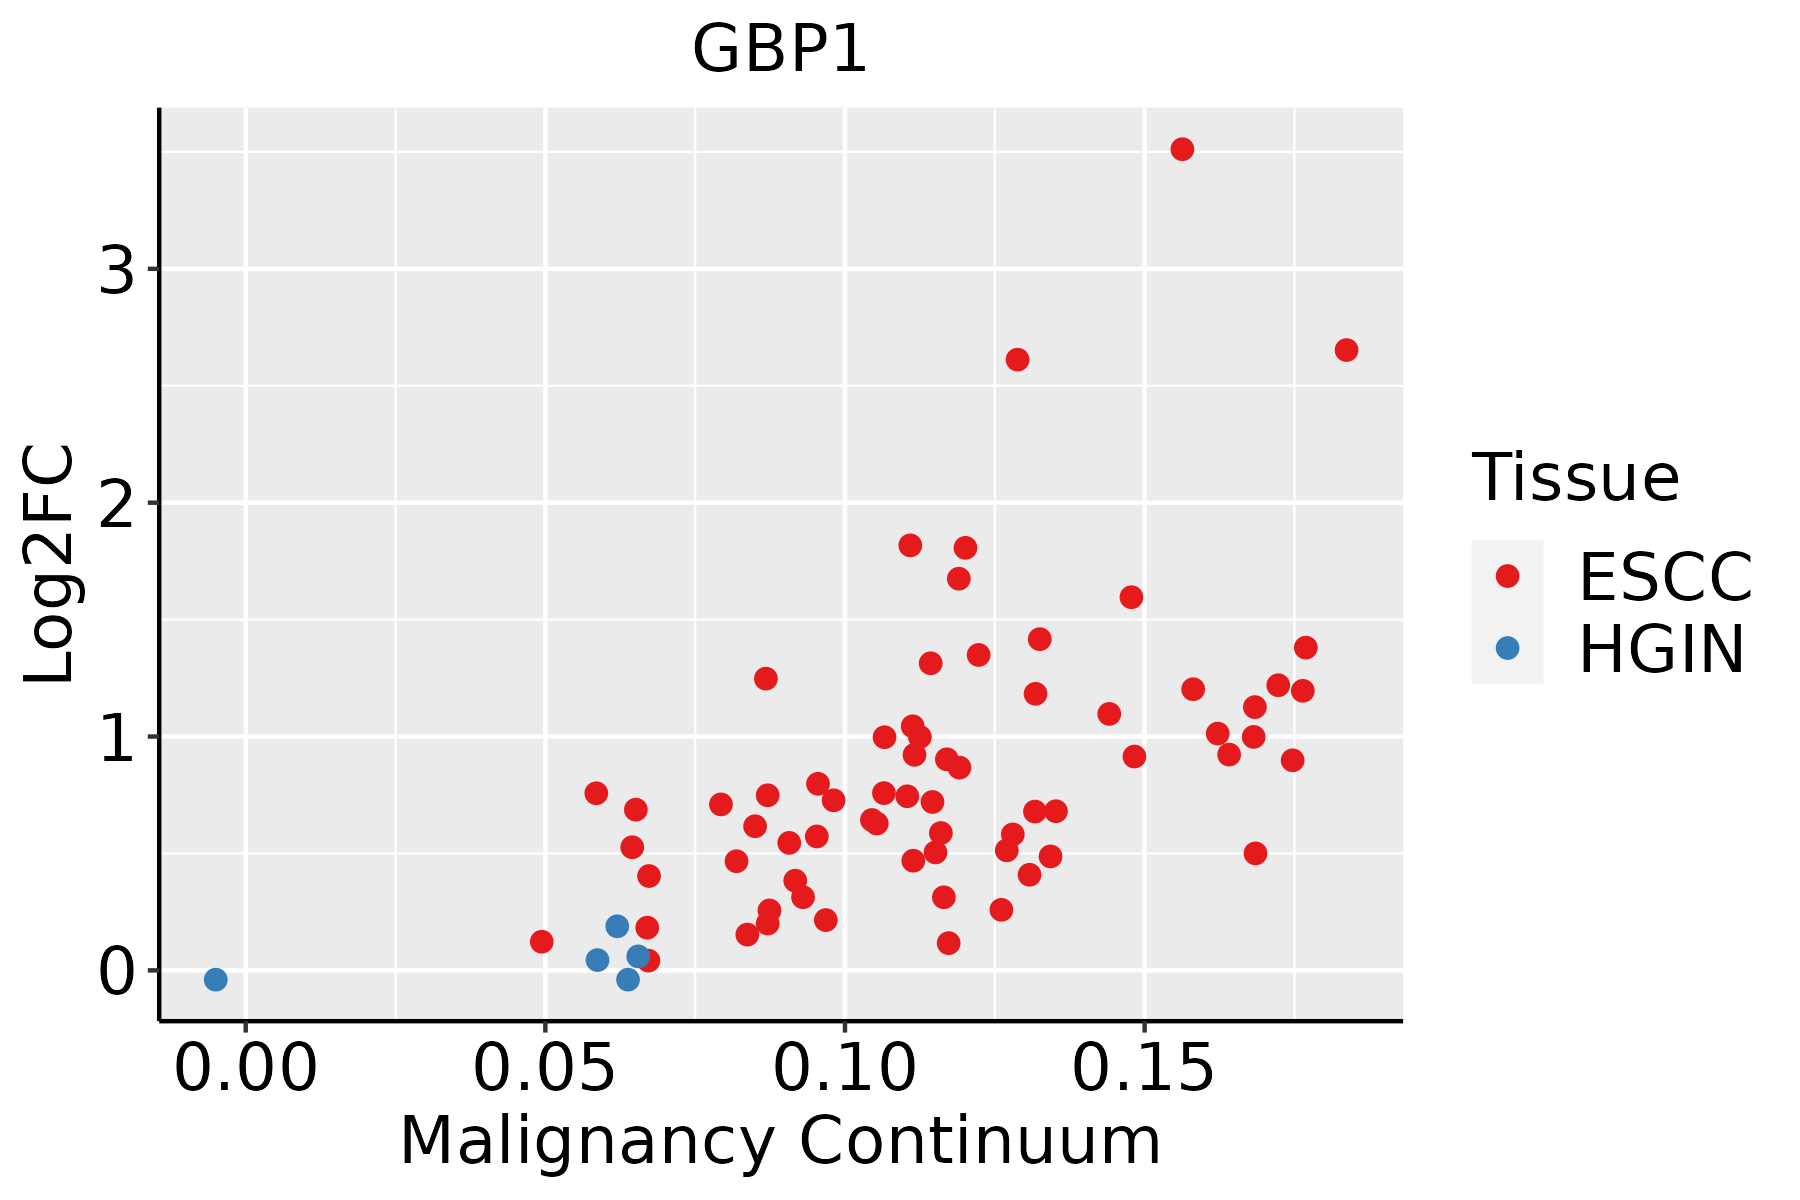 | ESCC: Esophageal squamous cell carcinoma |
| HGIN: High-grade intraepithelial neoplasias | ||
| LGIN: Low-grade intraepithelial neoplasias | ||
| Liver | 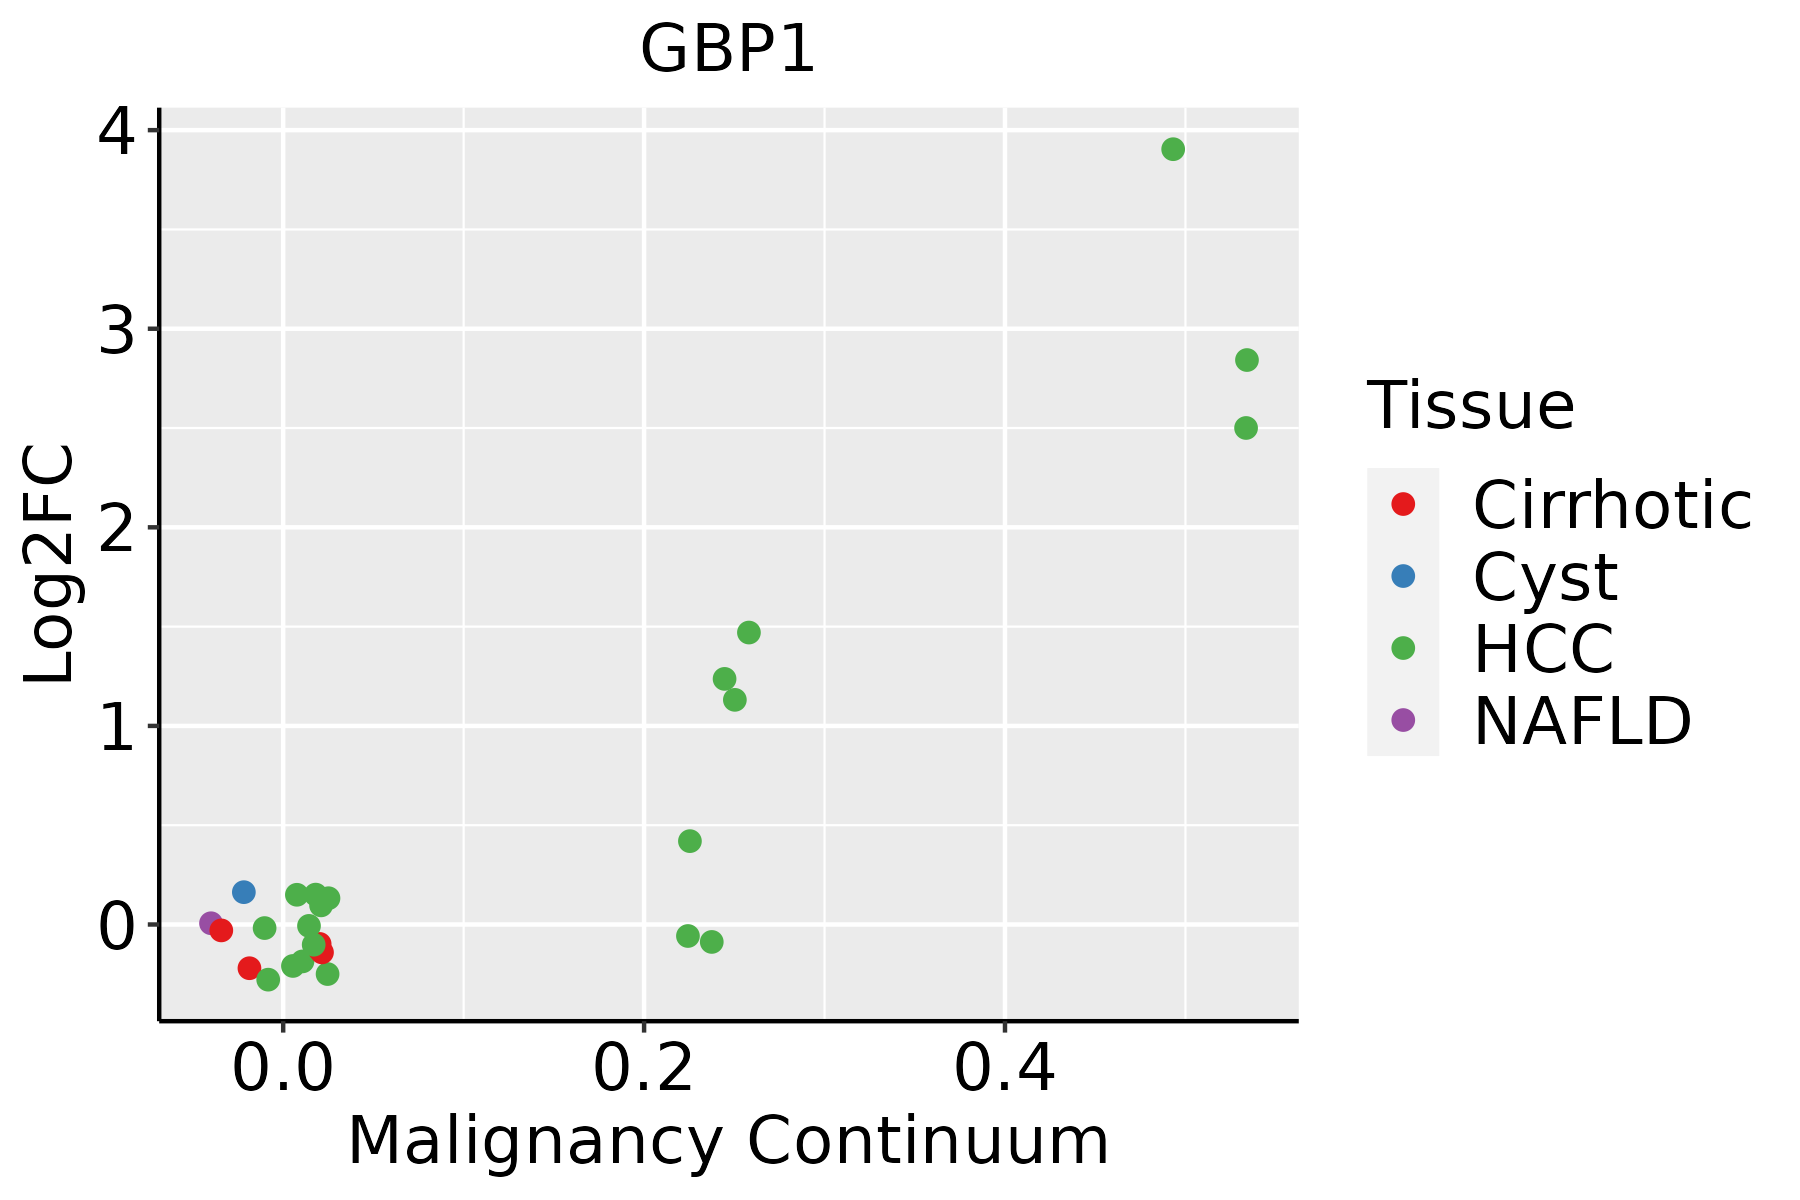 | HCC: Hepatocellular carcinoma |
| NAFLD: Non-alcoholic fatty liver disease | ||
| Oral Cavity | 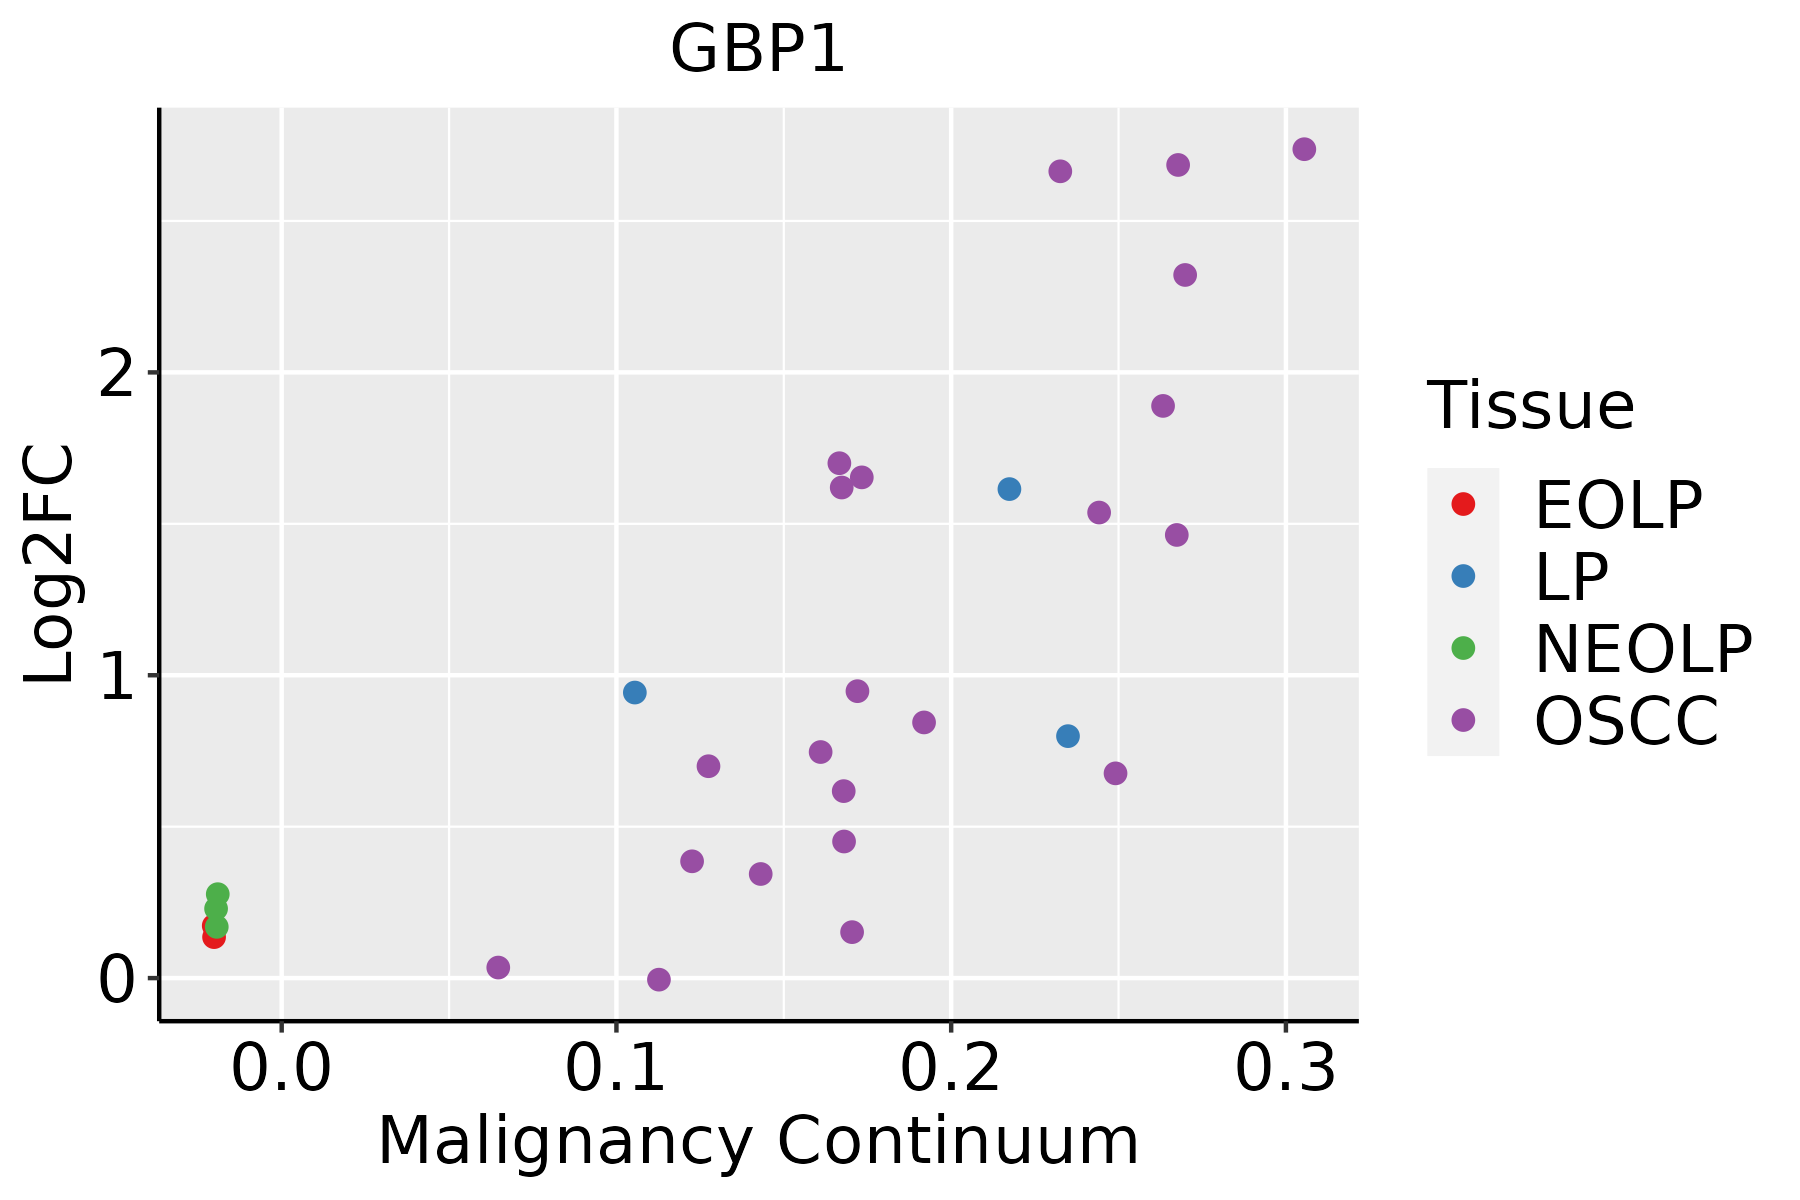 | EOLP: Erosive Oral lichen planus |
| LP: leukoplakia | ||
| NEOLP: Non-erosive oral lichen planus | ||
| OSCC: Oral squamous cell carcinoma | ||
| Skin | 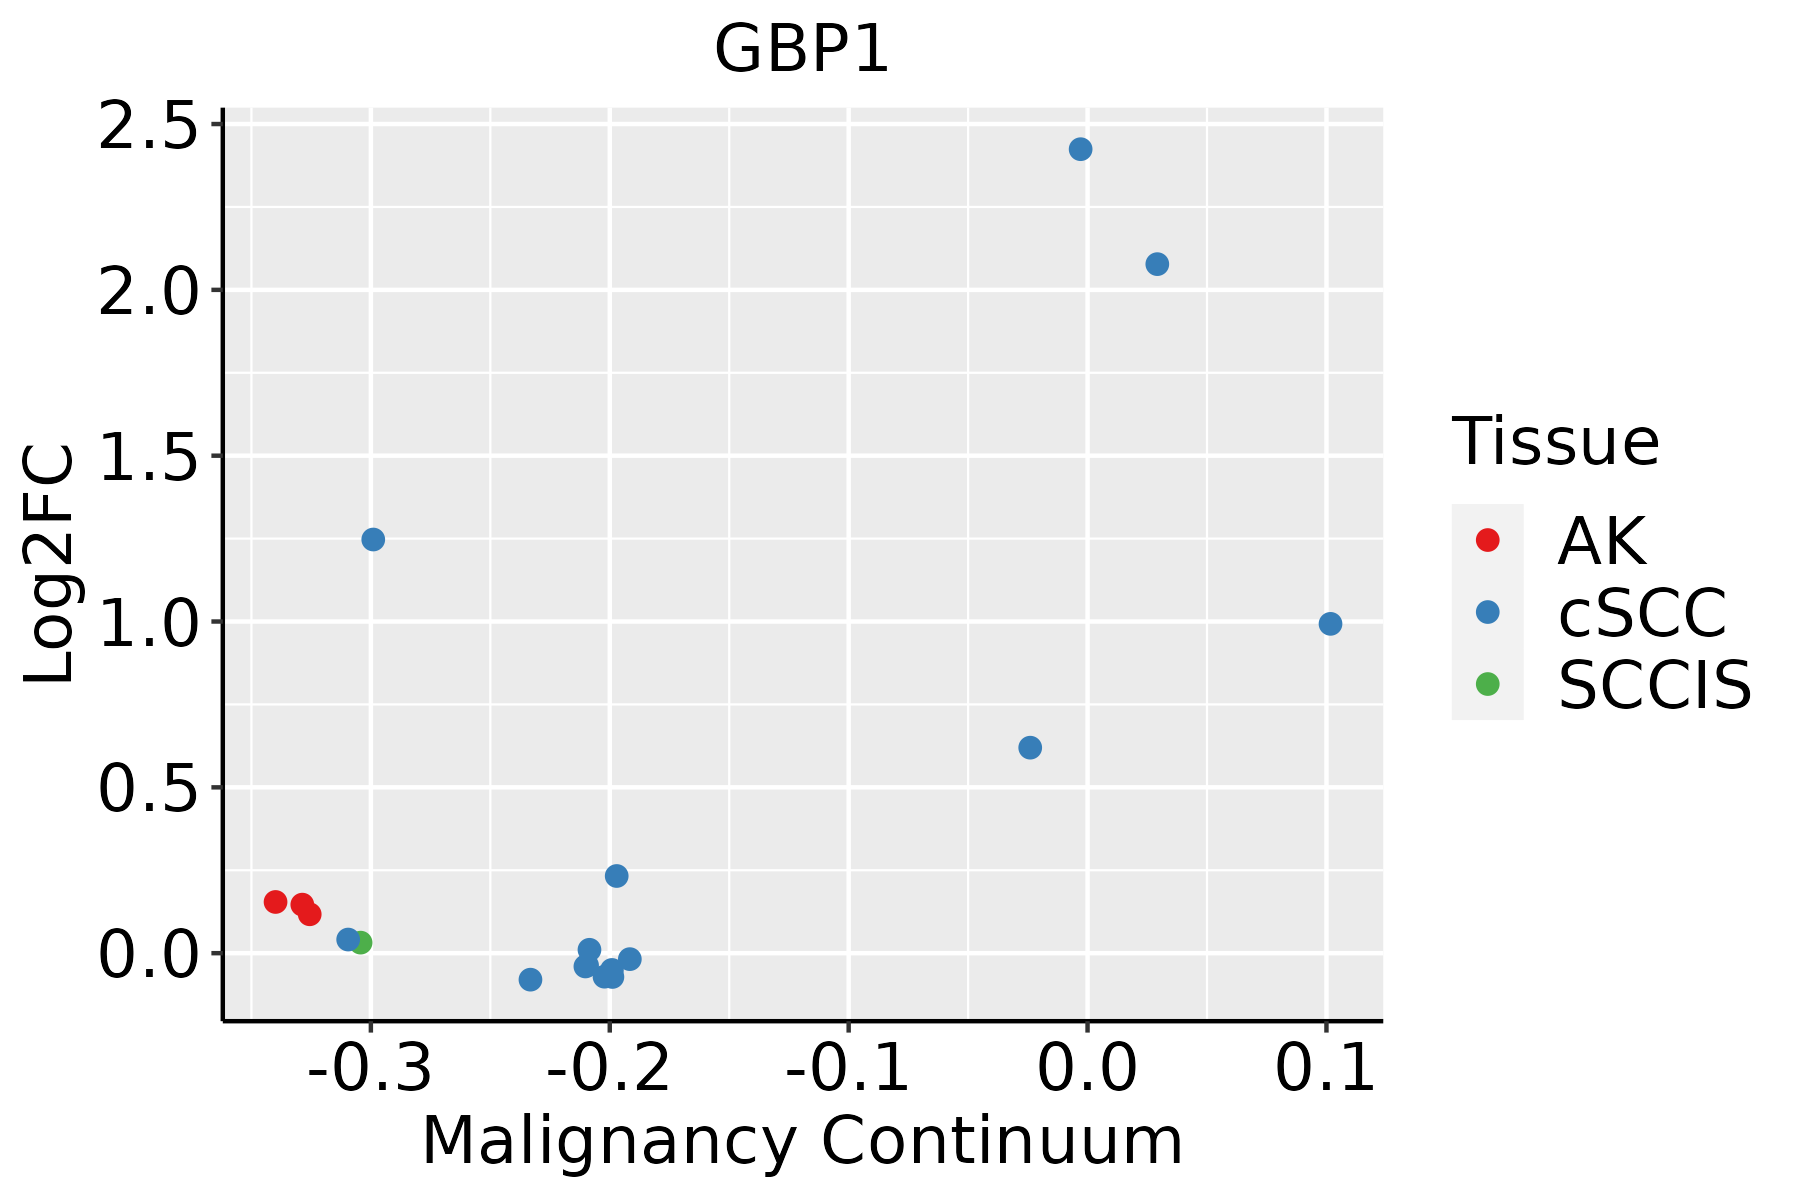 | AK: Actinic keratosis |
| cSCC: Cutaneous squamous cell carcinoma | ||
| SCCIS:squamous cell carcinoma in situ | ||
| Thyroid |  | ATC: Anaplastic thyroid cancer |
| HT: Hashimoto's thyroiditis | ||
| PTC: Papillary thyroid cancer |
| ∗log2FC in expression of this searched gene in stem-like cells from each diseased tissue sample relative to stem-like cells in normal samples in each tissue plotted against the malignancy continuum. Samples are colored based on if they are from different disease stage. |
Top |
Malignant transformation related pathway analysis |
| Find out the enriched GO biological processes and KEGG pathways involved in transition from healthy to precancer to cancer |
| Tissue | Disease Stage | Enriched GO biological Processes |
| Colorectum | AD |  |
| Colorectum | SER |  |
| Colorectum | MSS |  |
| Colorectum | MSI-H |  |
| Colorectum | FAP |  |
| ∗Top 15 enriched GO BP terms are showed in the bar plot of each disease state in each tissue. Each row represents a significant GO biological process which is colored according to the -log10(p.adjust). |
| Page: 1 2 3 4 5 6 7 8 9 |
| GO ID | Tissue | Disease Stage | Description | Gene Ratio | Bg Ratio | pvalue | p.adjust | Count |
| GO:007030325 | Skin | cSCC | negative regulation of stress-activated protein kinase signaling cascade | 24/4864 | 51/18723 | 9.43e-04 | 6.42e-03 | 24 |
| GO:001046626 | Skin | cSCC | negative regulation of peptidase activity | 91/4864 | 262/18723 | 9.73e-04 | 6.58e-03 | 91 |
| GO:003461226 | Skin | cSCC | response to tumor necrosis factor | 88/4864 | 253/18723 | 1.11e-03 | 7.31e-03 | 88 |
| GO:0034446110 | Skin | cSCC | substrate adhesion-dependent cell spreading | 43/4864 | 108/18723 | 1.12e-03 | 7.36e-03 | 43 |
| GO:0035303112 | Skin | cSCC | regulation of dephosphorylation | 49/4864 | 128/18723 | 1.46e-03 | 9.17e-03 | 49 |
| GO:19043766 | Skin | cSCC | negative regulation of protein localization to cell periphery | 14/4864 | 26/18723 | 2.26e-03 | 1.32e-02 | 14 |
| GO:007135625 | Skin | cSCC | cellular response to tumor necrosis factor | 79/4864 | 229/18723 | 2.48e-03 | 1.42e-02 | 79 |
| GO:001631115 | Skin | cSCC | dephosphorylation | 134/4864 | 417/18723 | 2.65e-03 | 1.50e-02 | 134 |
| GO:003288612 | Skin | cSCC | regulation of microtubule-based process | 82/4864 | 240/18723 | 2.82e-03 | 1.58e-02 | 82 |
| GO:001077121 | Skin | cSCC | negative regulation of cell morphogenesis involved in differentiation | 9/4864 | 14/18723 | 2.87e-03 | 1.60e-02 | 9 |
| GO:190002521 | Skin | cSCC | negative regulation of substrate adhesion-dependent cell spreading | 9/4864 | 14/18723 | 2.87e-03 | 1.60e-02 | 9 |
| GO:19030779 | Skin | cSCC | negative regulation of protein localization to plasma membrane | 13/4864 | 24/18723 | 3.02e-03 | 1.67e-02 | 13 |
| GO:000716224 | Skin | cSCC | negative regulation of cell adhesion | 98/4864 | 303/18723 | 7.45e-03 | 3.50e-02 | 98 |
| GO:004002912 | Skin | cSCC | regulation of gene expression, epigenetic | 39/4864 | 105/18723 | 7.56e-03 | 3.53e-02 | 39 |
| GO:19054765 | Skin | cSCC | negative regulation of protein localization to membrane | 15/4864 | 32/18723 | 8.65e-03 | 4.00e-02 | 15 |
| GO:001081221 | Skin | cSCC | negative regulation of cell-substrate adhesion | 27/4864 | 68/18723 | 9.07e-03 | 4.16e-02 | 27 |
| GO:005085221 | Skin | cSCC | T cell receptor signaling pathway | 44/4864 | 123/18723 | 1.02e-02 | 4.47e-02 | 44 |
| GO:0022604112 | Thyroid | PTC | regulation of cell morphogenesis | 165/5968 | 309/18723 | 2.60e-15 | 1.82e-13 | 165 |
| GO:0072659112 | Thyroid | PTC | protein localization to plasma membrane | 153/5968 | 284/18723 | 9.90e-15 | 6.50e-13 | 153 |
| GO:1990778111 | Thyroid | PTC | protein localization to cell periphery | 172/5968 | 333/18723 | 3.71e-14 | 2.30e-12 | 172 |
| Page: 1 2 3 4 5 6 7 8 9 10 11 12 13 14 15 16 17 18 19 20 21 22 23 24 25 26 27 28 29 30 31 32 |
| Pathway ID | Tissue | Disease Stage | Description | Gene Ratio | Bg Ratio | pvalue | p.adjust | qvalue | Count |
| hsa046213 | Cervix | CC | NOD-like receptor signaling pathway | 41/1267 | 186/8465 | 5.90e-03 | 1.95e-02 | 1.15e-02 | 41 |
| hsa0462112 | Cervix | CC | NOD-like receptor signaling pathway | 41/1267 | 186/8465 | 5.90e-03 | 1.95e-02 | 1.15e-02 | 41 |
| hsa0462122 | Esophagus | ESCC | NOD-like receptor signaling pathway | 116/4205 | 186/8465 | 2.90e-04 | 1.03e-03 | 5.30e-04 | 116 |
| hsa0462132 | Esophagus | ESCC | NOD-like receptor signaling pathway | 116/4205 | 186/8465 | 2.90e-04 | 1.03e-03 | 5.30e-04 | 116 |
| hsa046218 | Oral cavity | OSCC | NOD-like receptor signaling pathway | 108/3704 | 186/8465 | 5.13e-05 | 2.07e-04 | 1.05e-04 | 108 |
| hsa0462113 | Oral cavity | OSCC | NOD-like receptor signaling pathway | 108/3704 | 186/8465 | 5.13e-05 | 2.07e-04 | 1.05e-04 | 108 |
| hsa0462121 | Oral cavity | LP | NOD-like receptor signaling pathway | 73/2418 | 186/8465 | 9.80e-04 | 4.53e-03 | 2.92e-03 | 73 |
| hsa0462131 | Oral cavity | LP | NOD-like receptor signaling pathway | 73/2418 | 186/8465 | 9.80e-04 | 4.53e-03 | 2.92e-03 | 73 |
| Page: 1 |
Top |
Cell-cell communication analysis |
| Identification of potential cell-cell interactions between two cell types and their ligand-receptor pairs for different disease states |
| Ligand | Receptor | LRpair | Pathway | Tissue | Disease Stage |
| Page: 1 |
Top |
Single-cell gene regulatory network inference analysis |
| Find out the significant the regulons (TFs) and the target genes of each regulon across cell types for different disease states |
| TF | Cell Type | Tissue | Disease Stage | Target Gene | RSS | Regulon Activity |
| ∗The dot plots of a searched regulon are shown for all cell subpopulations in each disease state of each tissue based on the regulon specific score inferred using pySCENIC and by calculating the average expression. |
| Page: 1 |
Top |
Somatic mutation of malignant transformation related genes |
| Annotation of somatic variants for genes involved in malignant transformation |
| Hugo Symbol | Variant Class | Variant Classification | dbSNP RS | HGVSc | HGVSp | HGVSp Short | SWISSPROT | BIOTYPE | SIFT | PolyPhen | Tumor Sample Barcode | Tissue | Histology | Sex | Age | Stage | Therapy Types | Drugs | Outcome |
| GBP1 | SNV | Missense_Mutation | c.804N>A | p.Asp268Glu | p.D268E | P32455 | protein_coding | tolerated(1) | benign(0) | TCGA-A2-A0YF-01 | Breast | breast invasive carcinoma | Female | >=65 | I/II | Unspecific | Arimidex | SD | |
| GBP1 | SNV | Missense_Mutation | novel | c.1534N>C | p.Lys512Gln | p.K512Q | P32455 | protein_coding | tolerated(0.31) | benign(0.017) | TCGA-GM-A3XL-01 | Breast | breast invasive carcinoma | Female | <65 | I/II | Chemotherapy | fluorouracil | CR |
| GBP1 | SNV | Missense_Mutation | novel | c.1409C>T | p.Ser470Phe | p.S470F | P32455 | protein_coding | deleterious(0.03) | possibly_damaging(0.618) | TCGA-2W-A8YY-01 | Cervix | cervical & endocervical cancer | Female | <65 | I/II | Chemotherapy | cisplatin | CR |
| GBP1 | SNV | Missense_Mutation | c.1465A>G | p.Ile489Val | p.I489V | P32455 | protein_coding | tolerated(0.07) | benign(0.003) | TCGA-FU-A3HZ-01 | Cervix | cervical & endocervical cancer | Female | <65 | I/II | Chemotherapy | cisplatin | CR | |
| GBP1 | SNV | Missense_Mutation | c.1641G>C | p.Glu547Asp | p.E547D | P32455 | protein_coding | tolerated(0.13) | benign(0.037) | TCGA-Q1-A73O-01 | Cervix | cervical & endocervical cancer | Female | <65 | I/II | Chemotherapy | cisplatin | CR | |
| GBP1 | SNV | Missense_Mutation | novel | c.574G>A | p.Asp192Asn | p.D192N | P32455 | protein_coding | tolerated(0.52) | benign(0.031) | TCGA-Q1-A73O-01 | Cervix | cervical & endocervical cancer | Female | <65 | I/II | Chemotherapy | cisplatin | CR |
| GBP1 | SNV | Missense_Mutation | rs748915855 | c.1157C>T | p.Ala386Val | p.A386V | P32455 | protein_coding | tolerated(0.26) | benign(0.003) | TCGA-A6-2686-01 | Colorectum | colon adenocarcinoma | Female | >=65 | I/II | Unknown | Unknown | SD |
| GBP1 | SNV | Missense_Mutation | rs746630945 | c.127N>G | p.Ile43Val | p.I43V | P32455 | protein_coding | deleterious(0.02) | benign(0.344) | TCGA-A6-6780-01 | Colorectum | colon adenocarcinoma | Male | >=65 | I/II | Unknown | Unknown | SD |
| GBP1 | SNV | Missense_Mutation | c.1728N>G | p.Ile576Met | p.I576M | P32455 | protein_coding | tolerated(0.08) | benign(0.268) | TCGA-AA-3811-01 | Colorectum | colon adenocarcinoma | Female | >=65 | III/IV | Unknown | Unknown | PD | |
| GBP1 | SNV | Missense_Mutation | novel | c.1391N>G | p.Tyr464Cys | p.Y464C | P32455 | protein_coding | deleterious(0) | possibly_damaging(0.821) | TCGA-AA-3877-01 | Colorectum | colon adenocarcinoma | Female | >=65 | I/II | Unknown | Unknown | SD |
| Page: 1 2 3 4 5 6 7 |
Top |
Related drugs of malignant transformation related genes |
| Identification of chemicals and drugs interact with genes involved in malignant transfromation |
| (DGIdb 4.0) |
| Entrez ID | Symbol | Category | Interaction Types | Drug Claim Name | Drug Name | PMIDs |
| Page: 1 |

Copyright 2023-Present -The University of Texas Health Science Center at Houston |