
|
|||||
|
 | |
| |
| |
| |
| |
| |
|
Gene: CHCHD10 |
Gene summary for CHCHD10 |
| Gene information | Species | Human | Gene symbol | CHCHD10 | Gene ID | 400916 |
| Gene name | coiled-coil-helix-coiled-coil-helix domain containing 10 | |
| Gene Alias | C22orf16 | |
| Cytomap | 22q11.23 | |
| Gene Type | protein-coding | GO ID | GO:0000959 | UniProtAcc | B5MBW9 |
Top |
Malignant transformation analysis |
| Identification of the aberrant gene expression in precancerous and cancerous lesions by comparing the gene expression of stem-like cells in diseased tissues with normal stem cells |
| Entrez ID | Symbol | Replicates | Species | Organ | Tissue | Adj P-value | Log2FC | Malignancy |
| 400916 | CHCHD10 | CA_HPV_1 | Human | Cervix | CC | 9.81e-07 | 7.06e-02 | 0.0264 |
| 400916 | CHCHD10 | CCI_1 | Human | Cervix | CC | 2.17e-08 | -6.65e-01 | 0.528 |
| 400916 | CHCHD10 | CCI_3 | Human | Cervix | CC | 2.01e-06 | -5.70e-01 | 0.516 |
| 400916 | CHCHD10 | CCII_1 | Human | Cervix | CC | 2.75e-22 | -7.06e-01 | 0.3249 |
| 400916 | CHCHD10 | sample1 | Human | Cervix | CC | 5.48e-09 | 4.31e-01 | 0.0959 |
| 400916 | CHCHD10 | L1 | Human | Cervix | CC | 3.16e-11 | -4.45e-01 | 0.0802 |
| 400916 | CHCHD10 | T1 | Human | Cervix | CC | 9.13e-05 | 2.93e-01 | 0.0918 |
| 400916 | CHCHD10 | HTA11_2487_2000001011 | Human | Colorectum | SER | 5.86e-26 | 1.06e+00 | -0.1808 |
| 400916 | CHCHD10 | HTA11_1938_2000001011 | Human | Colorectum | AD | 2.49e-09 | 7.25e-01 | -0.0811 |
| 400916 | CHCHD10 | HTA11_78_2000001011 | Human | Colorectum | AD | 1.55e-06 | 4.68e-01 | -0.1088 |
| 400916 | CHCHD10 | HTA11_347_2000001011 | Human | Colorectum | AD | 9.05e-41 | 1.18e+00 | -0.1954 |
| 400916 | CHCHD10 | HTA11_411_2000001011 | Human | Colorectum | SER | 1.42e-07 | 1.07e+00 | -0.2602 |
| 400916 | CHCHD10 | HTA11_3361_2000001011 | Human | Colorectum | AD | 1.20e-23 | 1.07e+00 | -0.1207 |
| 400916 | CHCHD10 | HTA11_83_2000001011 | Human | Colorectum | SER | 2.91e-11 | 8.33e-01 | -0.1526 |
| 400916 | CHCHD10 | HTA11_696_2000001011 | Human | Colorectum | AD | 3.29e-38 | 9.67e-01 | -0.1464 |
| 400916 | CHCHD10 | HTA11_866_2000001011 | Human | Colorectum | AD | 6.06e-20 | 7.19e-01 | -0.1001 |
| 400916 | CHCHD10 | HTA11_1391_2000001011 | Human | Colorectum | AD | 2.04e-16 | 8.04e-01 | -0.059 |
| 400916 | CHCHD10 | HTA11_2992_2000001011 | Human | Colorectum | SER | 3.21e-10 | 9.43e-01 | -0.1706 |
| 400916 | CHCHD10 | HTA11_5212_2000001011 | Human | Colorectum | AD | 9.91e-07 | 8.30e-01 | -0.2061 |
| 400916 | CHCHD10 | HTA11_5216_2000001011 | Human | Colorectum | SER | 3.52e-03 | 6.91e-01 | -0.1462 |
| Page: 1 2 3 4 5 6 7 8 9 10 11 12 |
| Tissue | Expression Dynamics | Abbreviation |
| Cervix | 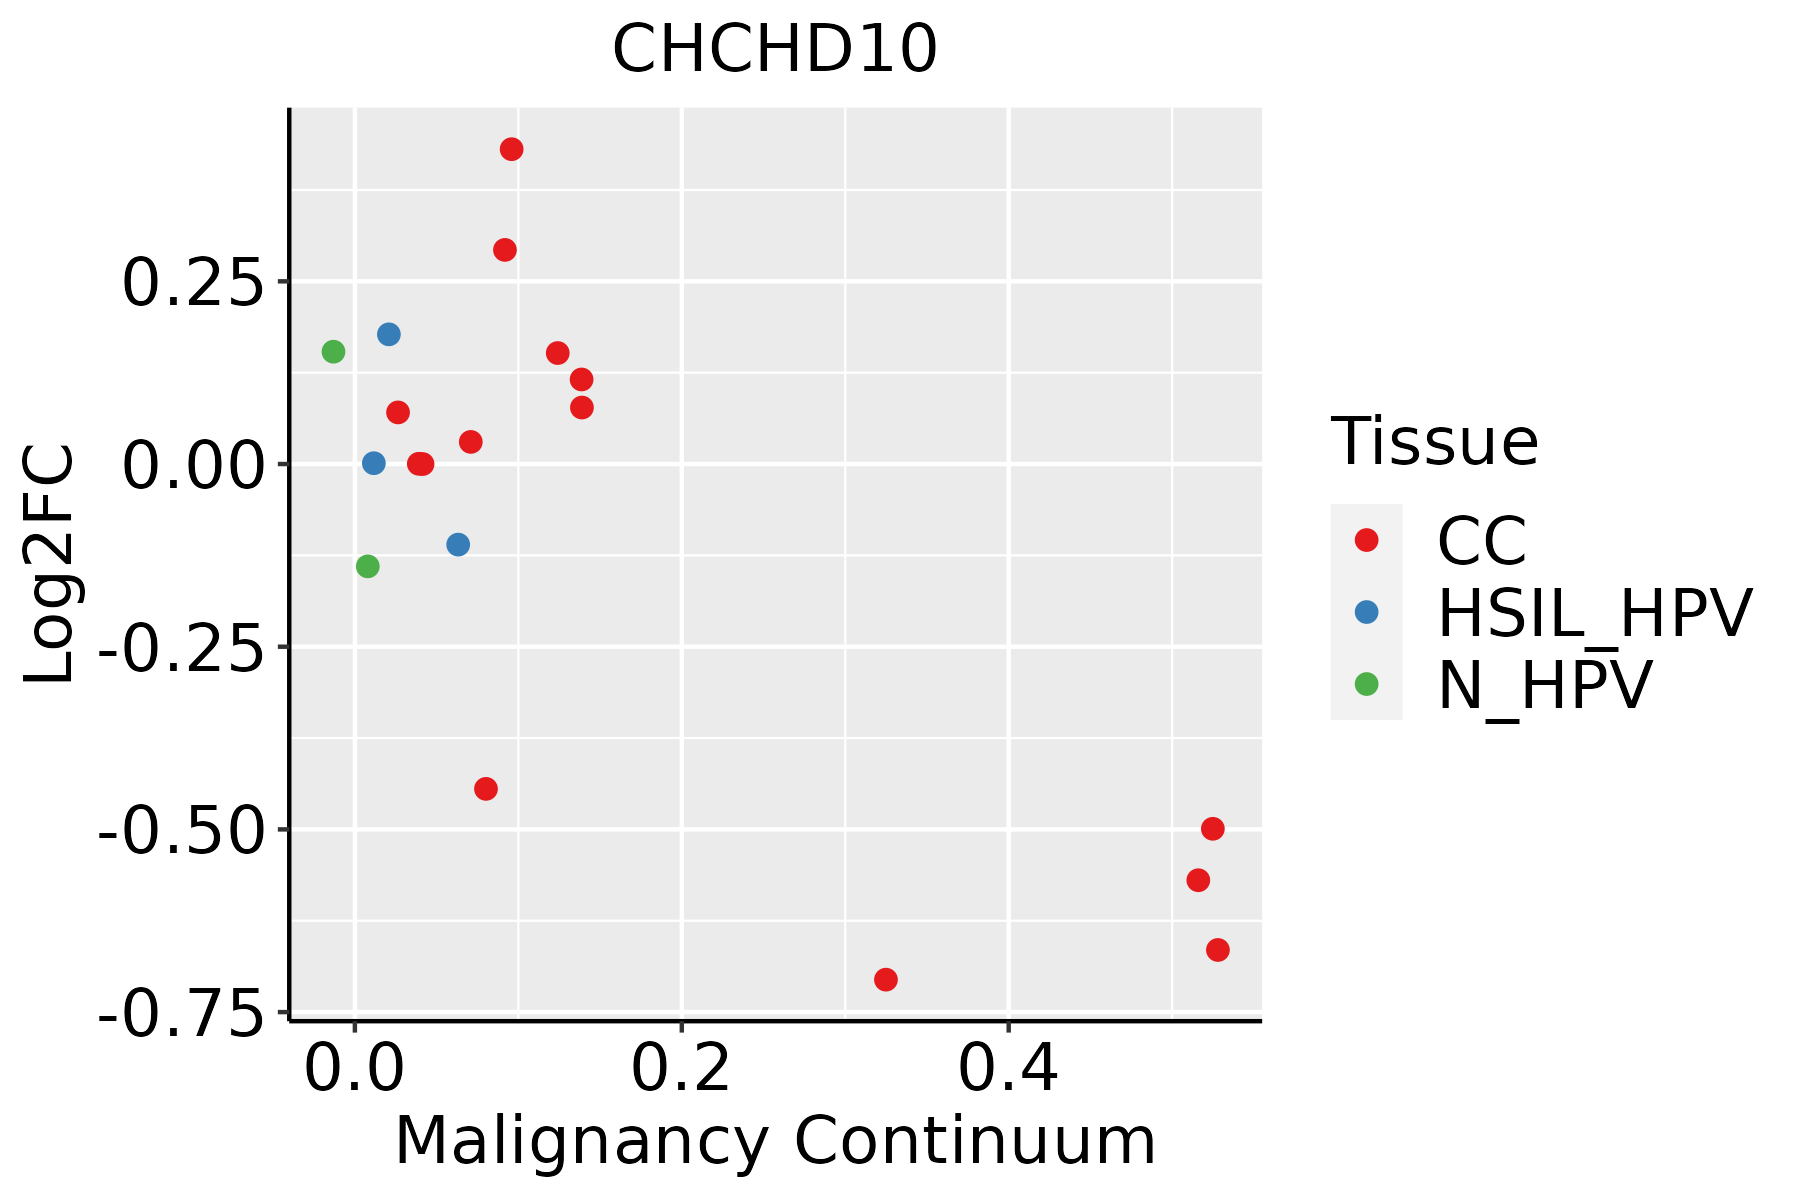 | CC: Cervix cancer |
| HSIL_HPV: HPV-infected high-grade squamous intraepithelial lesions | ||
| N_HPV: HPV-infected normal cervix | ||
| Colorectum (GSE201348) |  | FAP: Familial adenomatous polyposis |
| CRC: Colorectal cancer | ||
| Colorectum (HTA11) | 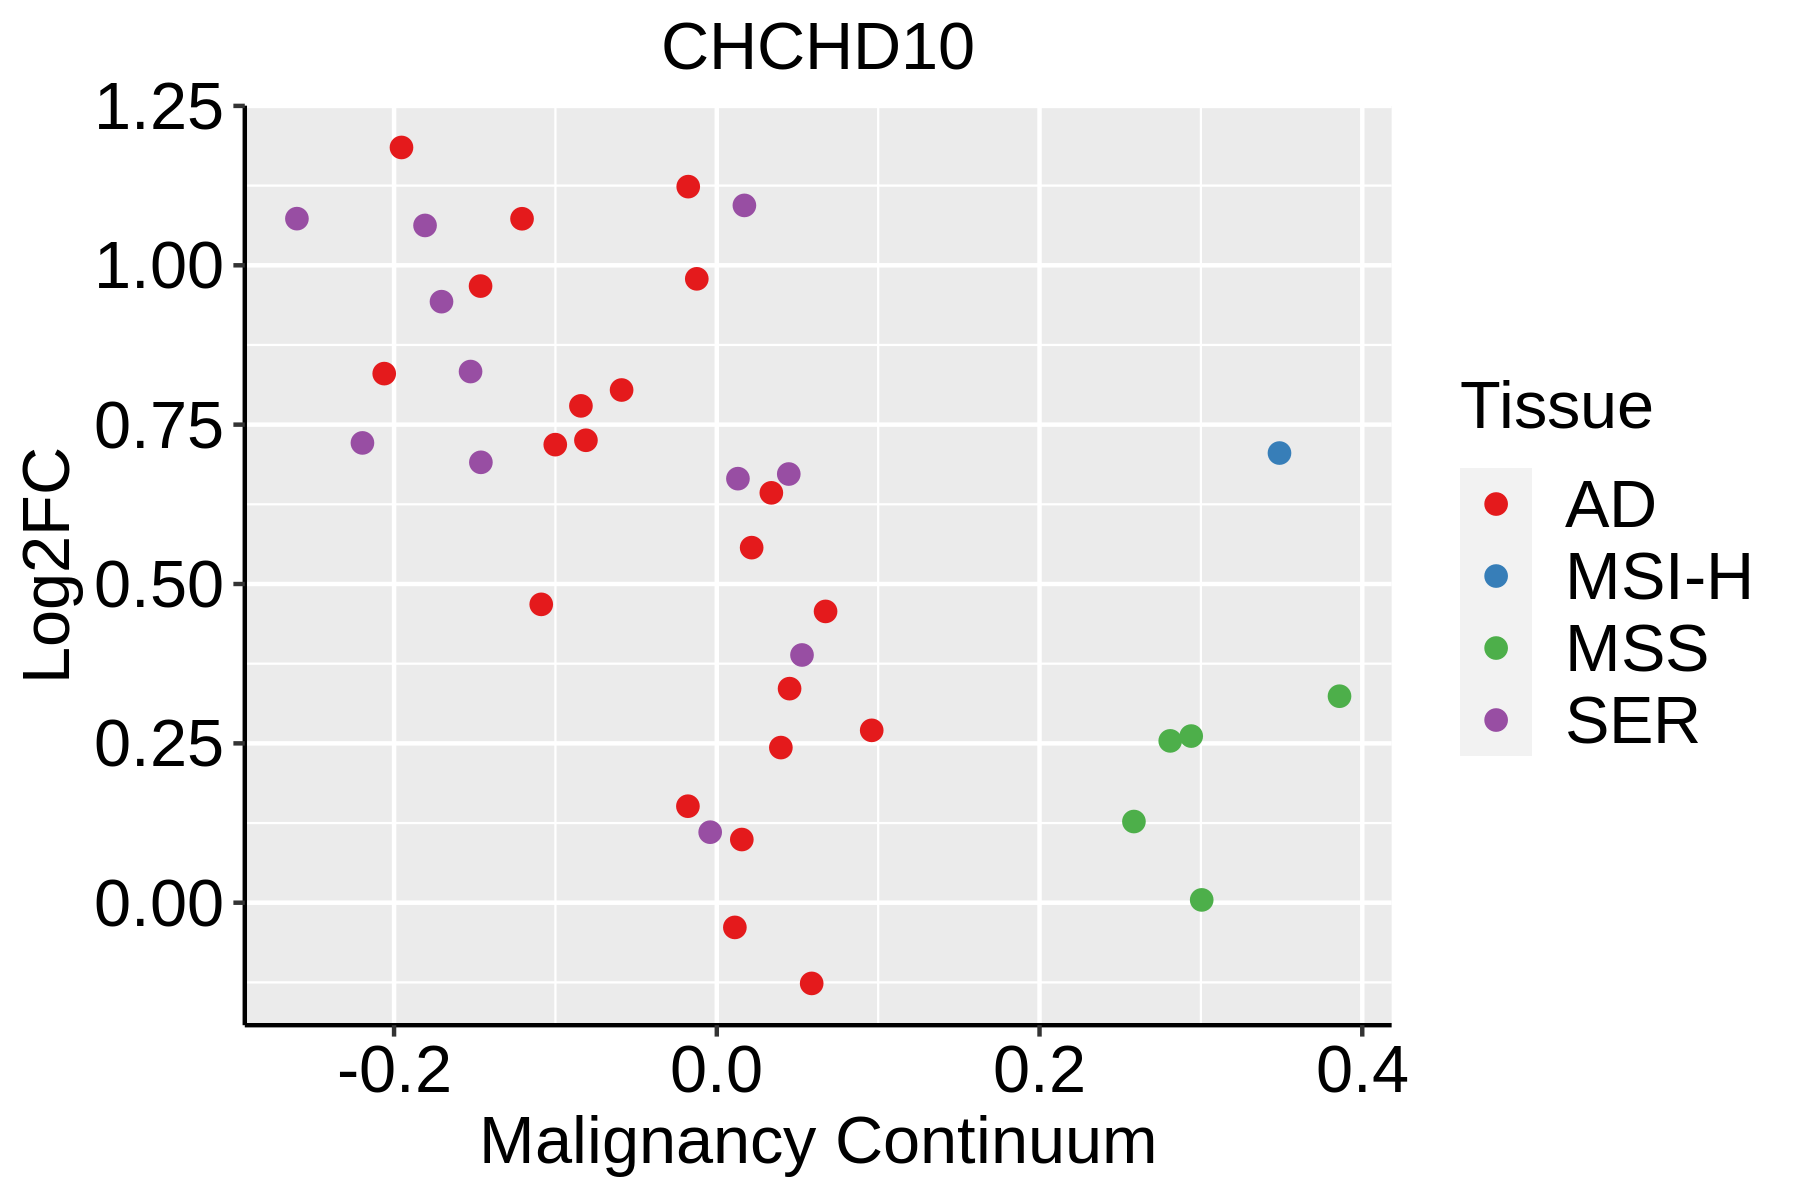 | AD: Adenomas |
| SER: Sessile serrated lesions | ||
| MSI-H: Microsatellite-high colorectal cancer | ||
| MSS: Microsatellite stable colorectal cancer | ||
| Endometrium | 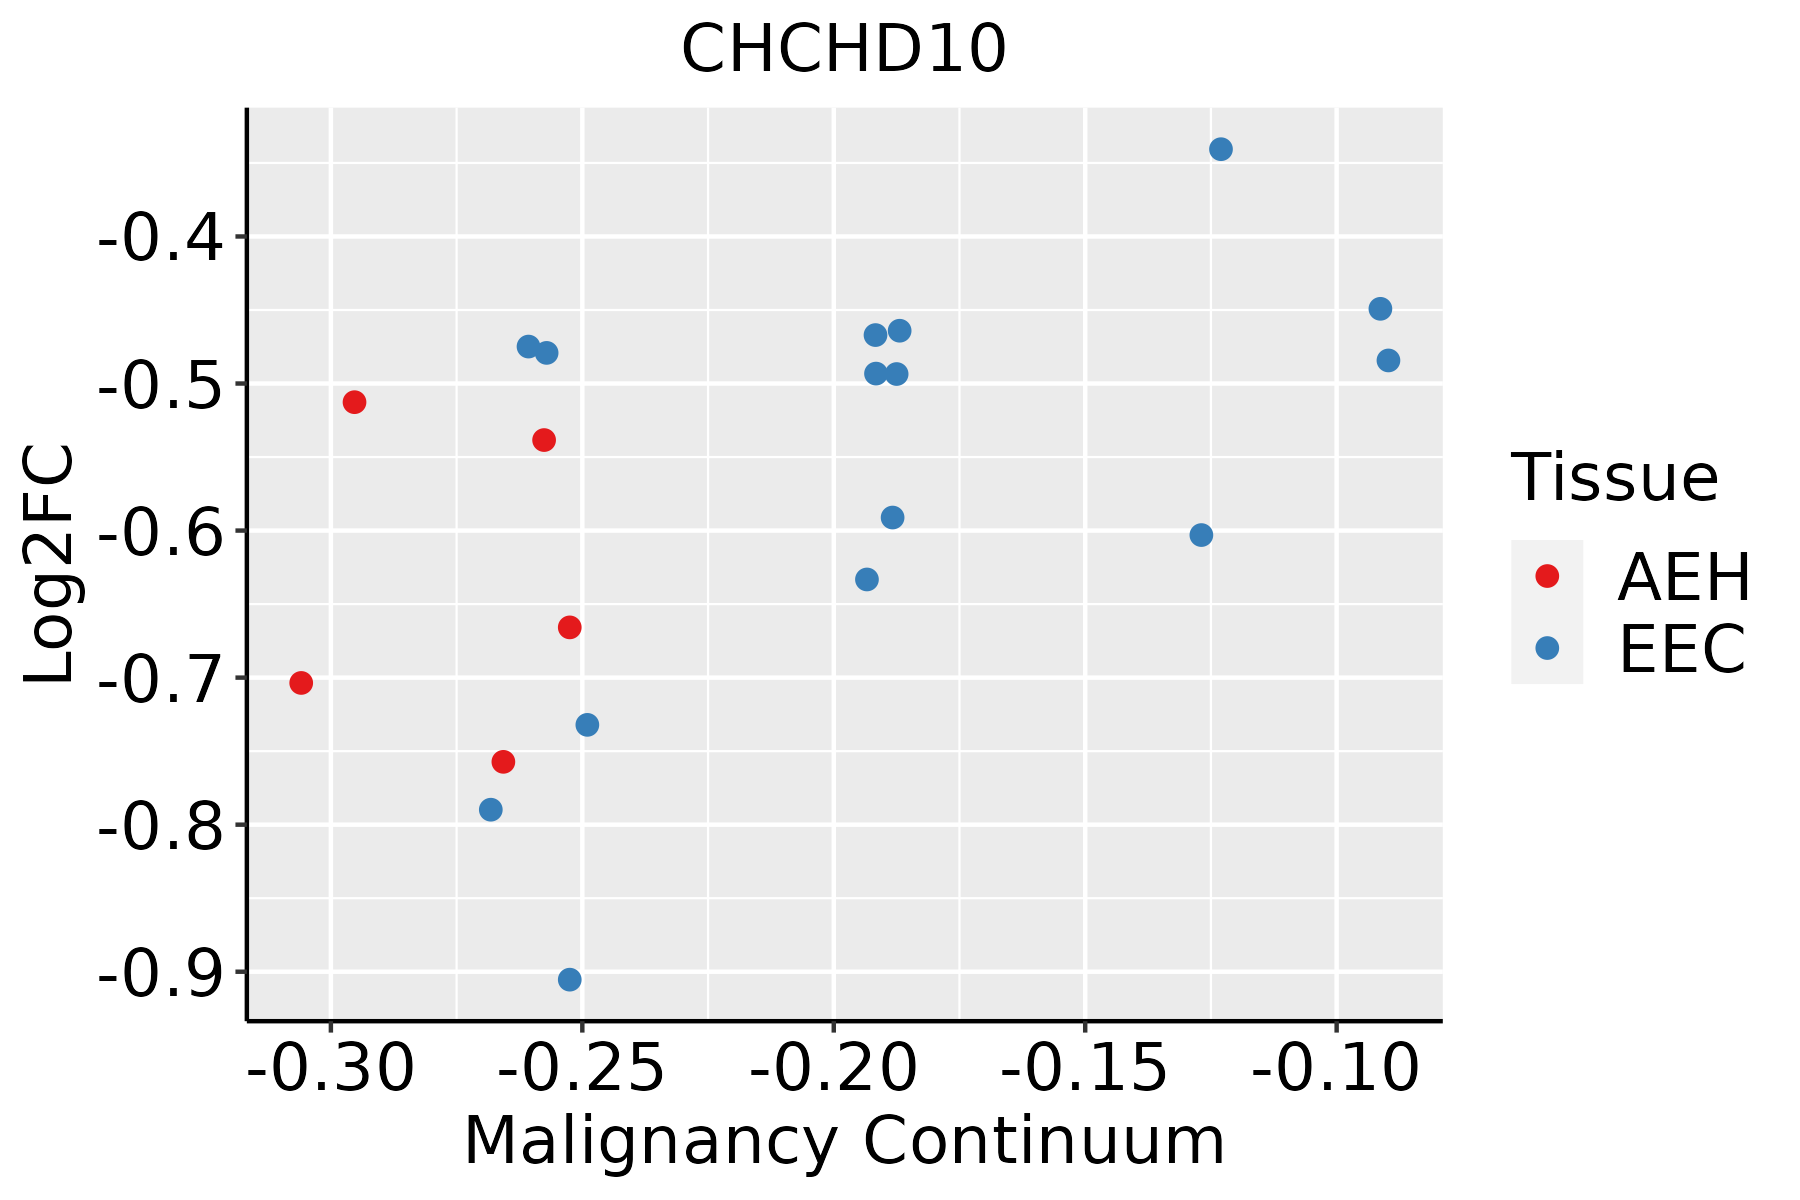 | AEH: Atypical endometrial hyperplasia |
| EEC: Endometrioid Cancer | ||
| Esophagus | 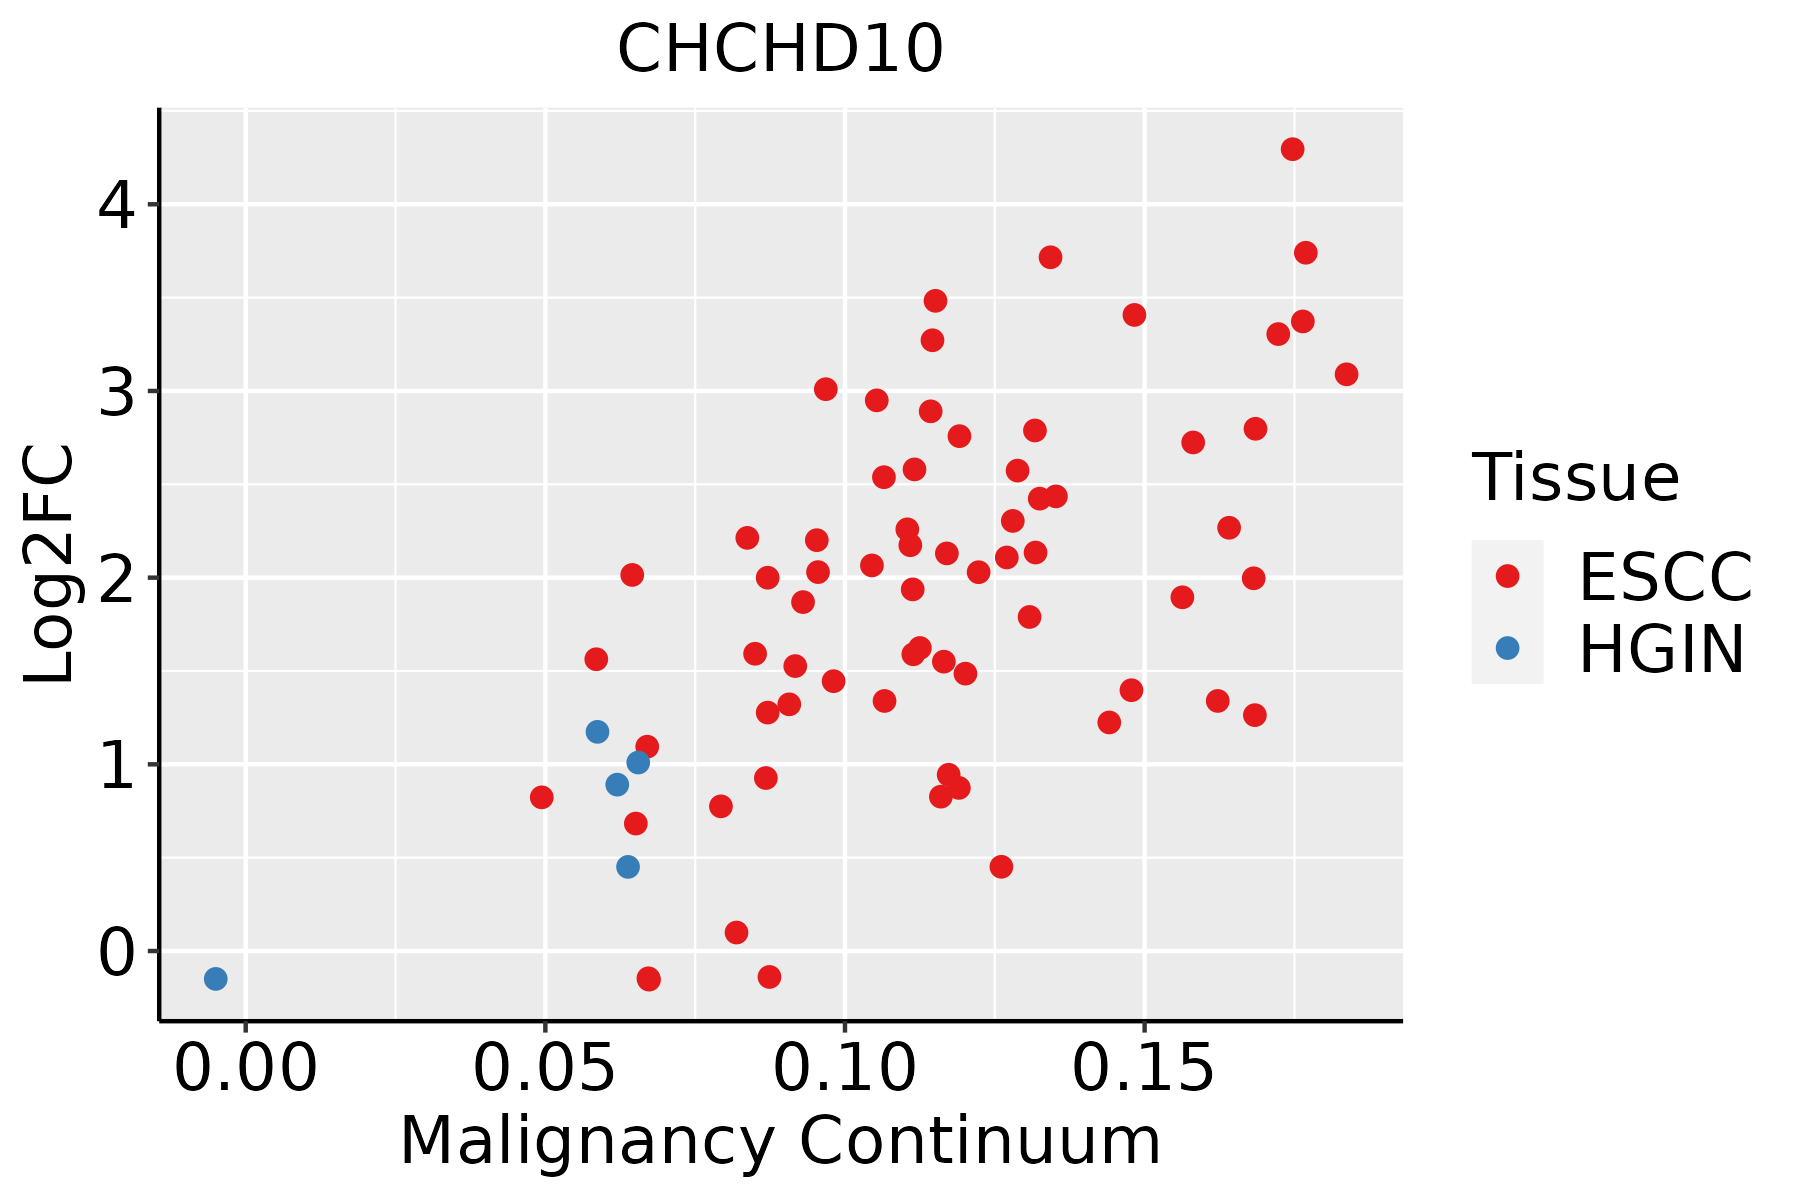 | ESCC: Esophageal squamous cell carcinoma |
| HGIN: High-grade intraepithelial neoplasias | ||
| LGIN: Low-grade intraepithelial neoplasias | ||
| GC |  | CAG: Chronic atrophic gastritis |
| CAG with IM: Chronic atrophic gastritis with intestinal metaplasia | ||
| CSG: Chronic superficial gastritis | ||
| GC: Gastric cancer | ||
| SIM: Severe intestinal metaplasia | ||
| WIM: Wild intestinal metaplasia | ||
| Liver | 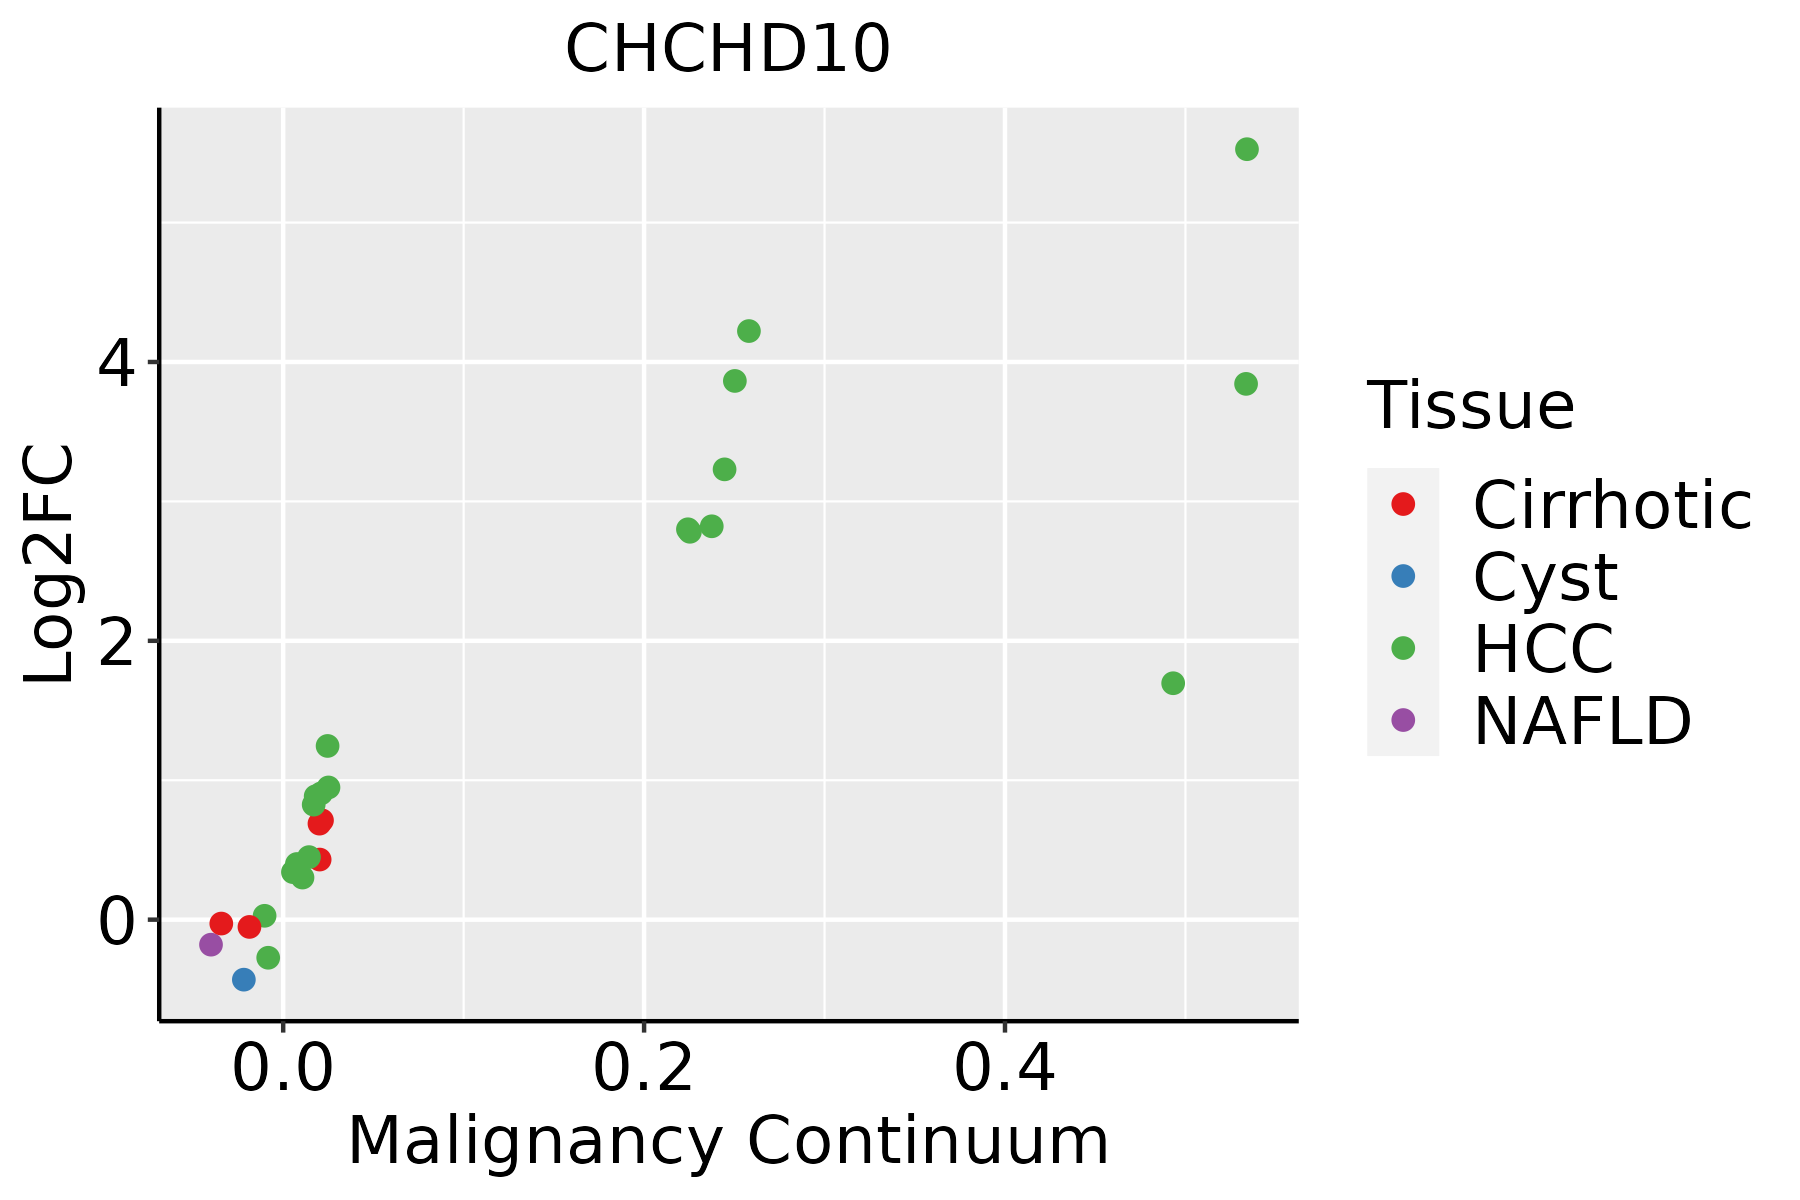 | HCC: Hepatocellular carcinoma |
| NAFLD: Non-alcoholic fatty liver disease | ||
| Oral Cavity |  | EOLP: Erosive Oral lichen planus |
| LP: leukoplakia | ||
| NEOLP: Non-erosive oral lichen planus | ||
| OSCC: Oral squamous cell carcinoma | ||
| Prostate |  | BPH: Benign Prostatic Hyperplasia |
| Skin | 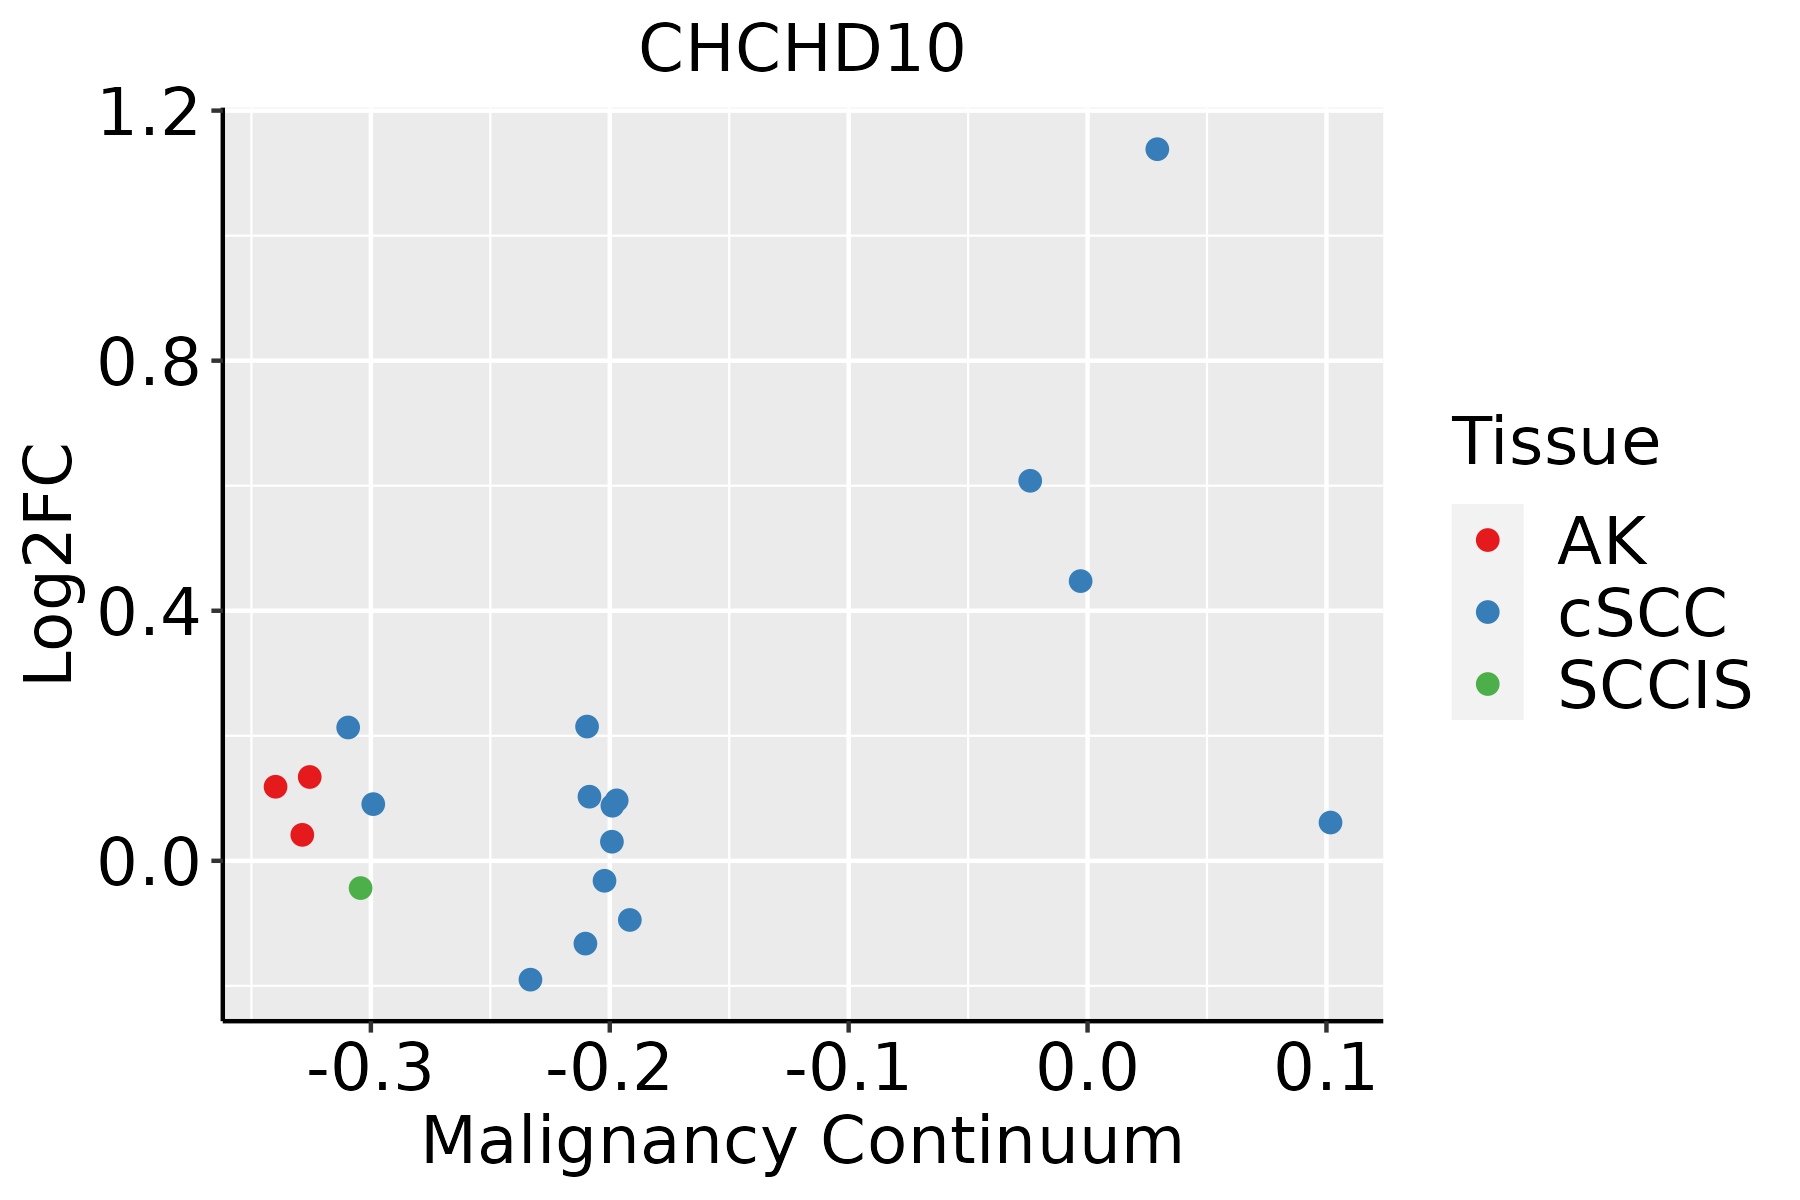 | AK: Actinic keratosis |
| cSCC: Cutaneous squamous cell carcinoma | ||
| SCCIS:squamous cell carcinoma in situ | ||
| Thyroid |  | ATC: Anaplastic thyroid cancer |
| HT: Hashimoto's thyroiditis | ||
| PTC: Papillary thyroid cancer |
| ∗log2FC in expression of this searched gene in stem-like cells from each diseased tissue sample relative to stem-like cells in normal samples in each tissue plotted against the malignancy continuum. Samples are colored based on if they are from different disease stage. |
Top |
Malignant transformation related pathway analysis |
| Find out the enriched GO biological processes and KEGG pathways involved in transition from healthy to precancer to cancer |
| Tissue | Disease Stage | Enriched GO biological Processes |
| Colorectum | AD |  |
| Colorectum | SER |  |
| Colorectum | MSS |  |
| Colorectum | MSI-H |  |
| Colorectum | FAP |  |
| ∗Top 15 enriched GO BP terms are showed in the bar plot of each disease state in each tissue. Each row represents a significant GO biological process which is colored according to the -log10(p.adjust). |
| Page: 1 2 3 4 5 6 7 8 9 |
| GO ID | Tissue | Disease Stage | Description | Gene Ratio | Bg Ratio | pvalue | p.adjust | Count |
| GO:19026863 | Stomach | CAG | mitochondrial outer membrane permeabilization involved in programmed cell death | 5/552 | 40/18723 | 6.14e-03 | 4.88e-02 | 5 |
| GO:004603451 | Stomach | SIM | ATP metabolic process | 48/708 | 277/18723 | 6.21e-19 | 1.46e-15 | 48 |
| GO:00061195 | Stomach | SIM | oxidative phosphorylation | 31/708 | 141/18723 | 1.21e-15 | 7.15e-13 | 31 |
| GO:000609151 | Stomach | SIM | generation of precursor metabolites and energy | 58/708 | 490/18723 | 1.10e-14 | 5.18e-12 | 58 |
| GO:00090605 | Stomach | SIM | aerobic respiration | 32/708 | 189/18723 | 9.30e-13 | 3.37e-10 | 32 |
| GO:00453335 | Stomach | SIM | cellular respiration | 34/708 | 230/18723 | 9.47e-12 | 3.19e-09 | 34 |
| GO:00159805 | Stomach | SIM | energy derivation by oxidation of organic compounds | 40/708 | 318/18723 | 2.55e-11 | 7.53e-09 | 40 |
| GO:00086375 | Stomach | SIM | apoptotic mitochondrial changes | 18/708 | 107/18723 | 1.00e-07 | 8.64e-06 | 18 |
| GO:00512355 | Stomach | SIM | maintenance of location | 29/708 | 327/18723 | 2.01e-05 | 6.37e-04 | 29 |
| GO:00108214 | Stomach | SIM | regulation of mitochondrion organization | 16/708 | 144/18723 | 1.13e-04 | 2.68e-03 | 16 |
| GO:00516515 | Stomach | SIM | maintenance of location in cell | 20/708 | 214/18723 | 1.88e-04 | 3.97e-03 | 20 |
| GO:00068395 | Stomach | SIM | mitochondrial transport | 22/708 | 254/18723 | 2.74e-04 | 5.21e-03 | 22 |
| GO:00451855 | Stomach | SIM | maintenance of protein location | 11/708 | 94/18723 | 8.33e-04 | 1.14e-02 | 11 |
| GO:003250721 | Stomach | SIM | maintenance of protein location in cell | 8/708 | 65/18723 | 3.03e-03 | 2.92e-02 | 8 |
| GO:000700631 | Stomach | SIM | mitochondrial membrane organization | 11/708 | 116/18723 | 4.50e-03 | 3.94e-02 | 11 |
| GO:00725952 | Stomach | SIM | maintenance of protein localization in organelle | 6/708 | 42/18723 | 4.70e-03 | 4.08e-02 | 6 |
| GO:0009060112 | Thyroid | PTC | aerobic respiration | 126/5968 | 189/18723 | 7.07e-23 | 1.78e-20 | 126 |
| GO:0046034113 | Thyroid | PTC | ATP metabolic process | 167/5968 | 277/18723 | 1.18e-22 | 2.66e-20 | 167 |
| GO:0034504111 | Thyroid | PTC | protein localization to nucleus | 170/5968 | 290/18723 | 3.34e-21 | 6.38e-19 | 170 |
| GO:0006091112 | Thyroid | PTC | generation of precursor metabolites and energy | 252/5968 | 490/18723 | 8.24e-20 | 1.13e-17 | 252 |
| Page: 1 2 3 4 5 6 7 8 9 10 11 12 13 14 15 16 17 18 19 20 21 22 23 24 25 26 27 28 29 30 31 |
| Pathway ID | Tissue | Disease Stage | Description | Gene Ratio | Bg Ratio | pvalue | p.adjust | qvalue | Count |
| hsa0501418 | Cervix | CC | Amyotrophic lateral sclerosis | 103/1267 | 364/8465 | 1.79e-11 | 4.47e-10 | 2.64e-10 | 103 |
| hsa0501419 | Cervix | CC | Amyotrophic lateral sclerosis | 103/1267 | 364/8465 | 1.79e-11 | 4.47e-10 | 2.64e-10 | 103 |
| hsa05014 | Colorectum | AD | Amyotrophic lateral sclerosis | 164/2092 | 364/8465 | 4.28e-18 | 1.27e-16 | 8.09e-17 | 164 |
| hsa050141 | Colorectum | AD | Amyotrophic lateral sclerosis | 164/2092 | 364/8465 | 4.28e-18 | 1.27e-16 | 8.09e-17 | 164 |
| hsa050142 | Colorectum | SER | Amyotrophic lateral sclerosis | 138/1580 | 364/8465 | 9.89e-19 | 2.99e-17 | 2.17e-17 | 138 |
| hsa050143 | Colorectum | SER | Amyotrophic lateral sclerosis | 138/1580 | 364/8465 | 9.89e-19 | 2.99e-17 | 2.17e-17 | 138 |
| hsa050144 | Colorectum | MSS | Amyotrophic lateral sclerosis | 156/1875 | 364/8465 | 1.43e-19 | 4.62e-18 | 2.83e-18 | 156 |
| hsa050145 | Colorectum | MSS | Amyotrophic lateral sclerosis | 156/1875 | 364/8465 | 1.43e-19 | 4.62e-18 | 2.83e-18 | 156 |
| hsa050148 | Colorectum | FAP | Amyotrophic lateral sclerosis | 91/1404 | 364/8465 | 1.84e-05 | 2.36e-04 | 1.44e-04 | 91 |
| hsa050149 | Colorectum | FAP | Amyotrophic lateral sclerosis | 91/1404 | 364/8465 | 1.84e-05 | 2.36e-04 | 1.44e-04 | 91 |
| hsa0501420 | Endometrium | AEH | Amyotrophic lateral sclerosis | 123/1197 | 364/8465 | 2.17e-22 | 7.82e-21 | 5.72e-21 | 123 |
| hsa05014110 | Endometrium | AEH | Amyotrophic lateral sclerosis | 123/1197 | 364/8465 | 2.17e-22 | 7.82e-21 | 5.72e-21 | 123 |
| hsa0501425 | Endometrium | EEC | Amyotrophic lateral sclerosis | 128/1237 | 364/8465 | 9.83e-24 | 4.04e-22 | 3.01e-22 | 128 |
| hsa0501435 | Endometrium | EEC | Amyotrophic lateral sclerosis | 128/1237 | 364/8465 | 9.83e-24 | 4.04e-22 | 3.01e-22 | 128 |
| hsa0501430 | Esophagus | HGIN | Amyotrophic lateral sclerosis | 140/1383 | 364/8465 | 2.13e-25 | 1.16e-23 | 9.19e-24 | 140 |
| hsa05014113 | Esophagus | HGIN | Amyotrophic lateral sclerosis | 140/1383 | 364/8465 | 2.13e-25 | 1.16e-23 | 9.19e-24 | 140 |
| hsa05014210 | Esophagus | ESCC | Amyotrophic lateral sclerosis | 266/4205 | 364/8465 | 1.31e-20 | 2.20e-18 | 1.13e-18 | 266 |
| hsa0501438 | Esophagus | ESCC | Amyotrophic lateral sclerosis | 266/4205 | 364/8465 | 1.31e-20 | 2.20e-18 | 1.13e-18 | 266 |
| hsa0501414 | Liver | Cirrhotic | Amyotrophic lateral sclerosis | 187/2530 | 364/8465 | 1.56e-18 | 6.50e-17 | 4.01e-17 | 187 |
| hsa0501415 | Liver | Cirrhotic | Amyotrophic lateral sclerosis | 187/2530 | 364/8465 | 1.56e-18 | 6.50e-17 | 4.01e-17 | 187 |
| Page: 1 2 3 |
Top |
Cell-cell communication analysis |
| Identification of potential cell-cell interactions between two cell types and their ligand-receptor pairs for different disease states |
| Ligand | Receptor | LRpair | Pathway | Tissue | Disease Stage |
| Page: 1 |
Top |
Single-cell gene regulatory network inference analysis |
| Find out the significant the regulons (TFs) and the target genes of each regulon across cell types for different disease states |
| TF | Cell Type | Tissue | Disease Stage | Target Gene | RSS | Regulon Activity |
| ∗The dot plots of a searched regulon are shown for all cell subpopulations in each disease state of each tissue based on the regulon specific score inferred using pySCENIC and by calculating the average expression. |
| Page: 1 |
Top |
Somatic mutation of malignant transformation related genes |
| Annotation of somatic variants for genes involved in malignant transformation |
| Hugo Symbol | Variant Class | Variant Classification | dbSNP RS | HGVSc | HGVSp | HGVSp Short | SWISSPROT | BIOTYPE | SIFT | PolyPhen | Tumor Sample Barcode | Tissue | Histology | Sex | Age | Stage | Therapy Types | Drugs | Outcome |
| CHCHD10 | SNV | Missense_Mutation | rs562212051 | c.328N>A | p.Ala110Thr | p.A110T | protein_coding | tolerated(0.41) | benign(0.307) | TCGA-AO-A128-01 | Breast | breast invasive carcinoma | Female | <65 | I/II | Chemotherapy | doxorubicin | SD | |
| CHCHD10 | SNV | Missense_Mutation | novel | c.402N>T | p.Glu134Asp | p.E134D | protein_coding | deleterious(0.04) | probably_damaging(0.994) | TCGA-A5-A0G1-01 | Endometrium | uterine corpus endometrioid carcinoma | Female | >=65 | I/II | Unknown | Unknown | SD | |
| CHCHD10 | SNV | Missense_Mutation | novel | c.173N>T | p.Gly58Val | p.G58V | protein_coding | deleterious(0) | probably_damaging(0.999) | TCGA-DD-AACI-01 | Liver | liver hepatocellular carcinoma | Male | >=65 | I/II | Unknown | Unknown | PD | |
| CHCHD10 | SNV | Missense_Mutation | c.427N>A | p.His143Asn | p.H143N | protein_coding | tolerated(1) | benign(0.003) | TCGA-66-2734-01 | Lung | lung squamous cell carcinoma | Female | <65 | I/II | Unknown | Unknown | SD |
| Page: 1 |
Top |
Related drugs of malignant transformation related genes |
| Identification of chemicals and drugs interact with genes involved in malignant transfromation |
| (DGIdb 4.0) |
| Entrez ID | Symbol | Category | Interaction Types | Drug Claim Name | Drug Name | PMIDs |
| Page: 1 |

Copyright 2023-Present -The University of Texas Health Science Center at Houston |