| Tissue | Expression Dynamics | Abbreviation |
| Breast | 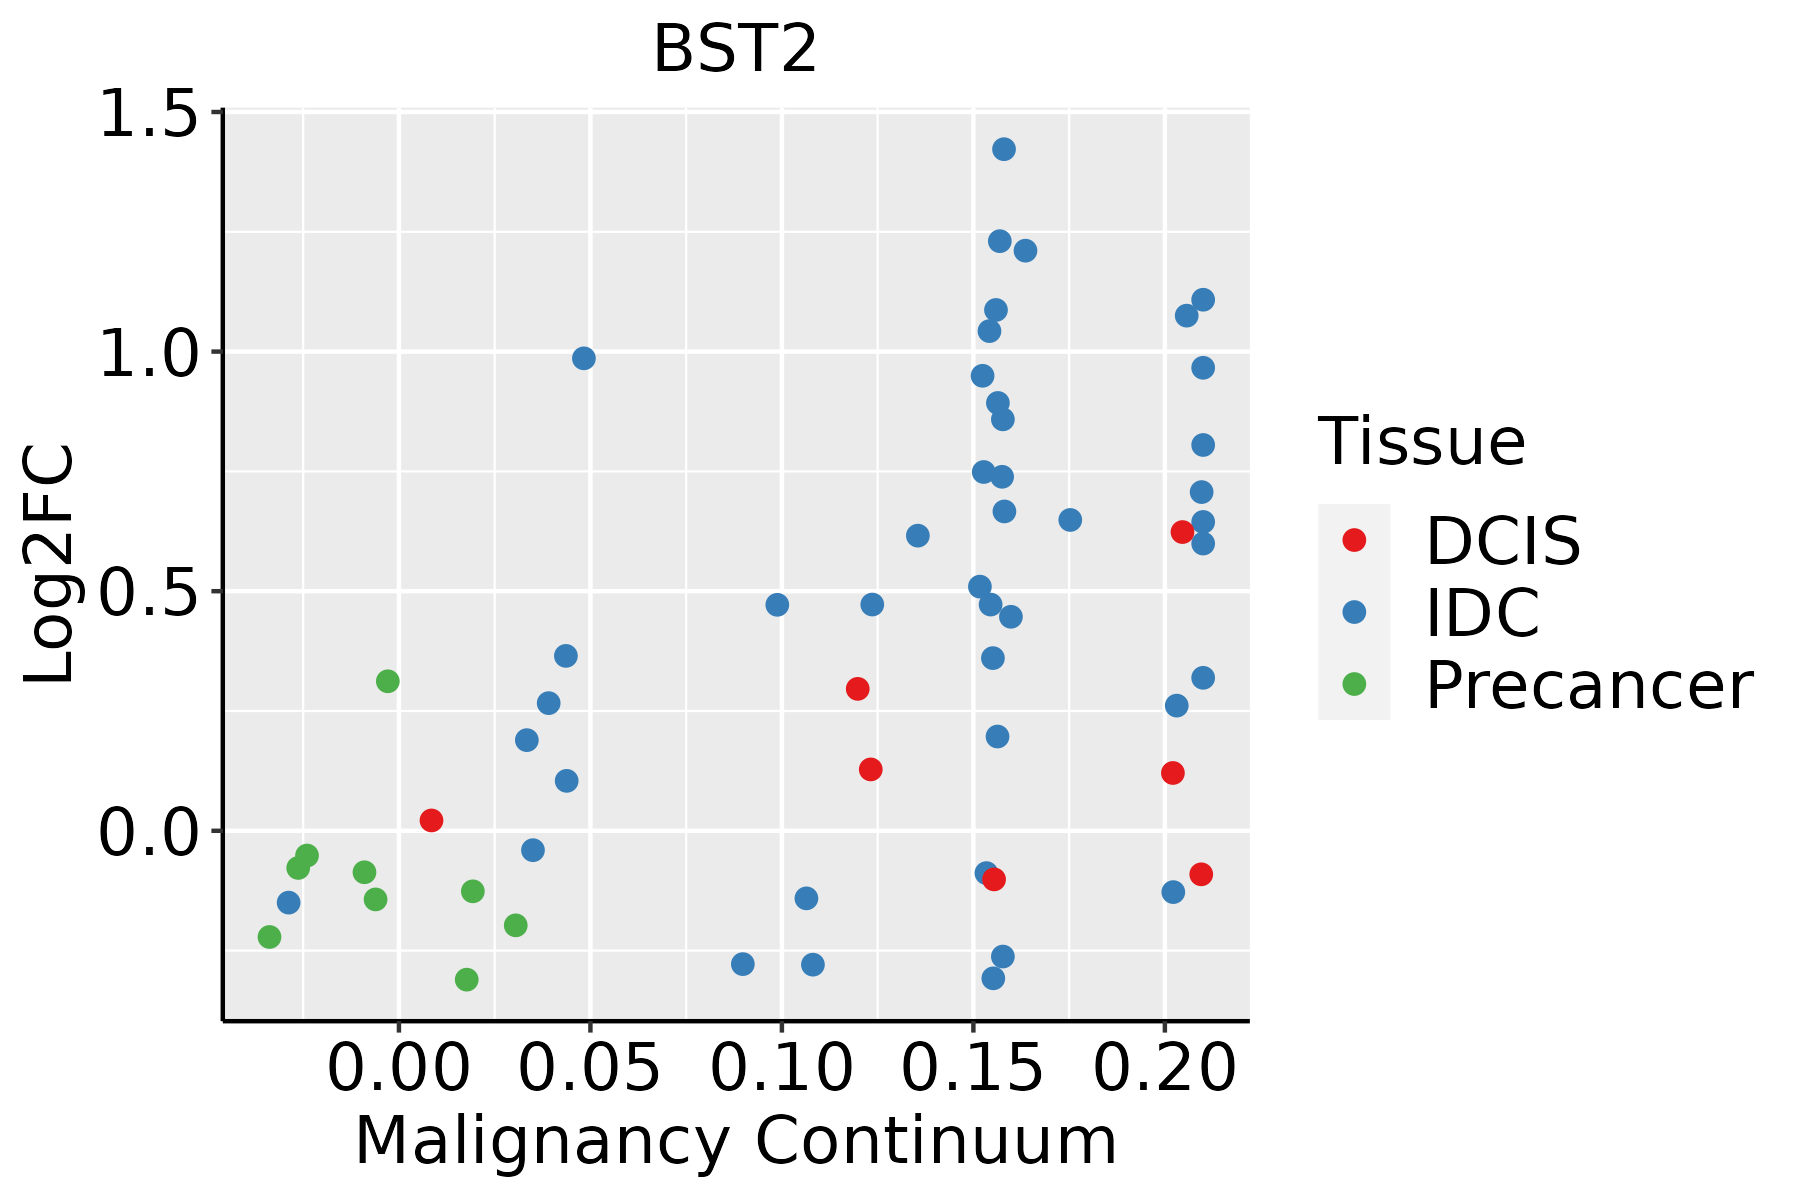 | IDC: Invasive ductal carcinoma |
| DCIS: Ductal carcinoma in situ |
| Precancer(BRCA1-mut): Precancerous lesion from BRCA1 mutation carriers |
| Cervix |  | CC: Cervix cancer |
| HSIL_HPV: HPV-infected high-grade squamous intraepithelial lesions |
| N_HPV: HPV-infected normal cervix |
| Colorectum (GSE201348) |  | FAP: Familial adenomatous polyposis |
| CRC: Colorectal cancer |
| Colorectum (HTA11) |  | AD: Adenomas |
| SER: Sessile serrated lesions |
| MSI-H: Microsatellite-high colorectal cancer |
| MSS: Microsatellite stable colorectal cancer |
| Endometrium |  | AEH: Atypical endometrial hyperplasia |
| EEC: Endometrioid Cancer |
| Esophagus |  | ESCC: Esophageal squamous cell carcinoma |
| HGIN: High-grade intraepithelial neoplasias |
| LGIN: Low-grade intraepithelial neoplasias |
| GC | 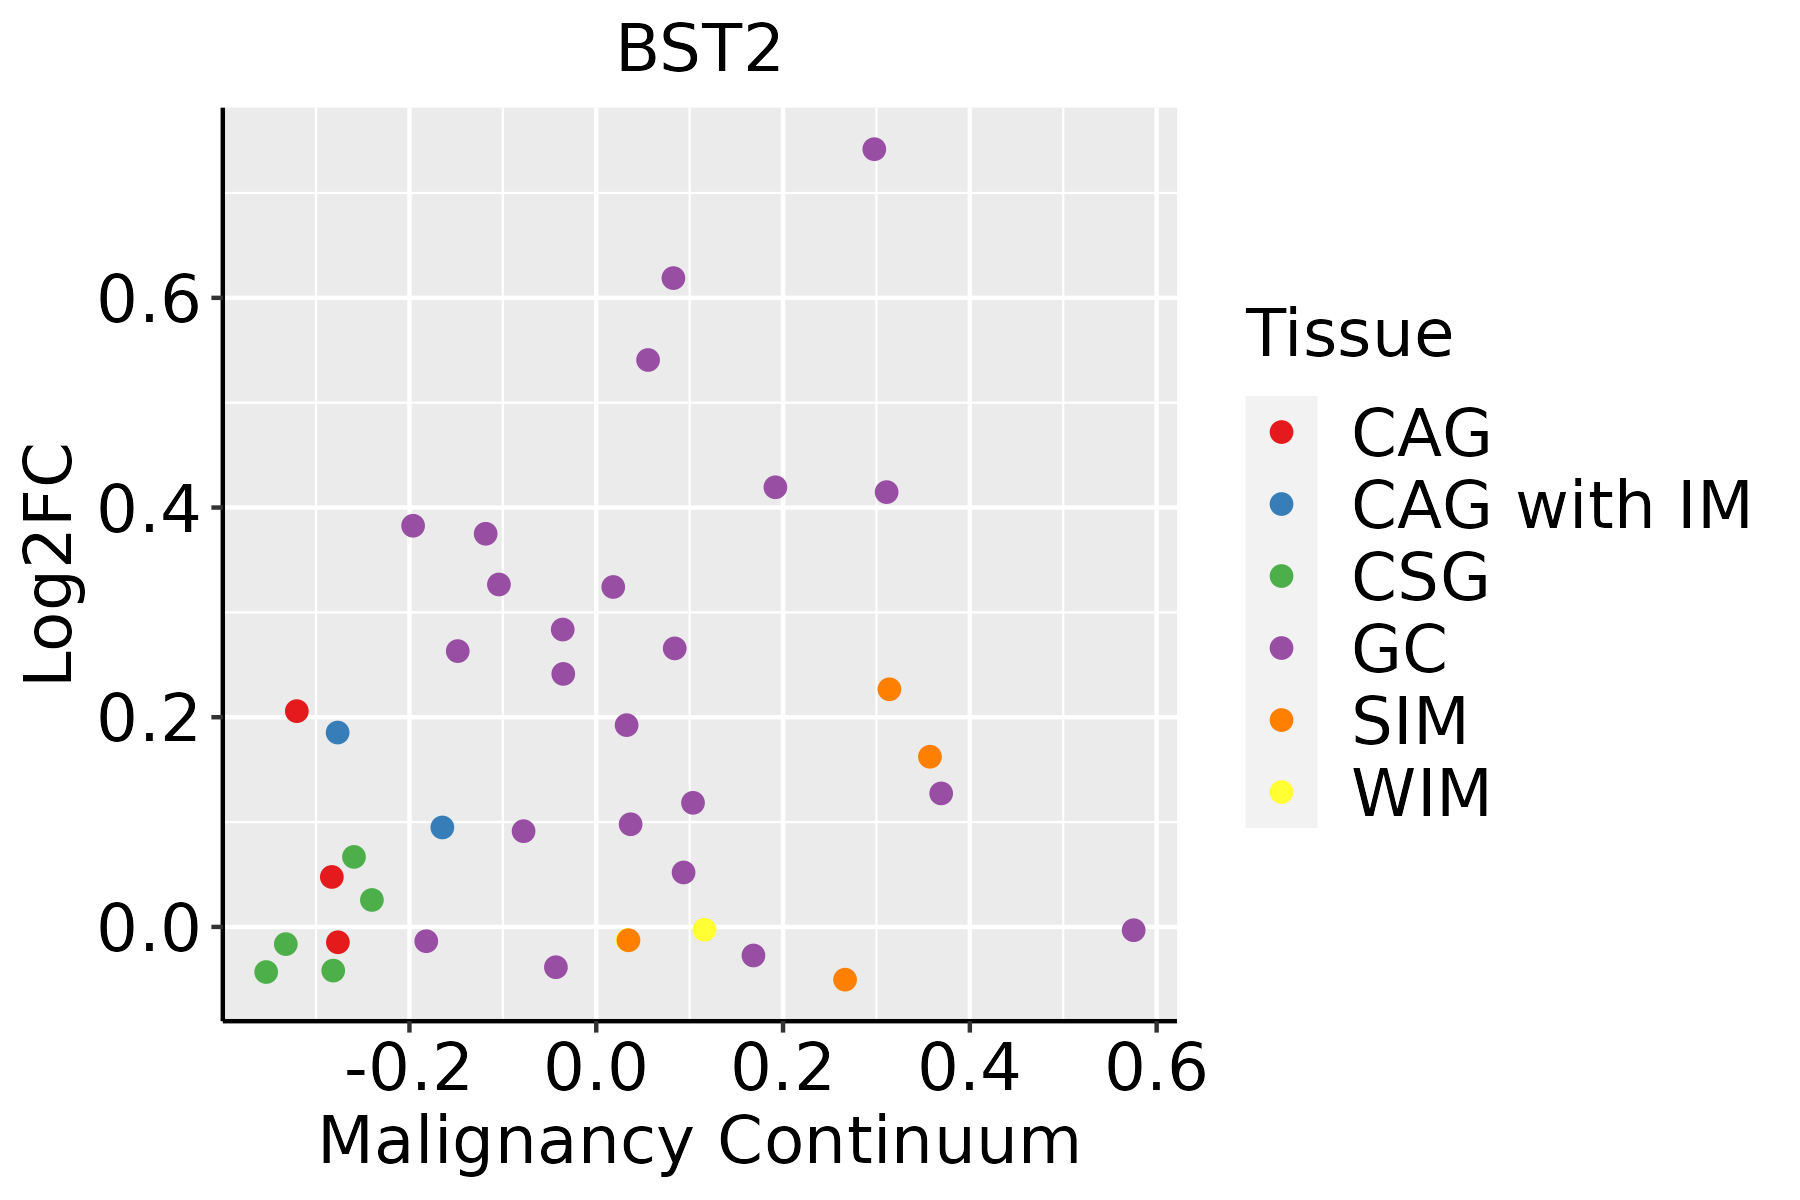 | CAG: Chronic atrophic gastritis |
| CAG with IM: Chronic atrophic gastritis with intestinal metaplasia |
| CSG: Chronic superficial gastritis |
| GC: Gastric cancer |
| SIM: Severe intestinal metaplasia |
| WIM: Wild intestinal metaplasia |
| Liver | 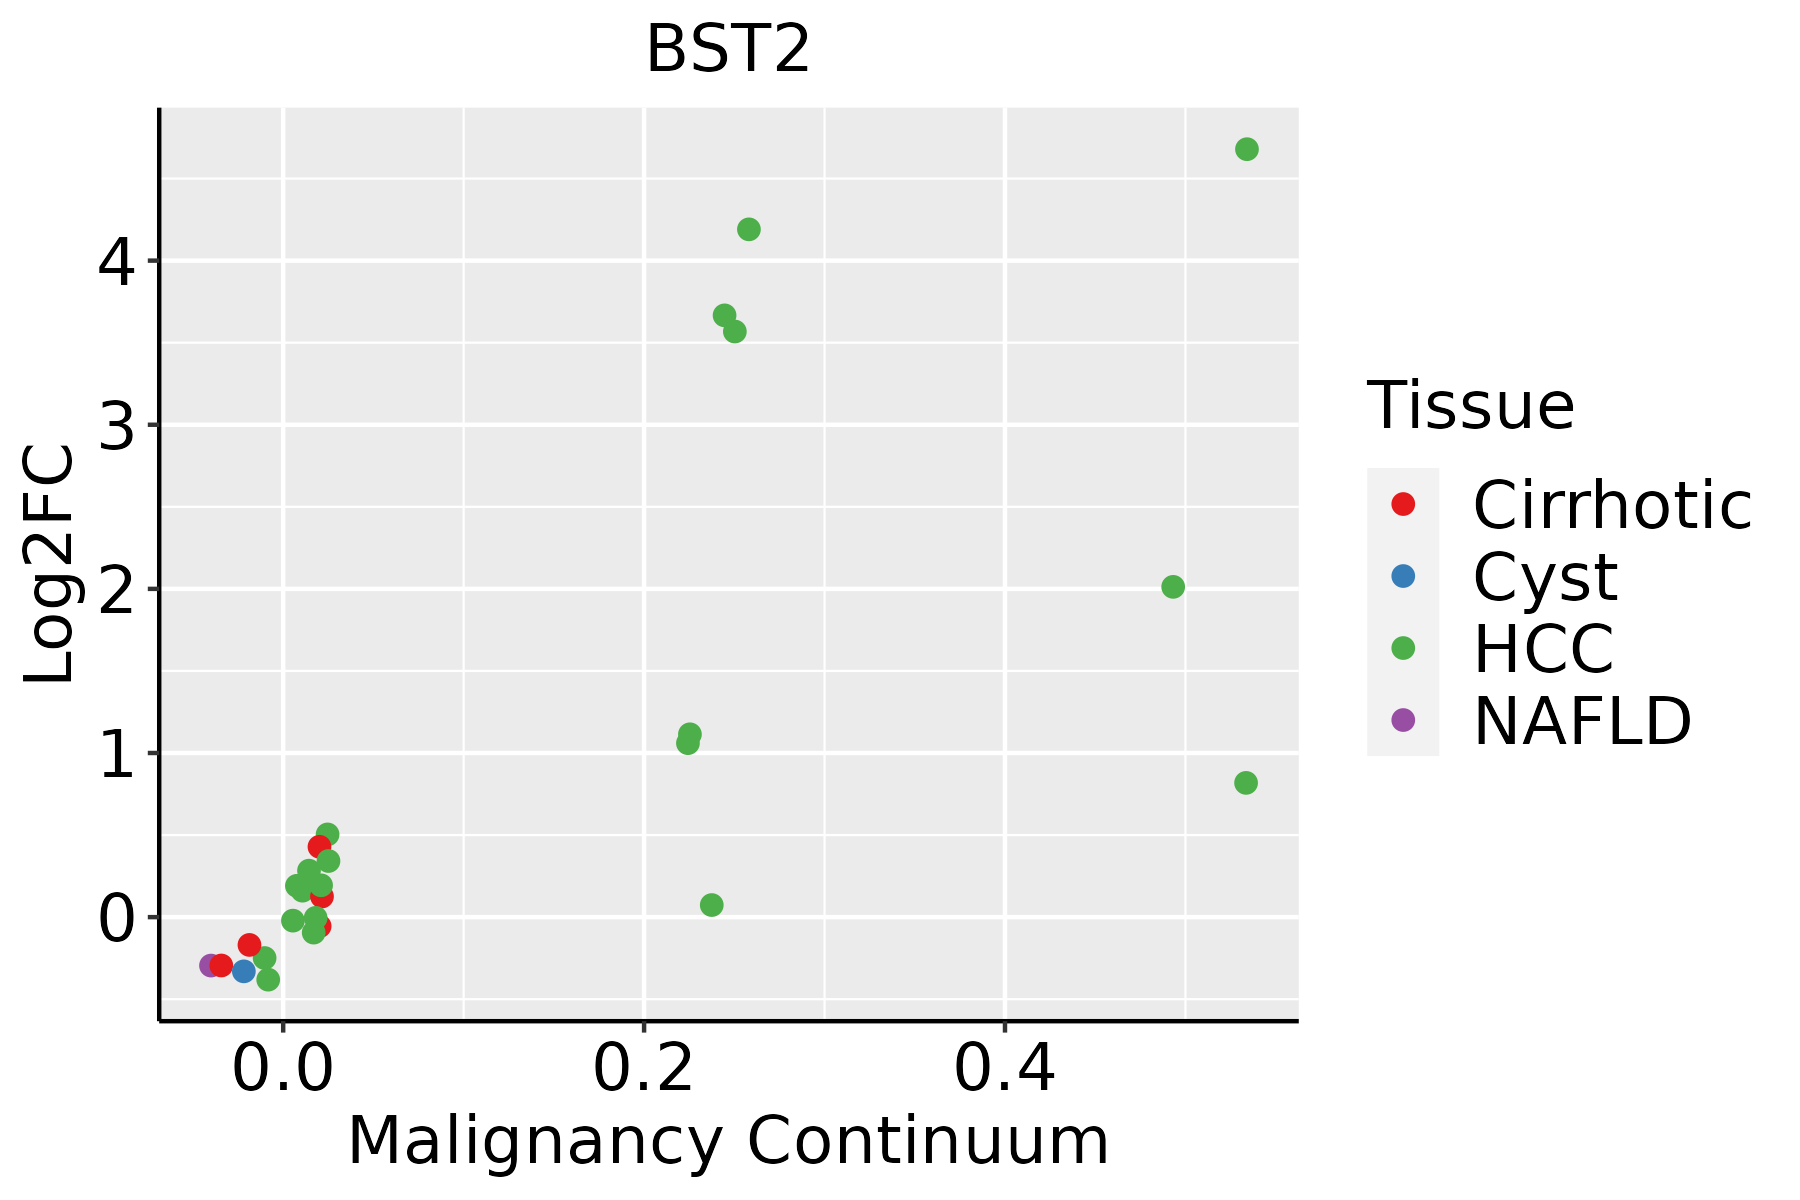 | HCC: Hepatocellular carcinoma |
| NAFLD: Non-alcoholic fatty liver disease |
| Lung |  | AAH: Atypical adenomatous hyperplasia |
| AIS: Adenocarcinoma in situ |
| IAC: Invasive lung adenocarcinoma |
| MIA: Minimally invasive adenocarcinoma |
| Oral Cavity | 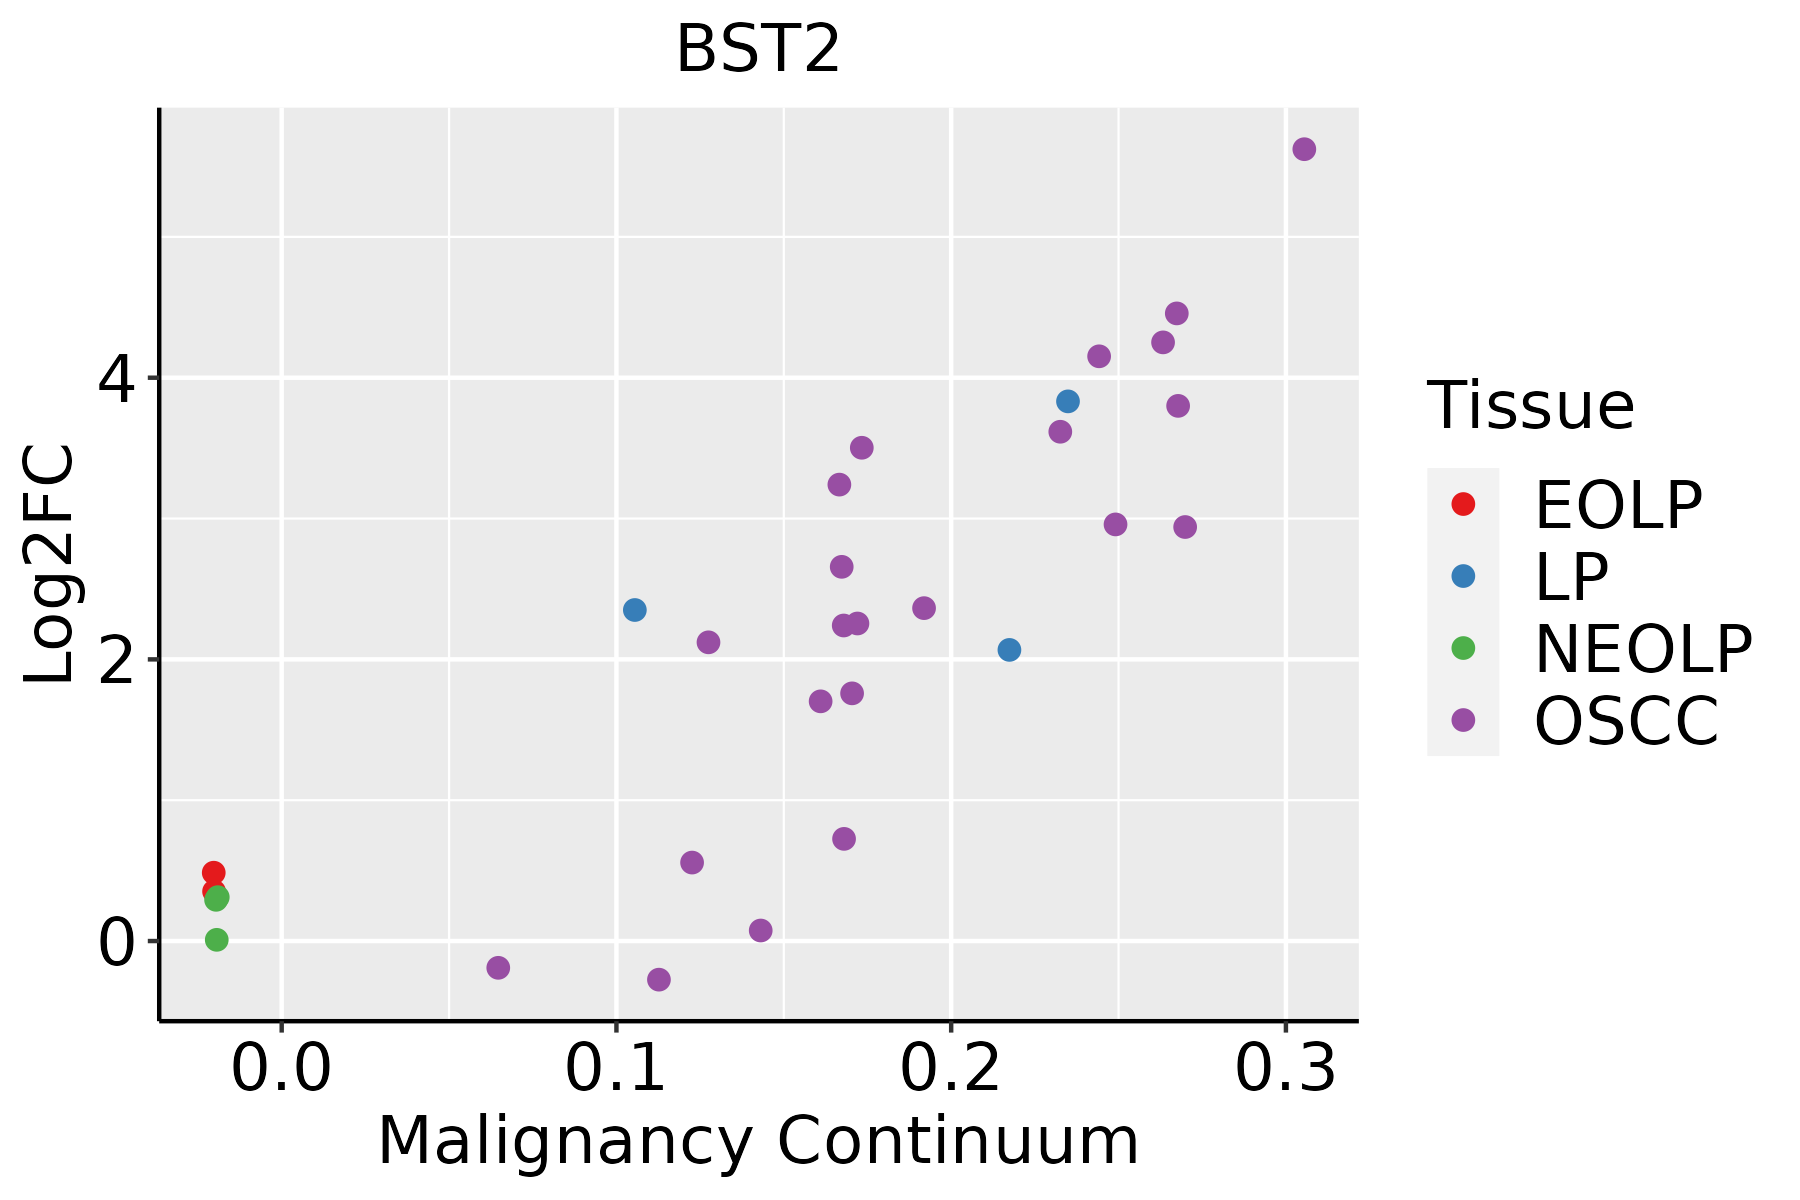 | EOLP: Erosive Oral lichen planus |
| LP: leukoplakia |
| NEOLP: Non-erosive oral lichen planus |
| OSCC: Oral squamous cell carcinoma |
| Prostate |  | BPH: Benign Prostatic Hyperplasia |
| Skin |  | AK: Actinic keratosis |
| cSCC: Cutaneous squamous cell carcinoma |
| SCCIS:squamous cell carcinoma in situ |
| Thyroid | 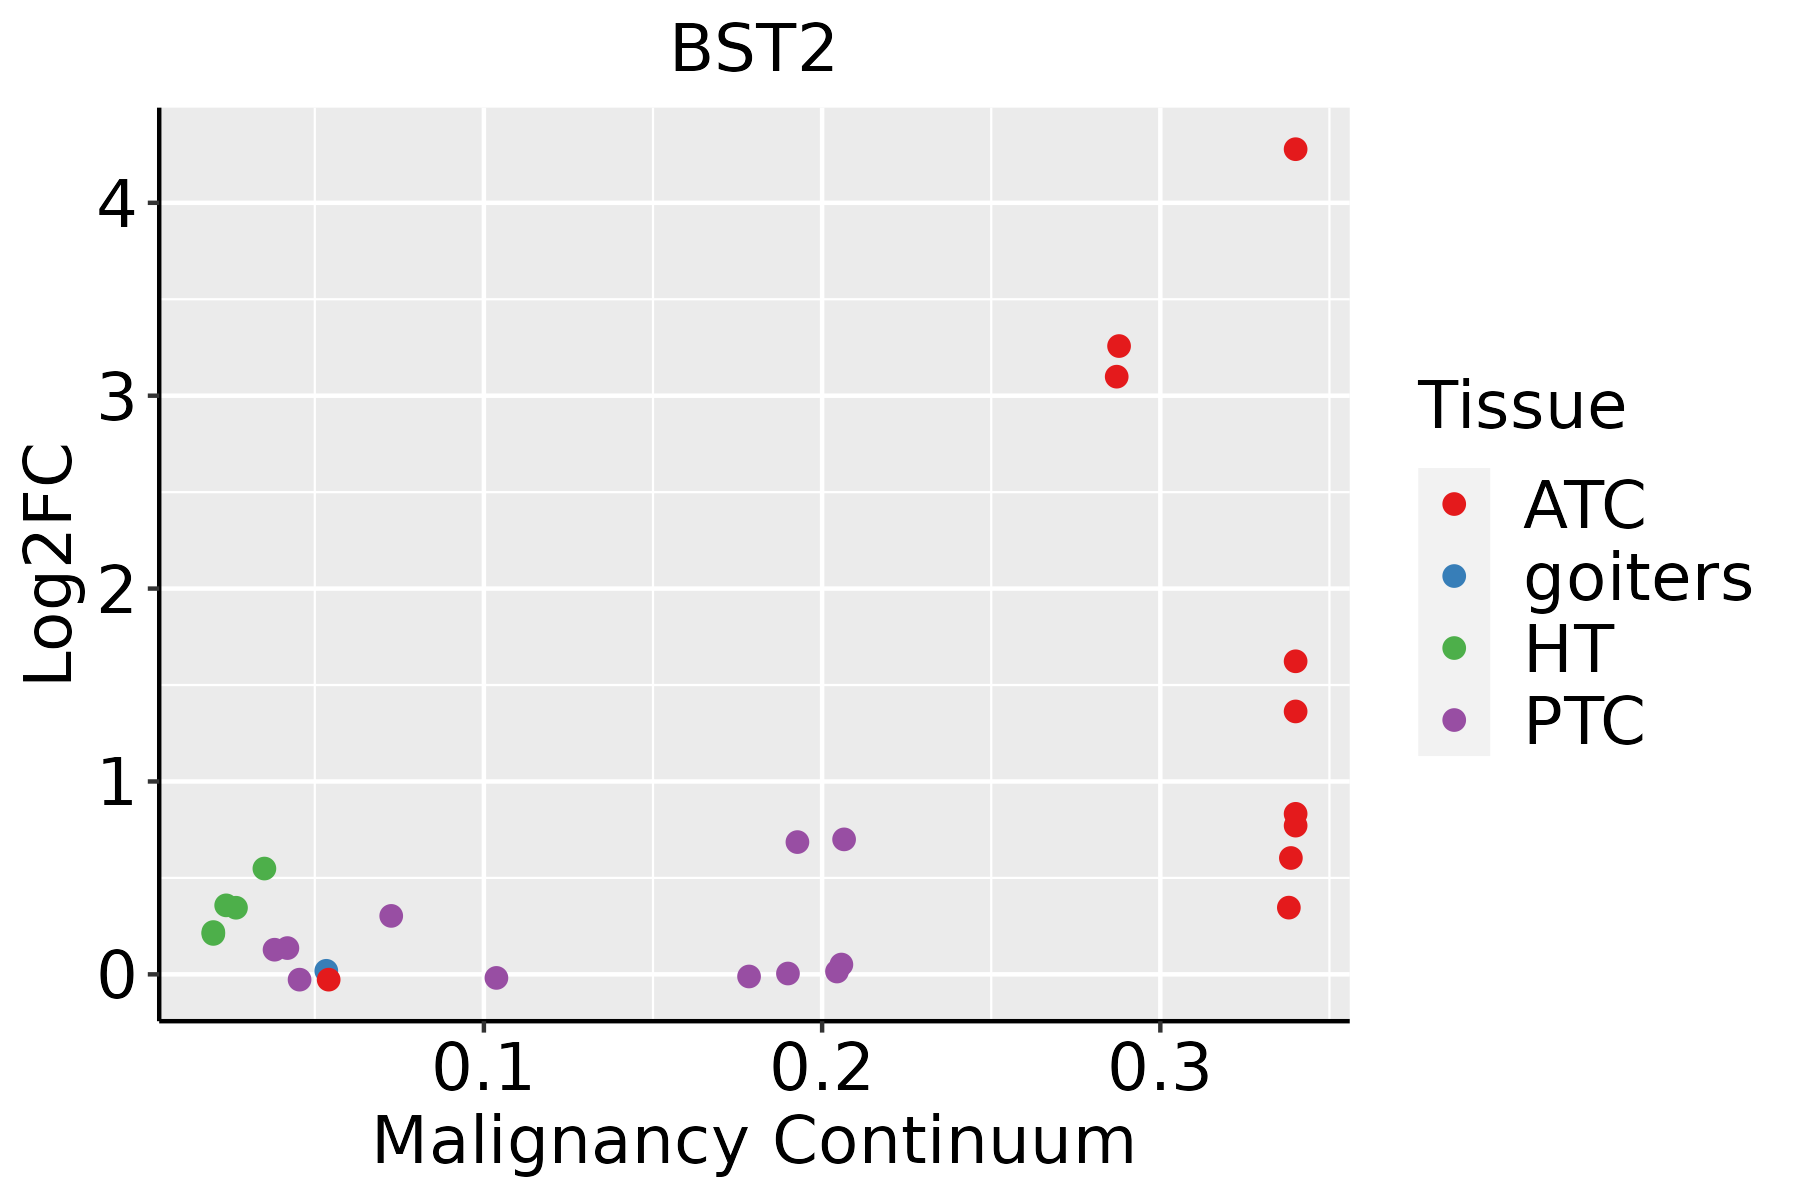 | ATC: Anaplastic thyroid cancer |
| HT: Hashimoto's thyroiditis |
| PTC: Papillary thyroid cancer |
| GO ID | Tissue | Disease Stage | Description | Gene Ratio | Bg Ratio | pvalue | p.adjust | Count |
| GO:000268331 | Oral cavity | NEOLP | negative regulation of immune system process | 73/2005 | 434/18723 | 6.18e-05 | 8.22e-04 | 73 |
| GO:004852531 | Oral cavity | NEOLP | negative regulation of viral process | 23/2005 | 92/18723 | 7.87e-05 | 1.00e-03 | 23 |
| GO:190390113 | Oral cavity | NEOLP | negative regulation of viral life cycle | 10/2005 | 25/18723 | 1.39e-04 | 1.61e-03 | 10 |
| GO:004592621 | Oral cavity | NEOLP | negative regulation of growth | 46/2005 | 249/18723 | 1.58e-04 | 1.77e-03 | 46 |
| GO:007066122 | Oral cavity | NEOLP | leukocyte proliferation | 55/2005 | 318/18723 | 2.32e-04 | 2.41e-03 | 55 |
| GO:003030821 | Oral cavity | NEOLP | negative regulation of cell growth | 36/2005 | 188/18723 | 3.88e-04 | 3.63e-03 | 36 |
| GO:004507131 | Oral cavity | NEOLP | negative regulation of viral genome replication | 15/2005 | 56/18723 | 6.08e-04 | 5.23e-03 | 15 |
| GO:007066315 | Oral cavity | NEOLP | regulation of leukocyte proliferation | 43/2005 | 245/18723 | 7.77e-04 | 6.23e-03 | 43 |
| GO:005105113 | Oral cavity | NEOLP | negative regulation of transport | 72/2005 | 470/18723 | 1.14e-03 | 8.49e-03 | 72 |
| GO:004476621 | Oral cavity | NEOLP | multi-organism transport | 7/2005 | 21/18723 | 4.79e-03 | 2.62e-02 | 7 |
| GO:190257921 | Oral cavity | NEOLP | multi-organism localization | 7/2005 | 21/18723 | 4.79e-03 | 2.62e-02 | 7 |
| GO:001603218 | Prostate | BPH | viral process | 147/3107 | 415/18723 | 4.46e-21 | 5.52e-18 | 147 |
| GO:003297018 | Prostate | BPH | regulation of actin filament-based process | 133/3107 | 397/18723 | 7.07e-17 | 1.62e-14 | 133 |
| GO:001905818 | Prostate | BPH | viral life cycle | 112/3107 | 317/18723 | 2.87e-16 | 5.54e-14 | 112 |
| GO:003295618 | Prostate | BPH | regulation of actin cytoskeleton organization | 118/3107 | 358/18723 | 1.51e-14 | 1.87e-12 | 118 |
| GO:001604910 | Prostate | BPH | cell growth | 139/3107 | 482/18723 | 7.53e-12 | 5.90e-10 | 139 |
| GO:005254718 | Prostate | BPH | regulation of peptidase activity | 133/3107 | 461/18723 | 2.08e-11 | 1.43e-09 | 133 |
| GO:005254818 | Prostate | BPH | regulation of endopeptidase activity | 122/3107 | 432/18723 | 6.10e-10 | 2.91e-08 | 122 |
| GO:000155810 | Prostate | BPH | regulation of cell growth | 116/3107 | 414/18723 | 2.66e-09 | 1.05e-07 | 116 |
| GO:004586118 | Prostate | BPH | negative regulation of proteolysis | 98/3107 | 351/18723 | 5.43e-08 | 1.49e-06 | 98 |
| Pathway ID | Tissue | Disease Stage | Description | Gene Ratio | Bg Ratio | pvalue | p.adjust | qvalue | Count |
| hsa0517024 | Breast | DCIS | Human immunodeficiency virus 1 infection | 33/846 | 212/8465 | 6.49e-03 | 3.22e-02 | 2.37e-02 | 33 |
| hsa0517034 | Breast | DCIS | Human immunodeficiency virus 1 infection | 33/846 | 212/8465 | 6.49e-03 | 3.22e-02 | 2.37e-02 | 33 |
| hsa0517016 | Cervix | CC | Human immunodeficiency virus 1 infection | 55/1267 | 212/8465 | 1.80e-05 | 1.42e-04 | 8.40e-05 | 55 |
| hsa0517017 | Cervix | CC | Human immunodeficiency virus 1 infection | 55/1267 | 212/8465 | 1.80e-05 | 1.42e-04 | 8.40e-05 | 55 |
| hsa051704 | Colorectum | MSS | Human immunodeficiency virus 1 infection | 69/1875 | 212/8465 | 2.66e-04 | 1.98e-03 | 1.21e-03 | 69 |
| hsa03250 | Colorectum | MSS | Viral life cycle - HIV-1 | 23/1875 | 63/8465 | 6.55e-03 | 2.64e-02 | 1.62e-02 | 23 |
| hsa051705 | Colorectum | MSS | Human immunodeficiency virus 1 infection | 69/1875 | 212/8465 | 2.66e-04 | 1.98e-03 | 1.21e-03 | 69 |
| hsa032501 | Colorectum | MSS | Viral life cycle - HIV-1 | 23/1875 | 63/8465 | 6.55e-03 | 2.64e-02 | 1.62e-02 | 23 |
| hsa0517018 | Endometrium | AEH | Human immunodeficiency virus 1 infection | 43/1197 | 212/8465 | 8.19e-03 | 4.22e-02 | 3.09e-02 | 43 |
| hsa0517019 | Endometrium | AEH | Human immunodeficiency virus 1 infection | 43/1197 | 212/8465 | 8.19e-03 | 4.22e-02 | 3.09e-02 | 43 |
| hsa0517025 | Endometrium | EEC | Human immunodeficiency virus 1 infection | 44/1237 | 212/8465 | 8.86e-03 | 4.05e-02 | 3.02e-02 | 44 |
| hsa0517035 | Endometrium | EEC | Human immunodeficiency virus 1 infection | 44/1237 | 212/8465 | 8.86e-03 | 4.05e-02 | 3.02e-02 | 44 |
| hsa0517029 | Esophagus | HGIN | Human immunodeficiency virus 1 infection | 51/1383 | 212/8465 | 2.16e-03 | 1.90e-02 | 1.51e-02 | 51 |
| hsa05170112 | Esophagus | HGIN | Human immunodeficiency virus 1 infection | 51/1383 | 212/8465 | 2.16e-03 | 1.90e-02 | 1.51e-02 | 51 |
| hsa032509 | Esophagus | ESCC | Viral life cycle - HIV-1 | 54/4205 | 63/8465 | 2.01e-09 | 2.17e-08 | 1.11e-08 | 54 |
| hsa05170210 | Esophagus | ESCC | Human immunodeficiency virus 1 infection | 147/4205 | 212/8465 | 3.37e-09 | 3.53e-08 | 1.81e-08 | 147 |
| hsa0325014 | Esophagus | ESCC | Viral life cycle - HIV-1 | 54/4205 | 63/8465 | 2.01e-09 | 2.17e-08 | 1.11e-08 | 54 |
| hsa0517038 | Esophagus | ESCC | Human immunodeficiency virus 1 infection | 147/4205 | 212/8465 | 3.37e-09 | 3.53e-08 | 1.81e-08 | 147 |
| hsa032502 | Liver | HCC | Viral life cycle - HIV-1 | 46/4020 | 63/8465 | 3.25e-05 | 1.88e-04 | 1.04e-04 | 46 |
| hsa051709 | Liver | HCC | Human immunodeficiency virus 1 infection | 125/4020 | 212/8465 | 4.51e-04 | 1.94e-03 | 1.08e-03 | 125 |
| Hugo Symbol | Variant Class | Variant Classification | dbSNP RS | HGVSc | HGVSp | HGVSp Short | SWISSPROT | BIOTYPE | SIFT | PolyPhen | Tumor Sample Barcode | Tissue | Histology | Sex | Age | Stage | Therapy Types | Drugs | Outcome |
| BST2 | SNV | Missense_Mutation | | c.112G>C | p.Gly38Arg | p.G38R | Q10589 | protein_coding | tolerated(0.4) | probably_damaging(1) | TCGA-AN-A0FK-01 | Breast | breast invasive carcinoma | Female | >=65 | III/IV | Unknown | Unknown | SD |
| BST2 | SNV | Missense_Mutation | | c.440G>A | p.Arg147Lys | p.R147K | Q10589 | protein_coding | tolerated_low_confidence(0.97) | benign(0.129) | TCGA-JW-A5VL-01 | Cervix | cervical & endocervical cancer | Female | <65 | I/II | Unknown | Unknown | SD |
| BST2 | SNV | Missense_Mutation | rs753915464 | c.29N>A | p.Arg10Lys | p.R10K | Q10589 | protein_coding | tolerated(1) | benign(0.001) | TCGA-VS-A959-01 | Cervix | cervical & endocervical cancer | Female | >=65 | I/II | Unknown | Unknown | SD |
| BST2 | SNV | Missense_Mutation | | c.494C>T | p.Ala165Val | p.A165V | Q10589 | protein_coding | tolerated_low_confidence(0.3) | benign(0.025) | TCGA-AA-3833-01 | Colorectum | colon adenocarcinoma | Female | <65 | I/II | Unknown | Unknown | SD |
| BST2 | SNV | Missense_Mutation | rs376557702 | c.56G>A | p.Arg19His | p.R19H | Q10589 | protein_coding | tolerated(0.1) | benign(0.017) | TCGA-A5-A0G2-01 | Endometrium | uterine corpus endometrioid carcinoma | Female | <65 | III/IV | Unknown | Unknown | SD |
| BST2 | SNV | Missense_Mutation | novel | c.248N>T | p.Asp83Val | p.D83V | Q10589 | protein_coding | tolerated(0.27) | possibly_damaging(0.68) | TCGA-A5-A1OF-01 | Endometrium | uterine corpus endometrioid carcinoma | Female | <65 | I/II | Unknown | Unknown | SD |
| BST2 | SNV | Missense_Mutation | novel | c.190C>T | p.Arg64Cys | p.R64C | Q10589 | protein_coding | deleterious(0) | possibly_damaging(0.85) | TCGA-AJ-A3BH-01 | Endometrium | uterine corpus endometrioid carcinoma | Female | Unknown | I/II | Unknown | Unknown | SD |
| BST2 | SNV | Missense_Mutation | novel | c.108N>G | p.Ile36Met | p.I36M | Q10589 | protein_coding | tolerated(0.1) | benign(0.145) | TCGA-AP-A059-01 | Endometrium | uterine corpus endometrioid carcinoma | Female | >=65 | I/II | Unknown | Unknown | SD |
| BST2 | SNV | Missense_Mutation | novel | c.437T>C | p.Val146Ala | p.V146A | Q10589 | protein_coding | tolerated_low_confidence(1) | benign(0.001) | TCGA-AP-A1DK-01 | Endometrium | uterine corpus endometrioid carcinoma | Female | <65 | I/II | Unknown | Unknown | SD |
| BST2 | SNV | Missense_Mutation | novel | c.351G>T | p.Glu117Asp | p.E117D | Q10589 | protein_coding | tolerated(0.05) | possibly_damaging(0.73) | TCGA-AX-A1CE-01 | Endometrium | uterine corpus endometrioid carcinoma | Female | <65 | I/II | Unspecific | Paclitaxel | SD |


