
|
|||||
|
 | |
| |
| |
| |
| |
| |
|
Gene: ADM |
Gene summary for ADM |
| Gene information | Species | Human | Gene symbol | ADM | Gene ID | 133 |
| Gene name | adrenomedullin | |
| Gene Alias | AM | |
| Cytomap | 11p15.4 | |
| Gene Type | protein-coding | GO ID | GO:0000003 | UniProtAcc | P35318 |
Top |
Malignant transformation analysis |
| Identification of the aberrant gene expression in precancerous and cancerous lesions by comparing the gene expression of stem-like cells in diseased tissues with normal stem cells |
| Entrez ID | Symbol | Replicates | Species | Organ | Tissue | Adj P-value | Log2FC | Malignancy |
| 133 | ADM | GSM4909282 | Human | Breast | IDC | 5.22e-03 | -2.85e-01 | -0.0288 |
| 133 | ADM | GSM4909285 | Human | Breast | IDC | 1.23e-09 | -3.62e-01 | 0.21 |
| 133 | ADM | GSM4909286 | Human | Breast | IDC | 4.79e-07 | -3.65e-01 | 0.1081 |
| 133 | ADM | GSM4909290 | Human | Breast | IDC | 1.20e-07 | -3.78e-01 | 0.2096 |
| 133 | ADM | GSM4909293 | Human | Breast | IDC | 1.09e-07 | -3.75e-01 | 0.1581 |
| 133 | ADM | GSM4909294 | Human | Breast | IDC | 7.44e-06 | -3.73e-01 | 0.2022 |
| 133 | ADM | GSM4909297 | Human | Breast | IDC | 5.62e-05 | -2.27e-01 | 0.1517 |
| 133 | ADM | GSM4909298 | Human | Breast | IDC | 3.90e-10 | -3.82e-01 | 0.1551 |
| 133 | ADM | GSM4909301 | Human | Breast | IDC | 1.30e-08 | -3.60e-01 | 0.1577 |
| 133 | ADM | GSM4909305 | Human | Breast | IDC | 6.31e-03 | -3.16e-01 | 0.0436 |
| 133 | ADM | GSM4909306 | Human | Breast | IDC | 1.86e-04 | -3.25e-01 | 0.1564 |
| 133 | ADM | GSM4909307 | Human | Breast | IDC | 1.51e-07 | -3.46e-01 | 0.1569 |
| 133 | ADM | GSM4909308 | Human | Breast | IDC | 2.69e-10 | -3.82e-01 | 0.158 |
| 133 | ADM | GSM4909311 | Human | Breast | IDC | 7.77e-09 | -3.51e-01 | 0.1534 |
| 133 | ADM | GSM4909312 | Human | Breast | IDC | 3.01e-07 | -3.36e-01 | 0.1552 |
| 133 | ADM | GSM4909313 | Human | Breast | IDC | 6.70e-03 | -2.86e-01 | 0.0391 |
| 133 | ADM | GSM4909319 | Human | Breast | IDC | 1.49e-12 | -3.90e-01 | 0.1563 |
| 133 | ADM | GSM4909320 | Human | Breast | IDC | 3.47e-02 | -3.63e-01 | 0.1575 |
| 133 | ADM | GSM4909321 | Human | Breast | IDC | 2.34e-05 | -3.11e-01 | 0.1559 |
| 133 | ADM | ctrl6 | Human | Breast | Precancer | 1.30e-23 | 1.15e+00 | -0.0061 |
| Page: 1 2 3 4 5 6 7 8 9 |
| Tissue | Expression Dynamics | Abbreviation |
| Breast | 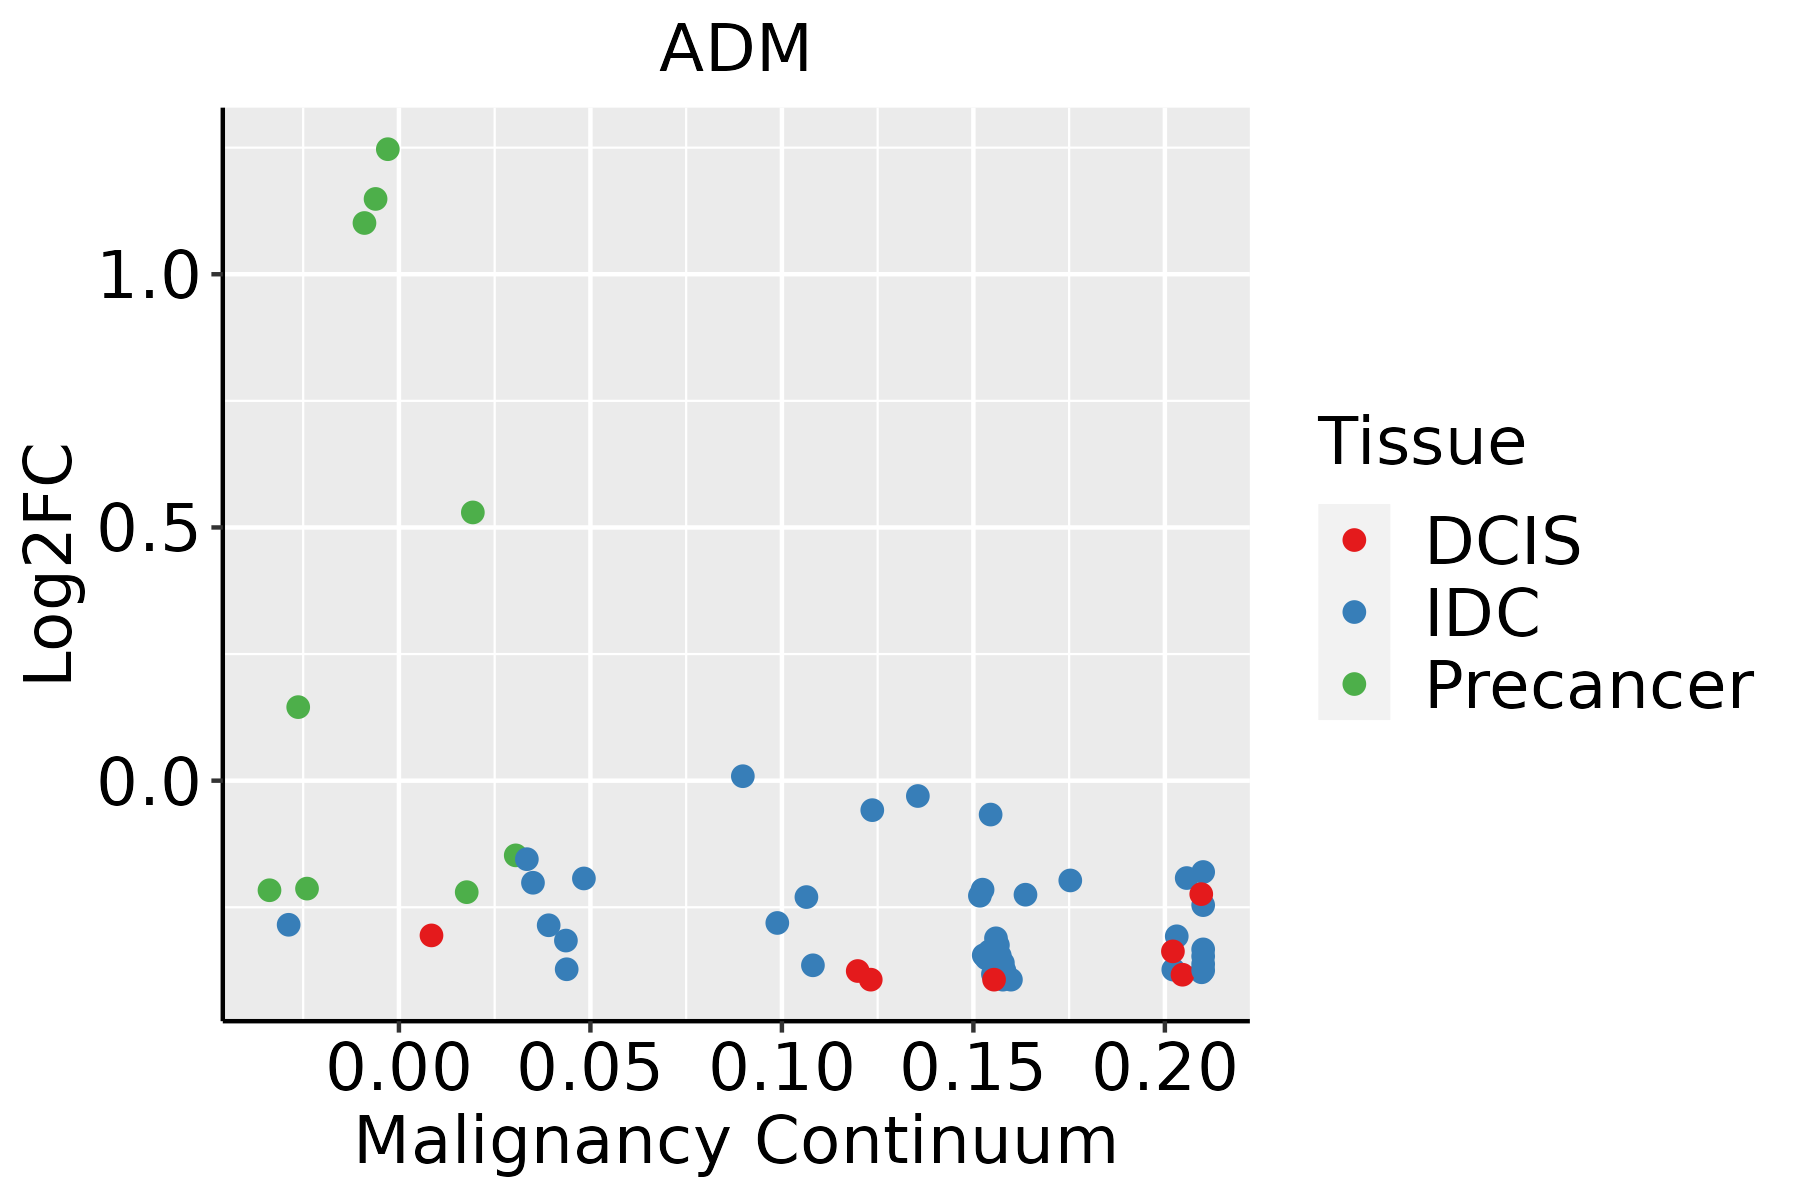 | IDC: Invasive ductal carcinoma |
| DCIS: Ductal carcinoma in situ | ||
| Precancer(BRCA1-mut): Precancerous lesion from BRCA1 mutation carriers | ||
| Cervix | 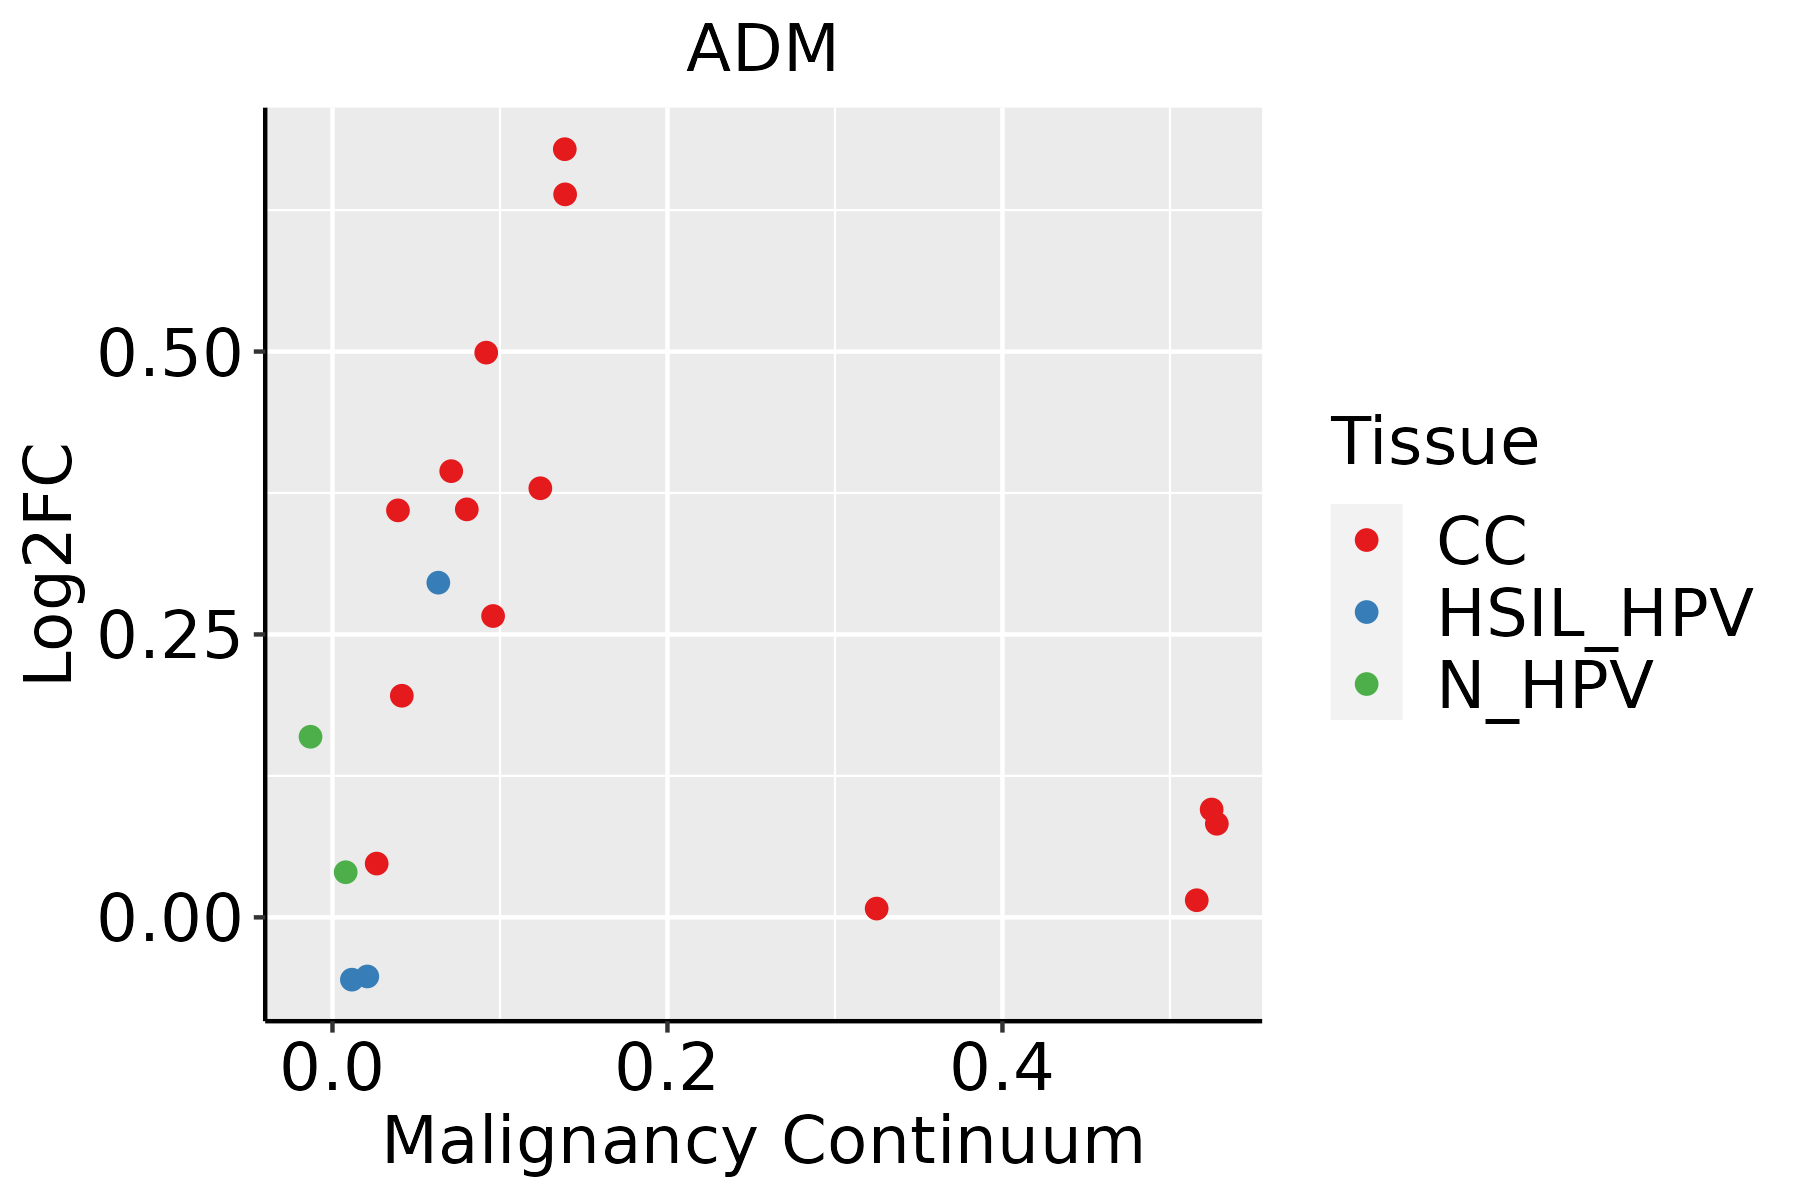 | CC: Cervix cancer |
| HSIL_HPV: HPV-infected high-grade squamous intraepithelial lesions | ||
| N_HPV: HPV-infected normal cervix | ||
| Colorectum (GSE201348) |  | FAP: Familial adenomatous polyposis |
| CRC: Colorectal cancer | ||
| Colorectum (HTA11) |  | AD: Adenomas |
| SER: Sessile serrated lesions | ||
| MSI-H: Microsatellite-high colorectal cancer | ||
| MSS: Microsatellite stable colorectal cancer | ||
| Esophagus | 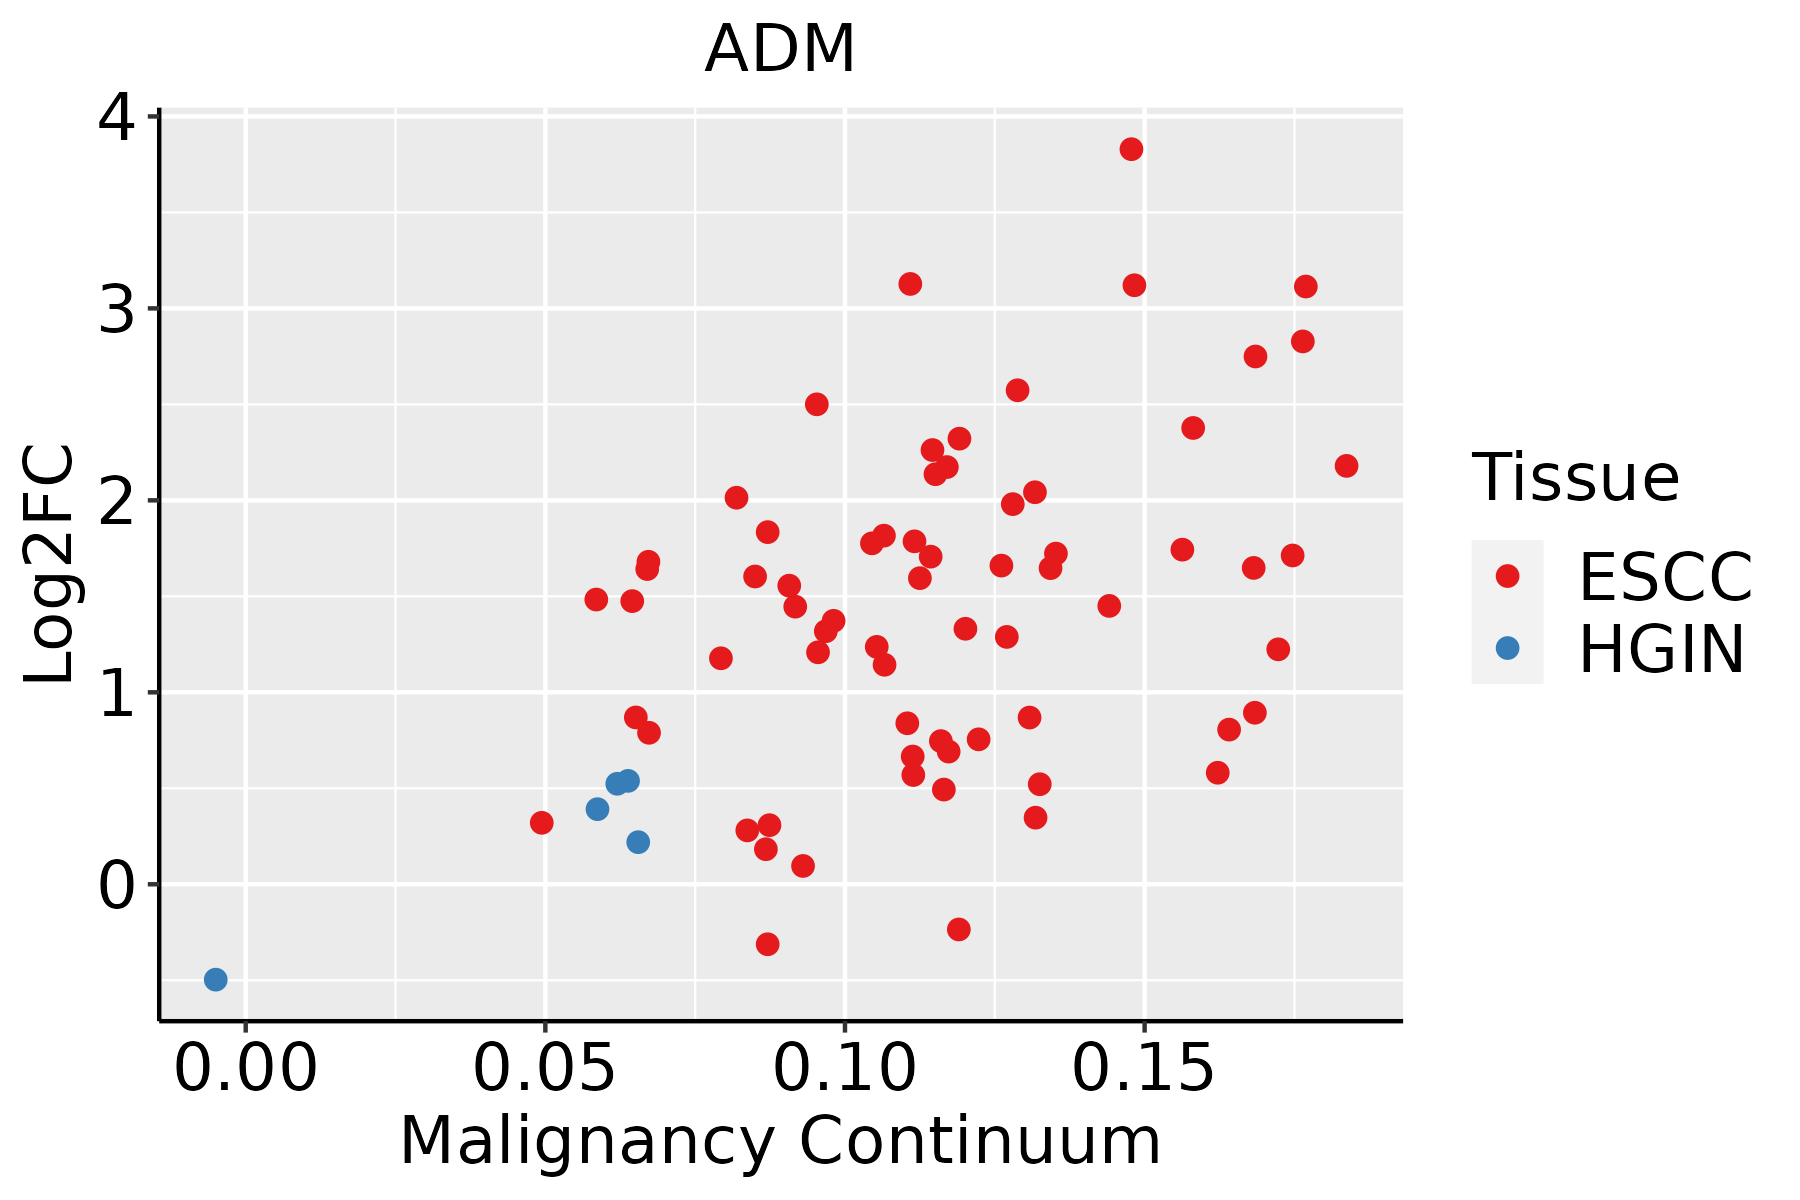 | ESCC: Esophageal squamous cell carcinoma |
| HGIN: High-grade intraepithelial neoplasias | ||
| LGIN: Low-grade intraepithelial neoplasias | ||
| Liver | 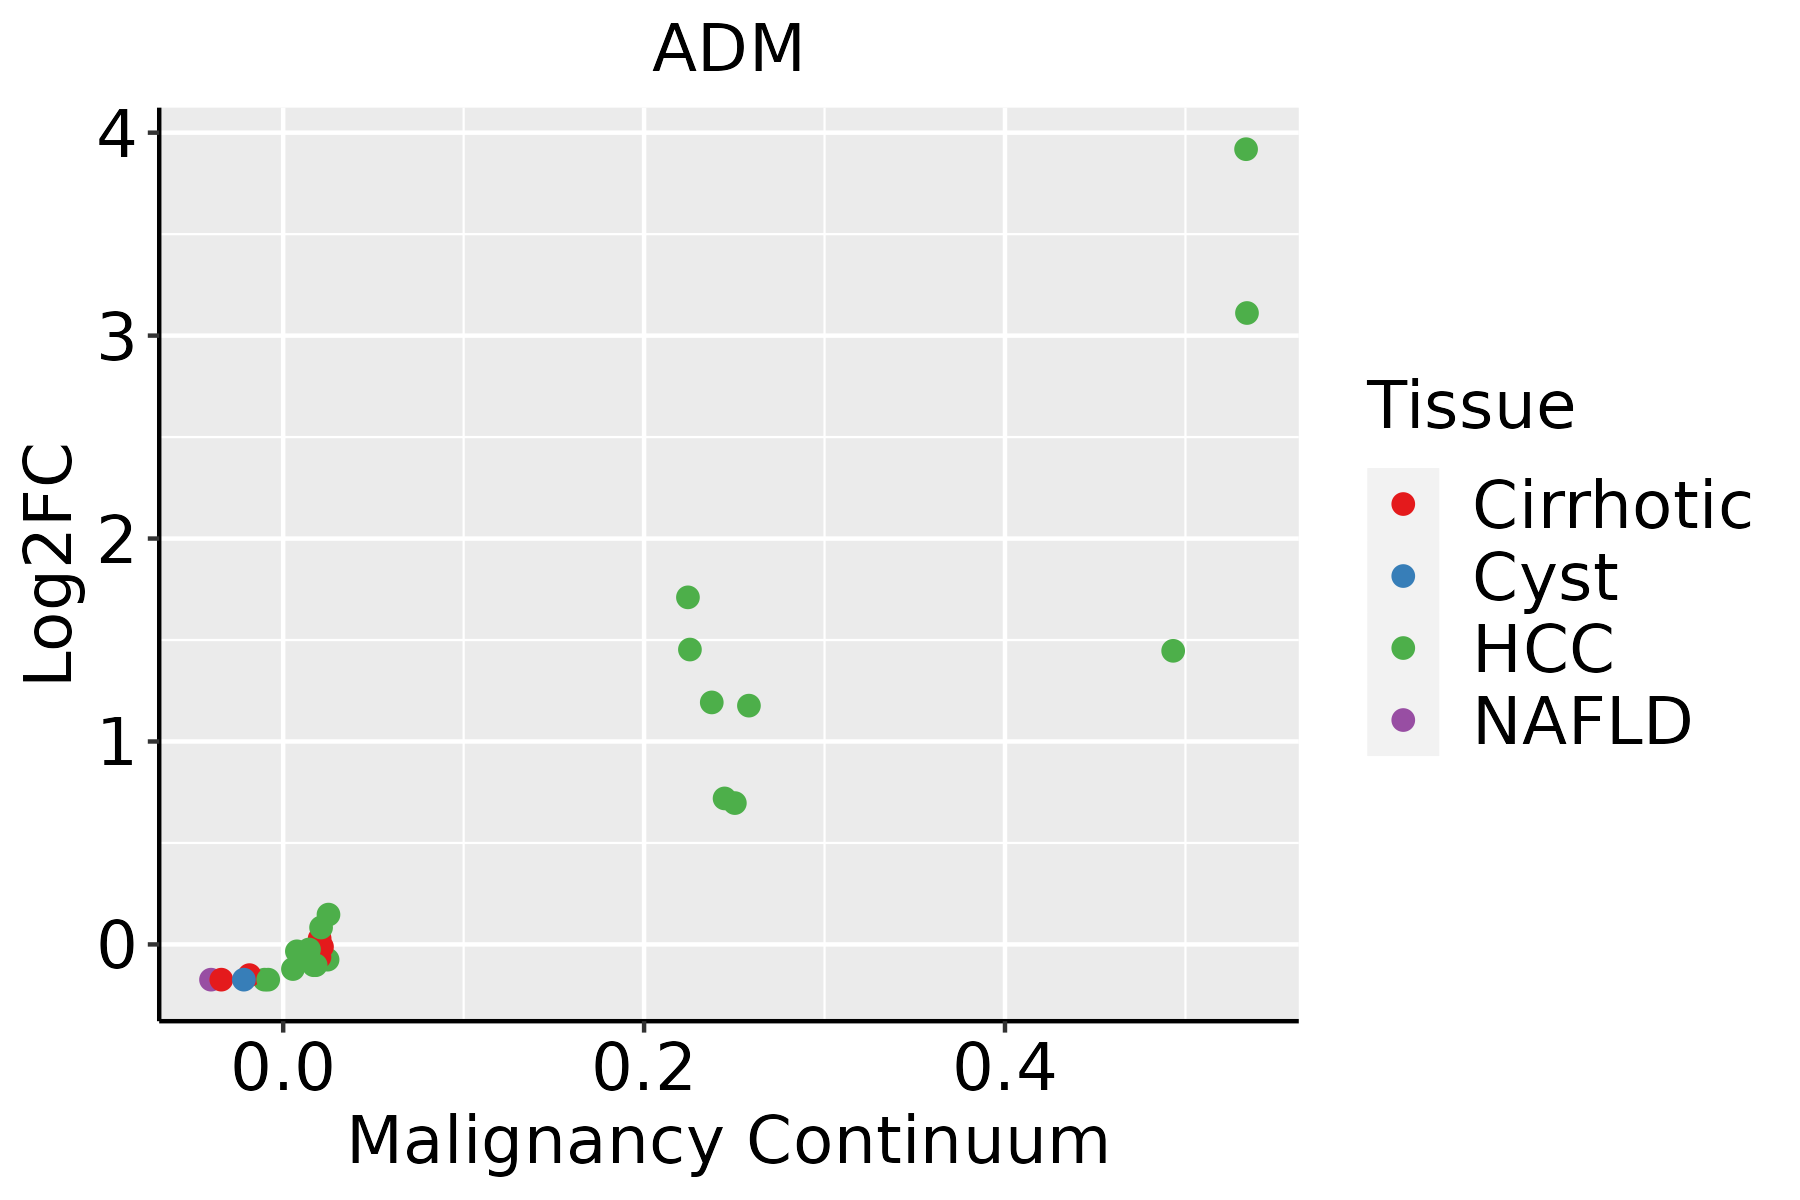 | HCC: Hepatocellular carcinoma |
| NAFLD: Non-alcoholic fatty liver disease | ||
| Lung |  | AAH: Atypical adenomatous hyperplasia |
| AIS: Adenocarcinoma in situ | ||
| IAC: Invasive lung adenocarcinoma | ||
| MIA: Minimally invasive adenocarcinoma | ||
| Oral Cavity | 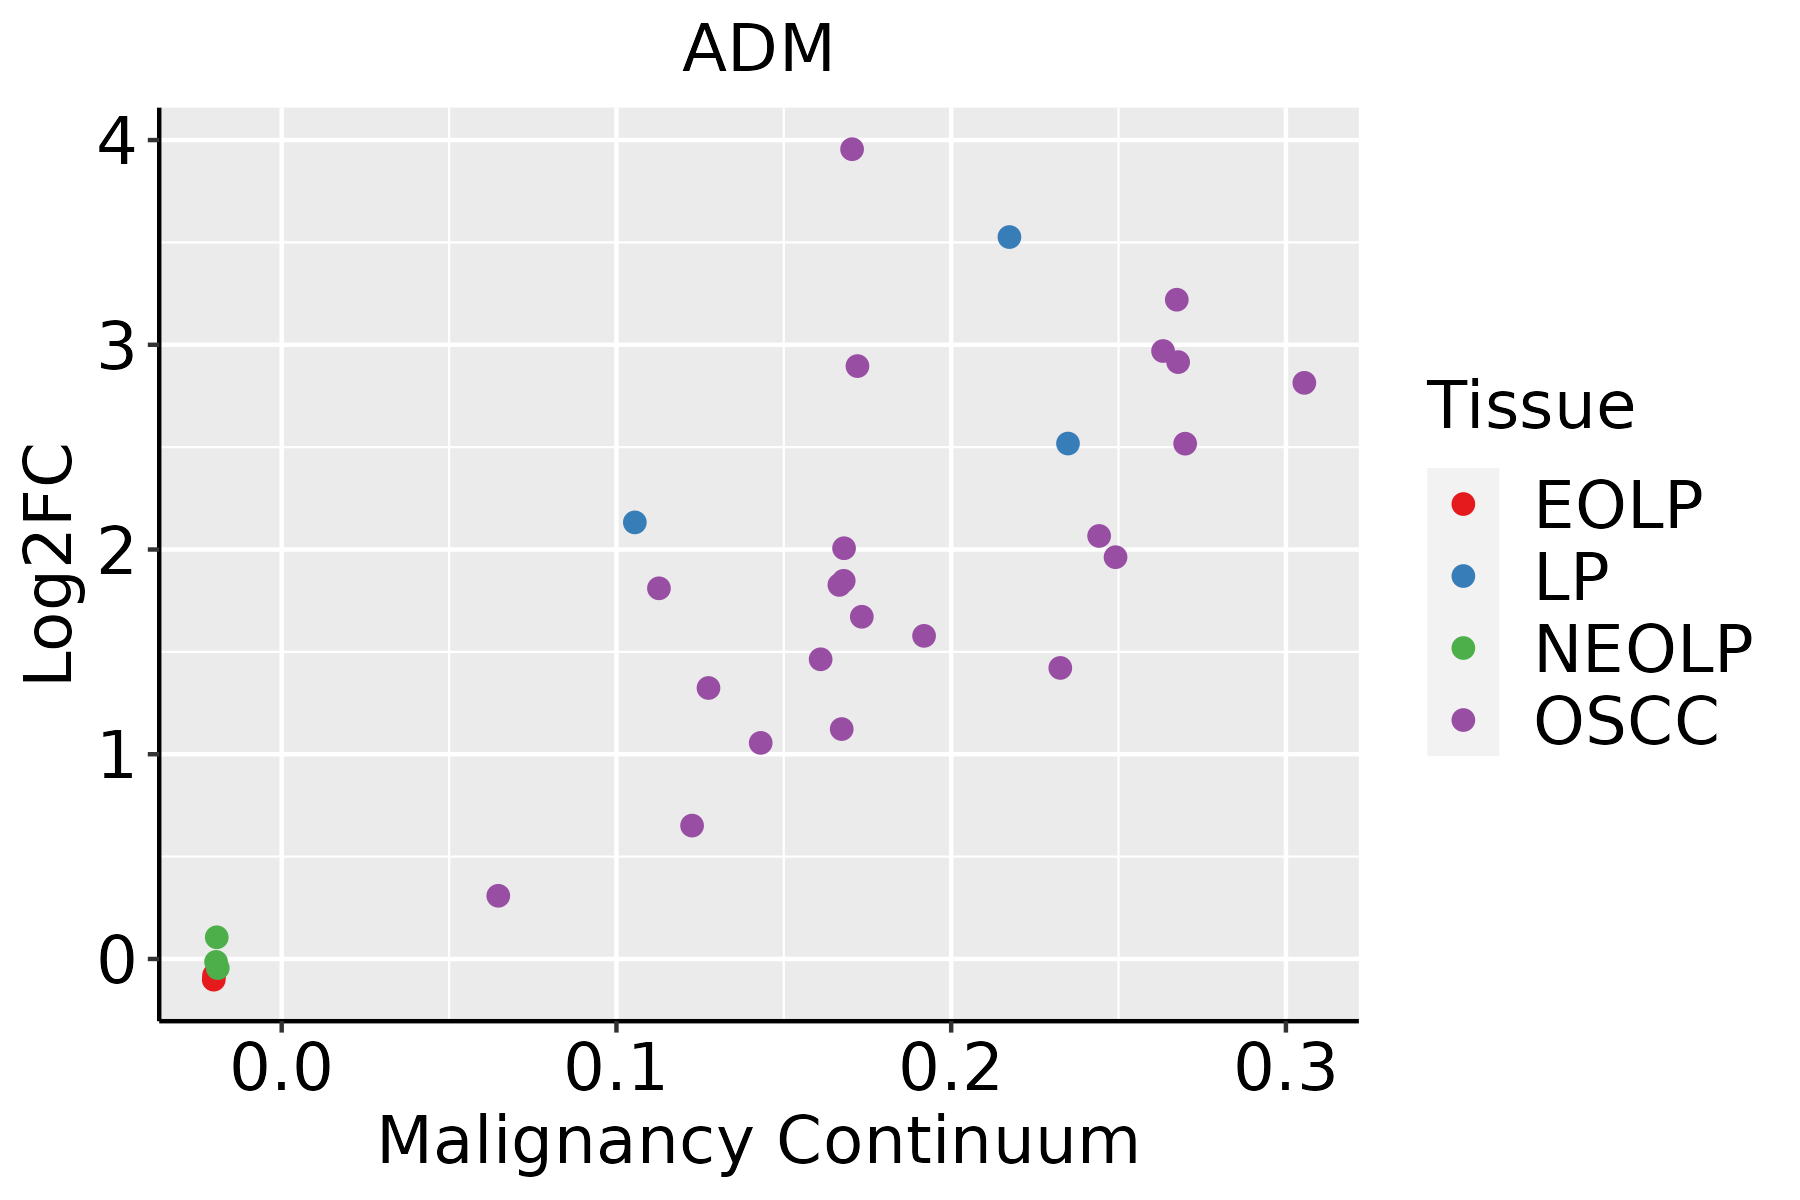 | EOLP: Erosive Oral lichen planus |
| LP: leukoplakia | ||
| NEOLP: Non-erosive oral lichen planus | ||
| OSCC: Oral squamous cell carcinoma | ||
| Prostate | 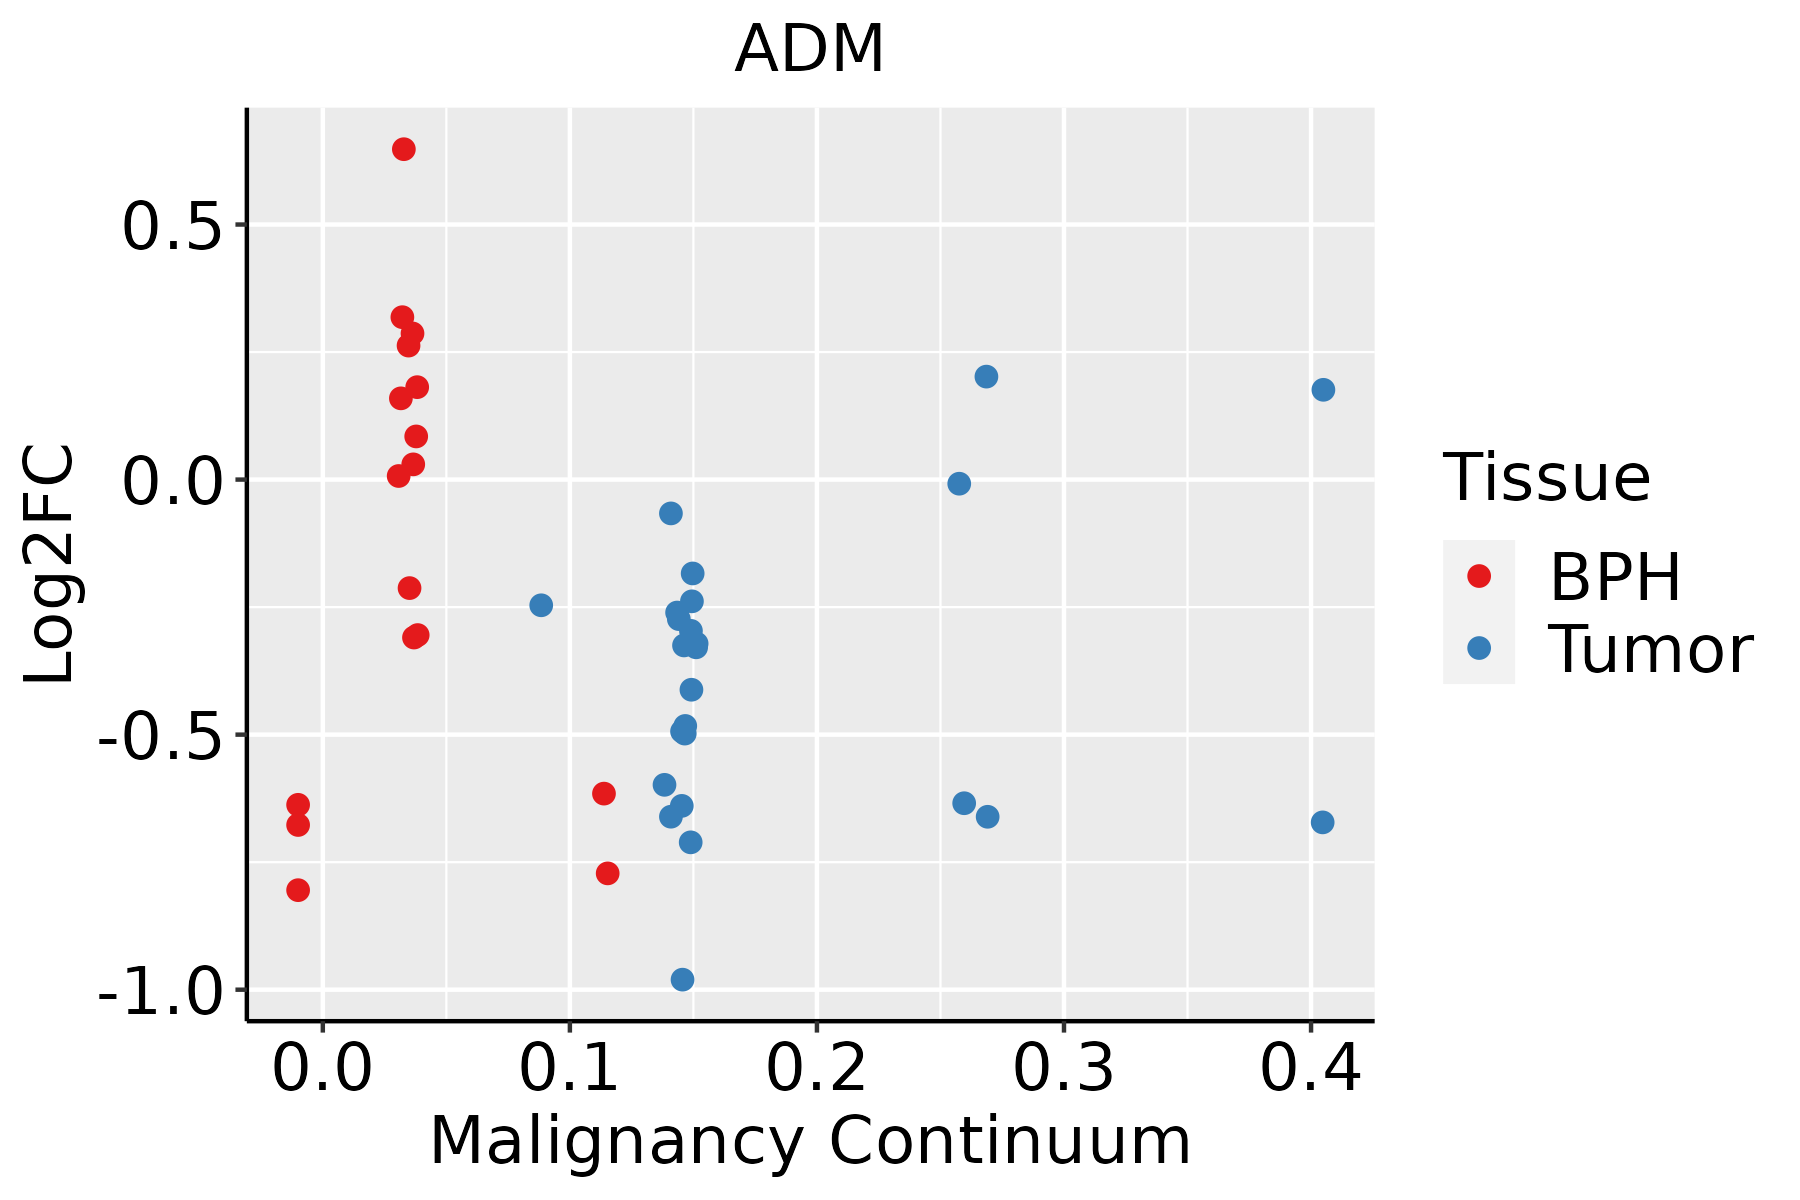 | BPH: Benign Prostatic Hyperplasia |
| Skin | 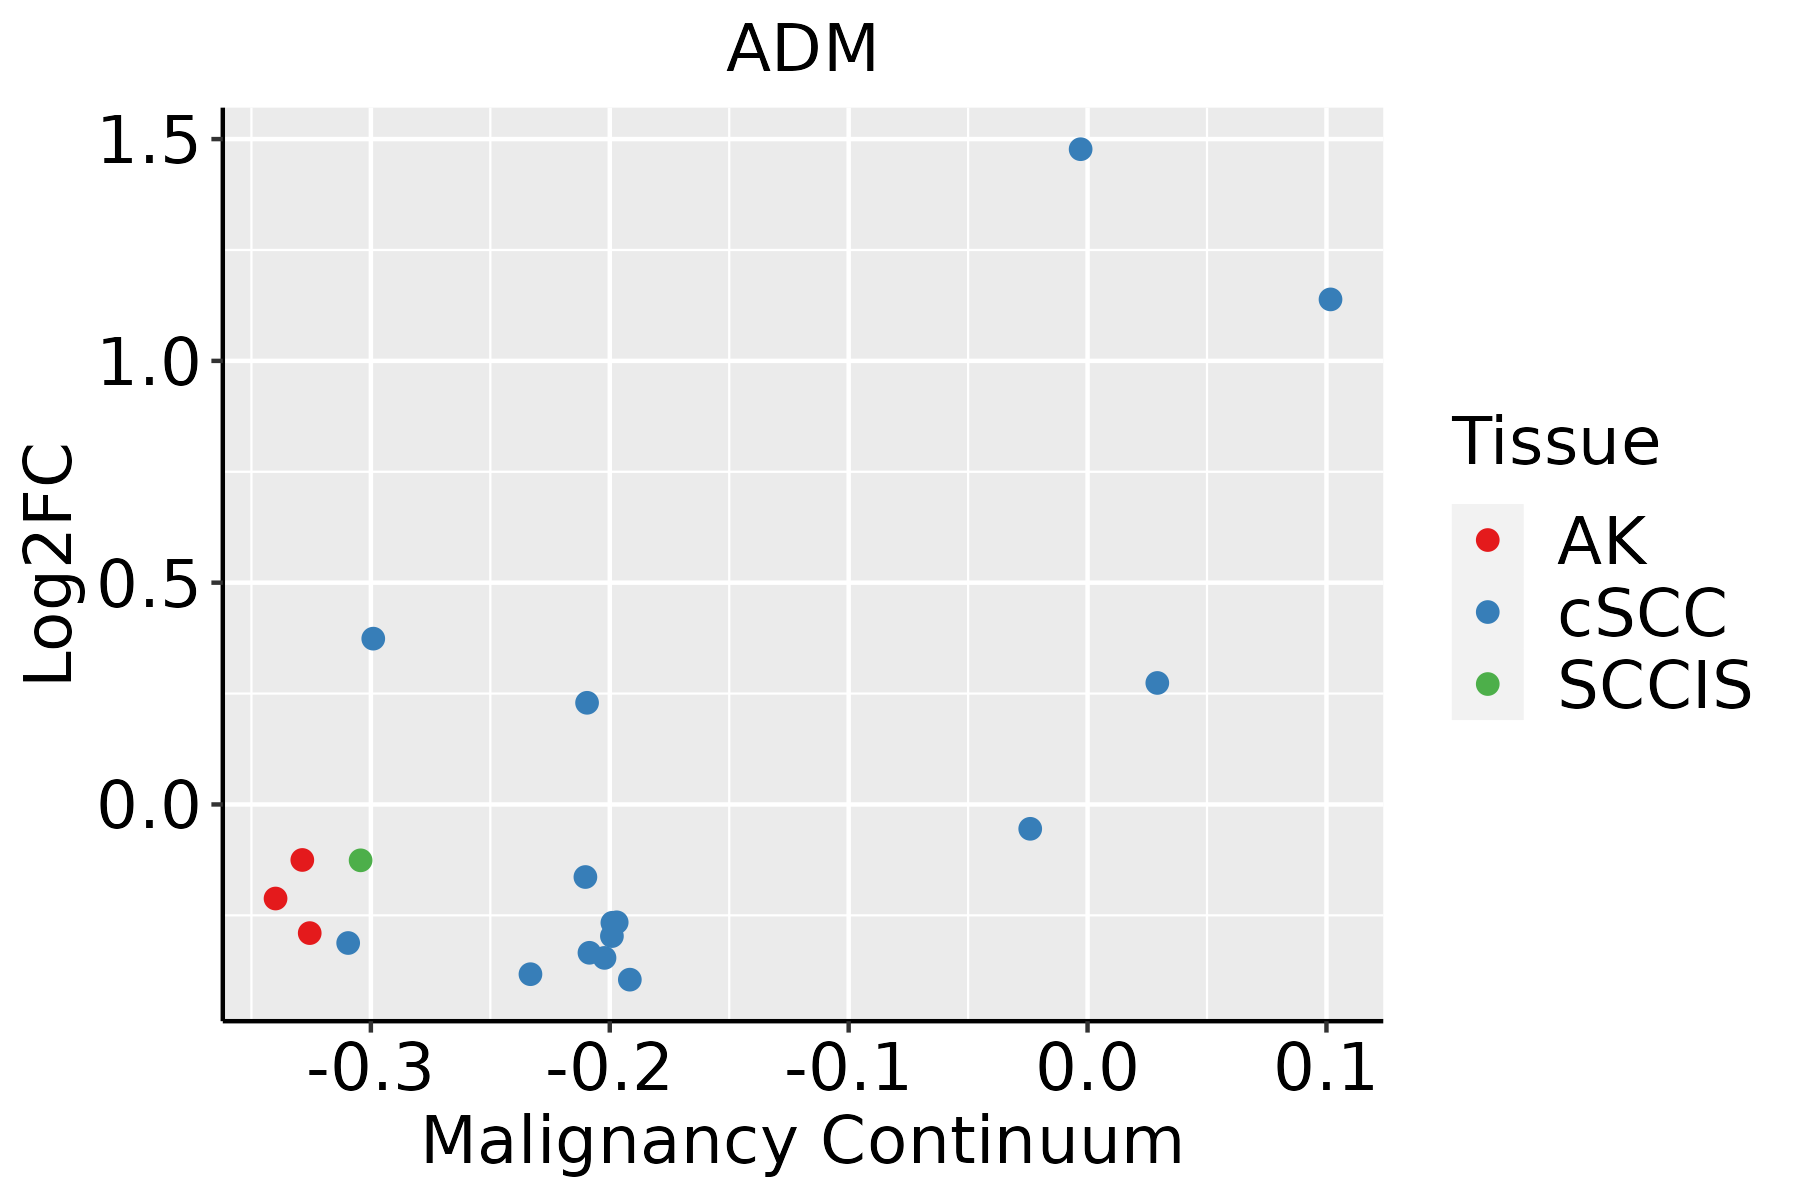 | AK: Actinic keratosis |
| cSCC: Cutaneous squamous cell carcinoma | ||
| SCCIS:squamous cell carcinoma in situ | ||
| Thyroid | 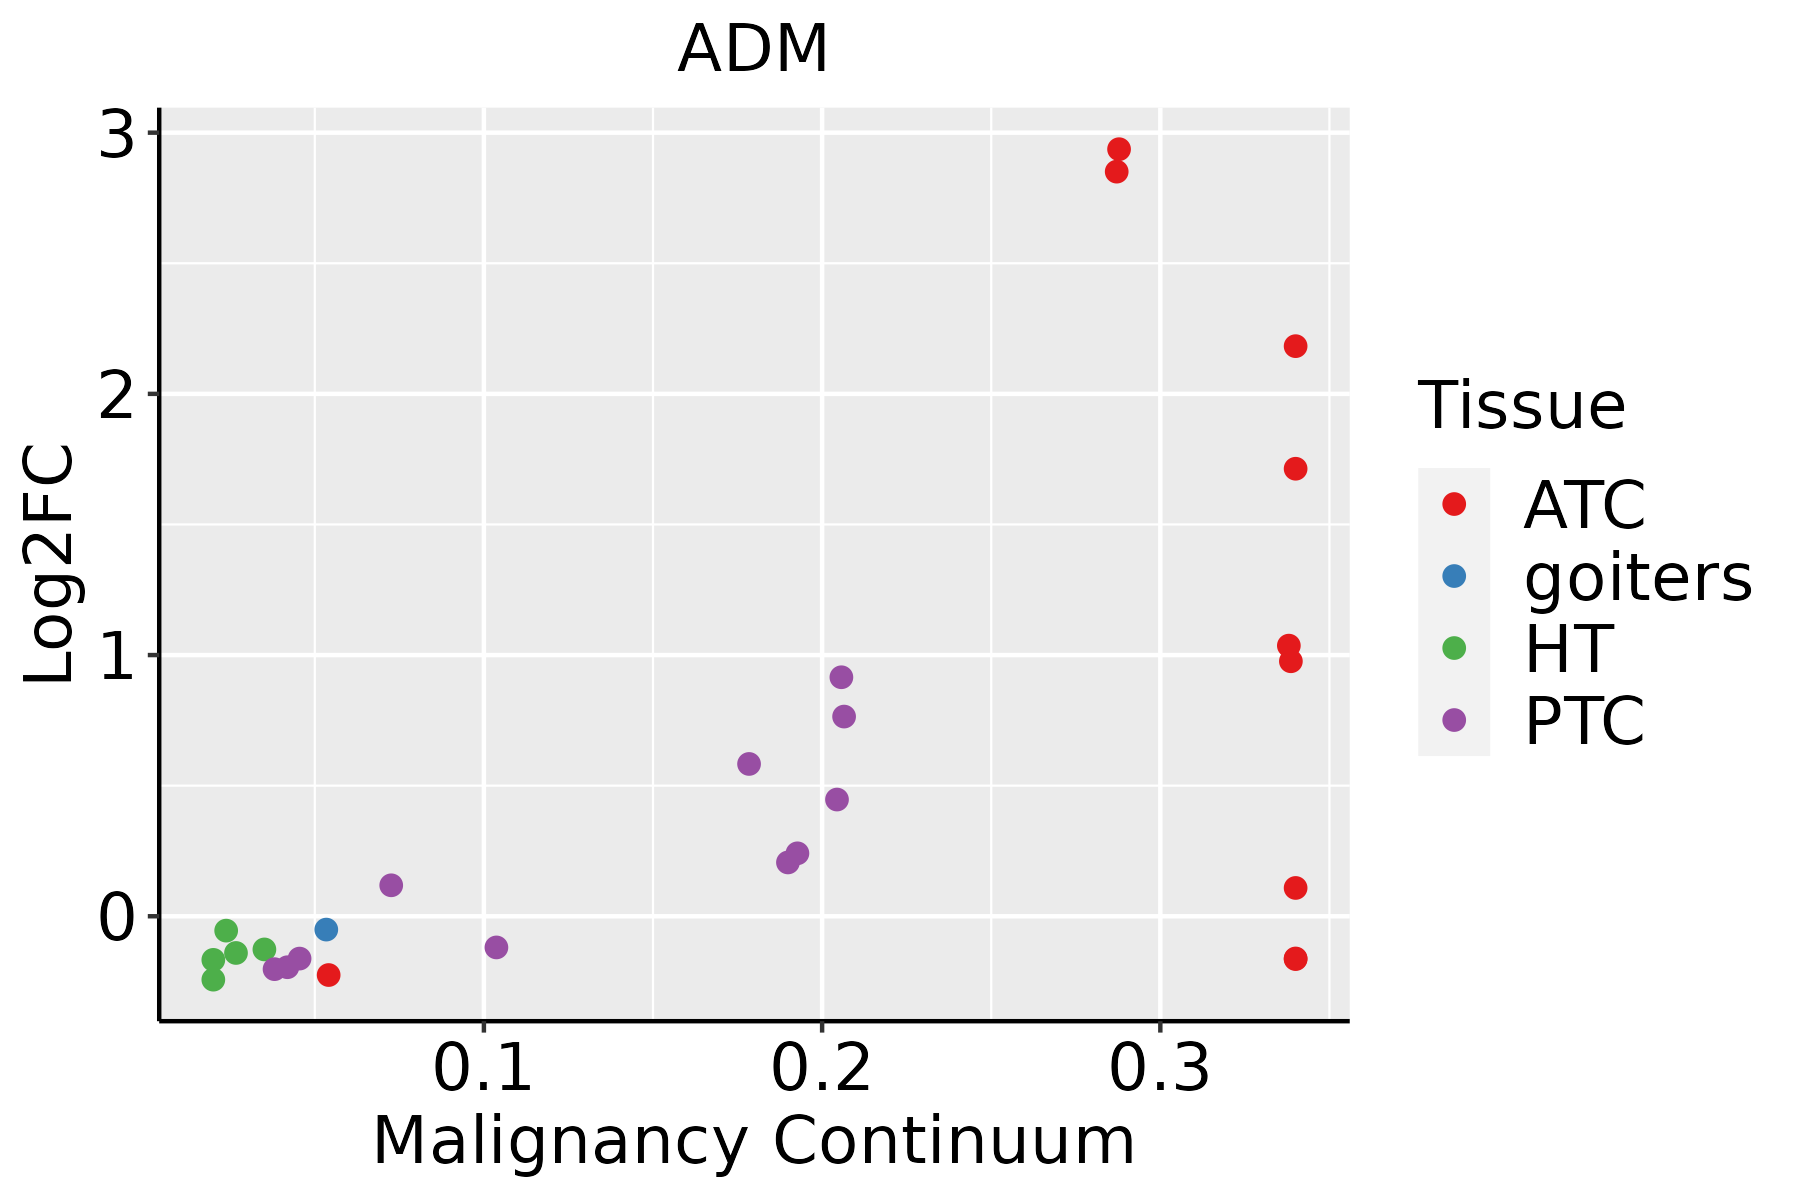 | ATC: Anaplastic thyroid cancer |
| HT: Hashimoto's thyroiditis | ||
| PTC: Papillary thyroid cancer |
| ∗log2FC in expression of this searched gene in stem-like cells from each diseased tissue sample relative to stem-like cells in normal samples in each tissue plotted against the malignancy continuum. Samples are colored based on if they are from different disease stage. |
Top |
Malignant transformation related pathway analysis |
| Find out the enriched GO biological processes and KEGG pathways involved in transition from healthy to precancer to cancer |
| Tissue | Disease Stage | Enriched GO biological Processes |
| Colorectum | AD |  |
| Colorectum | SER |  |
| Colorectum | MSS |  |
| Colorectum | MSI-H |  |
| Colorectum | FAP |  |
| ∗Top 15 enriched GO BP terms are showed in the bar plot of each disease state in each tissue. Each row represents a significant GO biological process which is colored according to the -log10(p.adjust). |
| Page: 1 2 3 4 5 6 7 8 9 |
| GO ID | Tissue | Disease Stage | Description | Gene Ratio | Bg Ratio | pvalue | p.adjust | Count |
| GO:00704822 | Colorectum | MSS | response to oxygen levels | 85/3467 | 347/18723 | 3.08e-03 | 2.34e-02 | 85 |
| GO:00607132 | Colorectum | MSS | labyrinthine layer morphogenesis | 10/3467 | 22/18723 | 3.42e-03 | 2.56e-02 | 10 |
| GO:00606702 | Colorectum | MSS | branching involved in labyrinthine layer morphogenesis | 7/3467 | 13/18723 | 4.46e-03 | 3.15e-02 | 7 |
| GO:00031581 | Colorectum | MSS | endothelium development | 38/3467 | 136/18723 | 4.53e-03 | 3.19e-02 | 38 |
| GO:00016662 | Colorectum | MSS | response to hypoxia | 75/3467 | 307/18723 | 5.56e-03 | 3.78e-02 | 75 |
| GO:00485681 | Colorectum | MSS | embryonic organ development | 100/3467 | 427/18723 | 6.00e-03 | 4.03e-02 | 100 |
| GO:0062013 | Colorectum | MSS | positive regulation of small molecule metabolic process | 39/3467 | 143/18723 | 6.34e-03 | 4.23e-02 | 39 |
| GO:0031099 | Colorectum | MSS | regeneration | 51/3467 | 198/18723 | 6.99e-03 | 4.49e-02 | 51 |
| GO:00316231 | Colorectum | MSS | receptor internalization | 32/3467 | 113/18723 | 7.02e-03 | 4.50e-02 | 32 |
| GO:00454461 | Colorectum | MSS | endothelial cell differentiation | 33/3467 | 118/18723 | 7.66e-03 | 4.81e-02 | 33 |
| GO:00226043 | Colorectum | MSI-H | regulation of cell morphogenesis | 45/1319 | 309/18723 | 2.70e-06 | 1.54e-04 | 45 |
| GO:00432543 | Colorectum | MSI-H | regulation of protein-containing complex assembly | 56/1319 | 428/18723 | 5.25e-06 | 2.70e-04 | 56 |
| GO:19000243 | Colorectum | MSI-H | regulation of substrate adhesion-dependent cell spreading | 15/1319 | 57/18723 | 6.36e-06 | 3.18e-04 | 15 |
| GO:19000263 | Colorectum | MSI-H | positive regulation of substrate adhesion-dependent cell spreading | 12/1319 | 41/18723 | 1.65e-05 | 7.10e-04 | 12 |
| GO:00329703 | Colorectum | MSI-H | regulation of actin filament-based process | 49/1319 | 397/18723 | 8.99e-05 | 2.90e-03 | 49 |
| GO:00459363 | Colorectum | MSI-H | negative regulation of phosphate metabolic process | 53/1319 | 441/18723 | 9.54e-05 | 3.01e-03 | 53 |
| GO:00322713 | Colorectum | MSI-H | regulation of protein polymerization | 33/1319 | 233/18723 | 9.65e-05 | 3.03e-03 | 33 |
| GO:00105633 | Colorectum | MSI-H | negative regulation of phosphorus metabolic process | 53/1319 | 442/18723 | 1.01e-04 | 3.16e-03 | 53 |
| GO:00726593 | Colorectum | MSI-H | protein localization to plasma membrane | 38/1319 | 284/18723 | 1.03e-04 | 3.18e-03 | 38 |
| GO:00344463 | Colorectum | MSI-H | substrate adhesion-dependent cell spreading | 19/1319 | 108/18723 | 1.80e-04 | 4.93e-03 | 19 |
| Page: 1 2 3 4 5 6 7 8 9 10 11 12 13 14 15 16 17 18 19 20 21 22 23 24 25 26 27 28 29 30 31 32 33 34 35 36 37 38 39 40 41 42 43 44 45 46 47 48 49 50 51 52 53 54 55 56 57 58 59 60 61 62 63 64 65 66 67 68 69 70 71 72 73 74 75 76 77 78 79 80 81 82 83 84 85 86 87 88 89 90 91 92 93 94 95 96 97 98 |
| Pathway ID | Tissue | Disease Stage | Description | Gene Ratio | Bg Ratio | pvalue | p.adjust | qvalue | Count |
| Page: 1 |
Top |
Cell-cell communication analysis |
| Identification of potential cell-cell interactions between two cell types and their ligand-receptor pairs for different disease states |
| Ligand | Receptor | LRpair | Pathway | Tissue | Disease Stage |
| ADM | CALCRL | ADM_CALCRL | CALCR | Breast | ADJ |
| ADM | CALCRL | ADM_CALCRL | CALCR | Breast | DCIS |
| CADM1 | CADM1 | CADM1_CADM1 | CADM | Breast | DCIS |
| ADM | CALCRL | ADM_CALCRL | CALCR | Breast | Healthy |
| ADM | CALCRL | ADM_CALCRL | CALCR | Breast | IDC |
| CADM1 | CADM1 | CADM1_CADM1 | CADM | Breast | IDC |
| ADM | CALCRL | ADM_CALCRL | CALCR | Breast | Precancer |
| ADM | CALCRL | ADM_CALCRL | CALCR | Cervix | ADJ |
| ADM | CALCRL | ADM_CALCRL | CALCR | Cervix | CC |
| ADM | CALCRL | ADM_CALCRL | CALCR | Cervix | Precancer |
| CADM1 | CADM1 | CADM1_CADM1 | CADM | Cervix | Precancer |
| CADM1 | CADM1 | CADM1_CADM1 | CADM | CRC | ADJ |
| CADM1 | CADM1 | CADM1_CADM1 | CADM | CRC | CRC |
| CADM1 | CADM1 | CADM1_CADM1 | CADM | CRC | FAP |
| CADM1 | CADM1 | CADM1_CADM1 | CADM | Endometrium | ADJ |
| ADM | CALCRL | ADM_CALCRL | CALCR | Endometrium | AEH |
| CADM1 | CADM1 | CADM1_CADM1 | CADM | Endometrium | AEH |
| ADM | CALCRL | ADM_CALCRL | CALCR | Endometrium | EEC |
| CADM1 | CADM1 | CADM1_CADM1 | CADM | Endometrium | EEC |
| ADM | CALCRL | ADM_CALCRL | CALCR | Endometrium | Healthy |
| Page: 1 2 |
Top |
Single-cell gene regulatory network inference analysis |
| Find out the significant the regulons (TFs) and the target genes of each regulon across cell types for different disease states |
| TF | Cell Type | Tissue | Disease Stage | Target Gene | RSS | Regulon Activity |
| ∗The dot plots of a searched regulon are shown for all cell subpopulations in each disease state of each tissue based on the regulon specific score inferred using pySCENIC and by calculating the average expression. |
| Page: 1 |
Top |
Somatic mutation of malignant transformation related genes |
| Annotation of somatic variants for genes involved in malignant transformation |
| Hugo Symbol | Variant Class | Variant Classification | dbSNP RS | HGVSc | HGVSp | HGVSp Short | SWISSPROT | BIOTYPE | SIFT | PolyPhen | Tumor Sample Barcode | Tissue | Histology | Sex | Age | Stage | Therapy Types | Drugs | Outcome |
| ADM | SNV | Missense_Mutation | rs770053274 | c.224N>A | p.Gly75Asp | p.G75D | P35318 | protein_coding | tolerated(0.97) | benign(0.012) | TCGA-2W-A8YY-01 | Cervix | cervical & endocervical cancer | Female | <65 | I/II | Chemotherapy | cisplatin | CR |
| ADM | SNV | Missense_Mutation | novel | c.215N>G | p.Asp72Gly | p.D72G | P35318 | protein_coding | deleterious(0.04) | possibly_damaging(0.478) | TCGA-VS-A953-01 | Cervix | cervical & endocervical cancer | Female | <65 | I/II | Unknown | Unknown | PD |
| ADM | SNV | Missense_Mutation | c.448C>T | p.Arg150Cys | p.R150C | P35318 | protein_coding | deleterious(0) | probably_damaging(1) | TCGA-A6-5661-01 | Colorectum | colon adenocarcinoma | Female | >=65 | I/II | Unknown | Unknown | SD | |
| ADM | SNV | Missense_Mutation | c.20N>T | p.Ala7Val | p.A7V | P35318 | protein_coding | deleterious(0.02) | benign(0.078) | TCGA-AA-3510-01 | Colorectum | colon adenocarcinoma | Male | >=65 | I/II | Unknown | Unknown | SD | |
| ADM | insertion | Frame_Shift_Ins | rs773405081 | c.523_524insC | p.Ser178GlufsTer19 | p.S178Efs*19 | P35318 | protein_coding | TCGA-G4-6588-01 | Colorectum | colon adenocarcinoma | Female | <65 | I/II | Unknown | Unknown | SD | ||
| ADM | insertion | Frame_Shift_Ins | rs773405081 | c.523_524insC | p.Ser178GlufsTer19 | p.S178Efs*19 | P35318 | protein_coding | TCGA-WS-AB45-01 | Colorectum | colon adenocarcinoma | Female | <65 | I/II | Unknown | Unknown | SD | ||
| ADM | SNV | Missense_Mutation | c.155N>G | p.Tyr52Cys | p.Y52C | P35318 | protein_coding | tolerated(0.16) | possibly_damaging(0.819) | TCGA-D1-A15X-01 | Endometrium | uterine corpus endometrioid carcinoma | Female | <65 | I/II | Unknown | Unknown | SD | |
| ADM | SNV | Missense_Mutation | novel | c.553N>A | p.Leu185Ile | p.L185I | P35318 | protein_coding | deleterious_low_confidence(0) | benign(0.011) | TCGA-E6-A1LX-01 | Endometrium | uterine corpus endometrioid carcinoma | Female | <65 | I/II | Unknown | Unknown | SD |
| ADM | insertion | Frame_Shift_Ins | rs773405081 | c.523_524insC | p.Ser178GlufsTer19 | p.S178Efs*19 | P35318 | protein_coding | TCGA-AP-A1DO-01 | Endometrium | uterine corpus endometrioid carcinoma | Female | <65 | I/II | Unknown | Unknown | SD | ||
| ADM | insertion | Frame_Shift_Ins | rs773405081 | c.530dupC | p.Ser178GlufsTer19 | p.S178Efs*19 | P35318 | protein_coding | TCGA-EO-A22U-01 | Endometrium | uterine corpus endometrioid carcinoma | Female | >=65 | I/II | Unknown | Unknown | SD |
| Page: 1 2 |
Top |
Related drugs of malignant transformation related genes |
| Identification of chemicals and drugs interact with genes involved in malignant transfromation |
| (DGIdb 4.0) |
| Entrez ID | Symbol | Category | Interaction Types | Drug Claim Name | Drug Name | PMIDs |
| 133 | ADM | DRUGGABLE GENOME, HORMONE ACTIVITY | PD-98059 | CHEMBL35482 | 10830296 | |
| 133 | ADM | DRUGGABLE GENOME, HORMONE ACTIVITY | NSC-87877 | CHEMBL472004 | 22884224 | |
| 133 | ADM | DRUGGABLE GENOME, HORMONE ACTIVITY | INDOMETHACIN | INDOMETHACIN | 10830296 | |
| 133 | ADM | DRUGGABLE GENOME, HORMONE ACTIVITY | NSC-106221 | CHEMBL2063510 | 22884224 | |
| 133 | ADM | DRUGGABLE GENOME, HORMONE ACTIVITY | paroxetine | PAROXETINE | 19636336 | |
| 133 | ADM | DRUGGABLE GENOME, HORMONE ACTIVITY | INSULIN | INSULIN | 12668590 | |
| 133 | ADM | DRUGGABLE GENOME, HORMONE ACTIVITY | TPA | ALTEPLASE | 10848972 |
| Page: 1 |

Copyright 2023-Present -The University of Texas Health Science Center at Houston |