
|
|||||
|
 | |
| |
| |
| |
| |
| |
|
Gene: TFRC |
Gene summary for TFRC |
| Gene information | Species | Human | Gene symbol | TFRC | Gene ID | 7037 |
| Gene name | transferrin receptor | |
| Gene Alias | CD71 | |
| Cytomap | 3q29 | |
| Gene Type | protein-coding | GO ID | GO:0000018 | UniProtAcc | P02786 |
Top |
Malignant transformation analysis |
| Identification of the aberrant gene expression in precancerous and cancerous lesions by comparing the gene expression of stem-like cells in diseased tissues with normal stem cells |
| Entrez ID | Symbol | Replicates | Species | Organ | Tissue | Adj P-value | Log2FC | Malignancy |
| 7037 | TFRC | CA_HPV_1 | Human | Cervix | CC | 2.97e-03 | 2.03e-01 | 0.0264 |
| 7037 | TFRC | CA_HPV_2 | Human | Cervix | CC | 3.34e-03 | 3.43e-01 | 0.0391 |
| 7037 | TFRC | CCI_2 | Human | Cervix | CC | 1.20e-15 | 1.68e+00 | 0.5249 |
| 7037 | TFRC | CCI_3 | Human | Cervix | CC | 1.78e-12 | 1.01e+00 | 0.516 |
| 7037 | TFRC | HTA11_3410_2000001011 | Human | Colorectum | AD | 7.23e-04 | -3.30e-01 | 0.0155 |
| 7037 | TFRC | HTA11_866_3004761011 | Human | Colorectum | AD | 4.22e-02 | -3.02e-01 | 0.096 |
| 7037 | TFRC | HTA11_99999970781_79442 | Human | Colorectum | MSS | 5.25e-08 | 6.93e-01 | 0.294 |
| 7037 | TFRC | HTA11_99999965062_69753 | Human | Colorectum | MSI-H | 4.91e-07 | 1.28e+00 | 0.3487 |
| 7037 | TFRC | HTA11_99999965104_69814 | Human | Colorectum | MSS | 1.16e-08 | 8.95e-01 | 0.281 |
| 7037 | TFRC | F007 | Human | Colorectum | FAP | 2.54e-03 | -3.41e-01 | 0.1176 |
| 7037 | TFRC | A001-C-207 | Human | Colorectum | FAP | 2.23e-03 | -2.21e-01 | 0.1278 |
| 7037 | TFRC | A015-C-203 | Human | Colorectum | FAP | 2.88e-15 | -2.38e-01 | -0.1294 |
| 7037 | TFRC | A015-C-204 | Human | Colorectum | FAP | 3.12e-06 | -2.56e-01 | -0.0228 |
| 7037 | TFRC | A014-C-040 | Human | Colorectum | FAP | 8.46e-03 | -3.76e-01 | -0.1184 |
| 7037 | TFRC | A002-C-201 | Human | Colorectum | FAP | 4.14e-11 | -1.88e-01 | 0.0324 |
| 7037 | TFRC | A002-C-203 | Human | Colorectum | FAP | 1.37e-02 | -1.92e-01 | 0.2786 |
| 7037 | TFRC | A001-C-119 | Human | Colorectum | FAP | 5.12e-11 | -3.69e-01 | -0.1557 |
| 7037 | TFRC | A001-C-108 | Human | Colorectum | FAP | 3.67e-10 | -3.13e-01 | -0.0272 |
| 7037 | TFRC | A002-C-205 | Human | Colorectum | FAP | 7.54e-18 | -3.43e-01 | -0.1236 |
| 7037 | TFRC | A015-C-005 | Human | Colorectum | FAP | 3.44e-03 | -2.13e-01 | -0.0336 |
| Page: 1 2 3 4 5 6 7 8 |
| Tissue | Expression Dynamics | Abbreviation |
| Cervix | 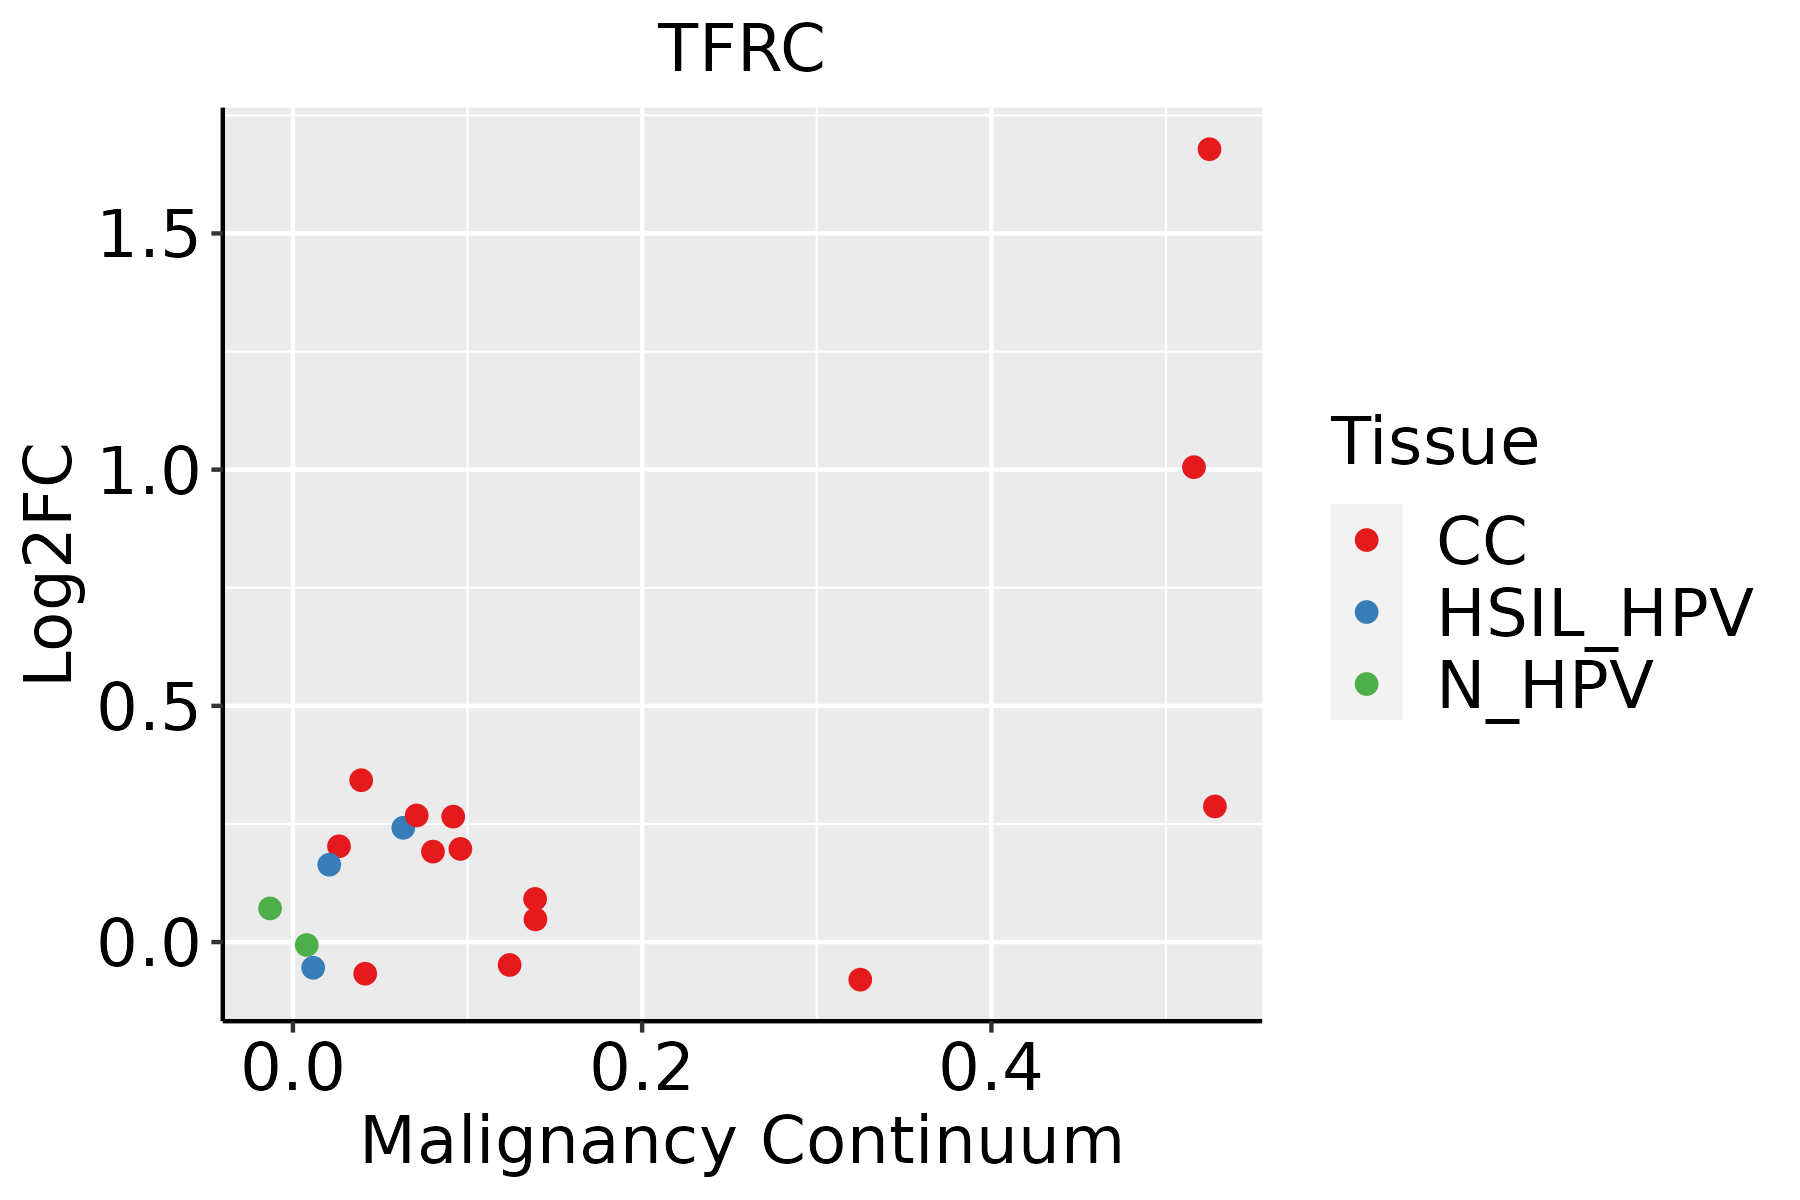 | CC: Cervix cancer |
| HSIL_HPV: HPV-infected high-grade squamous intraepithelial lesions | ||
| N_HPV: HPV-infected normal cervix | ||
| Colorectum (GSE201348) | 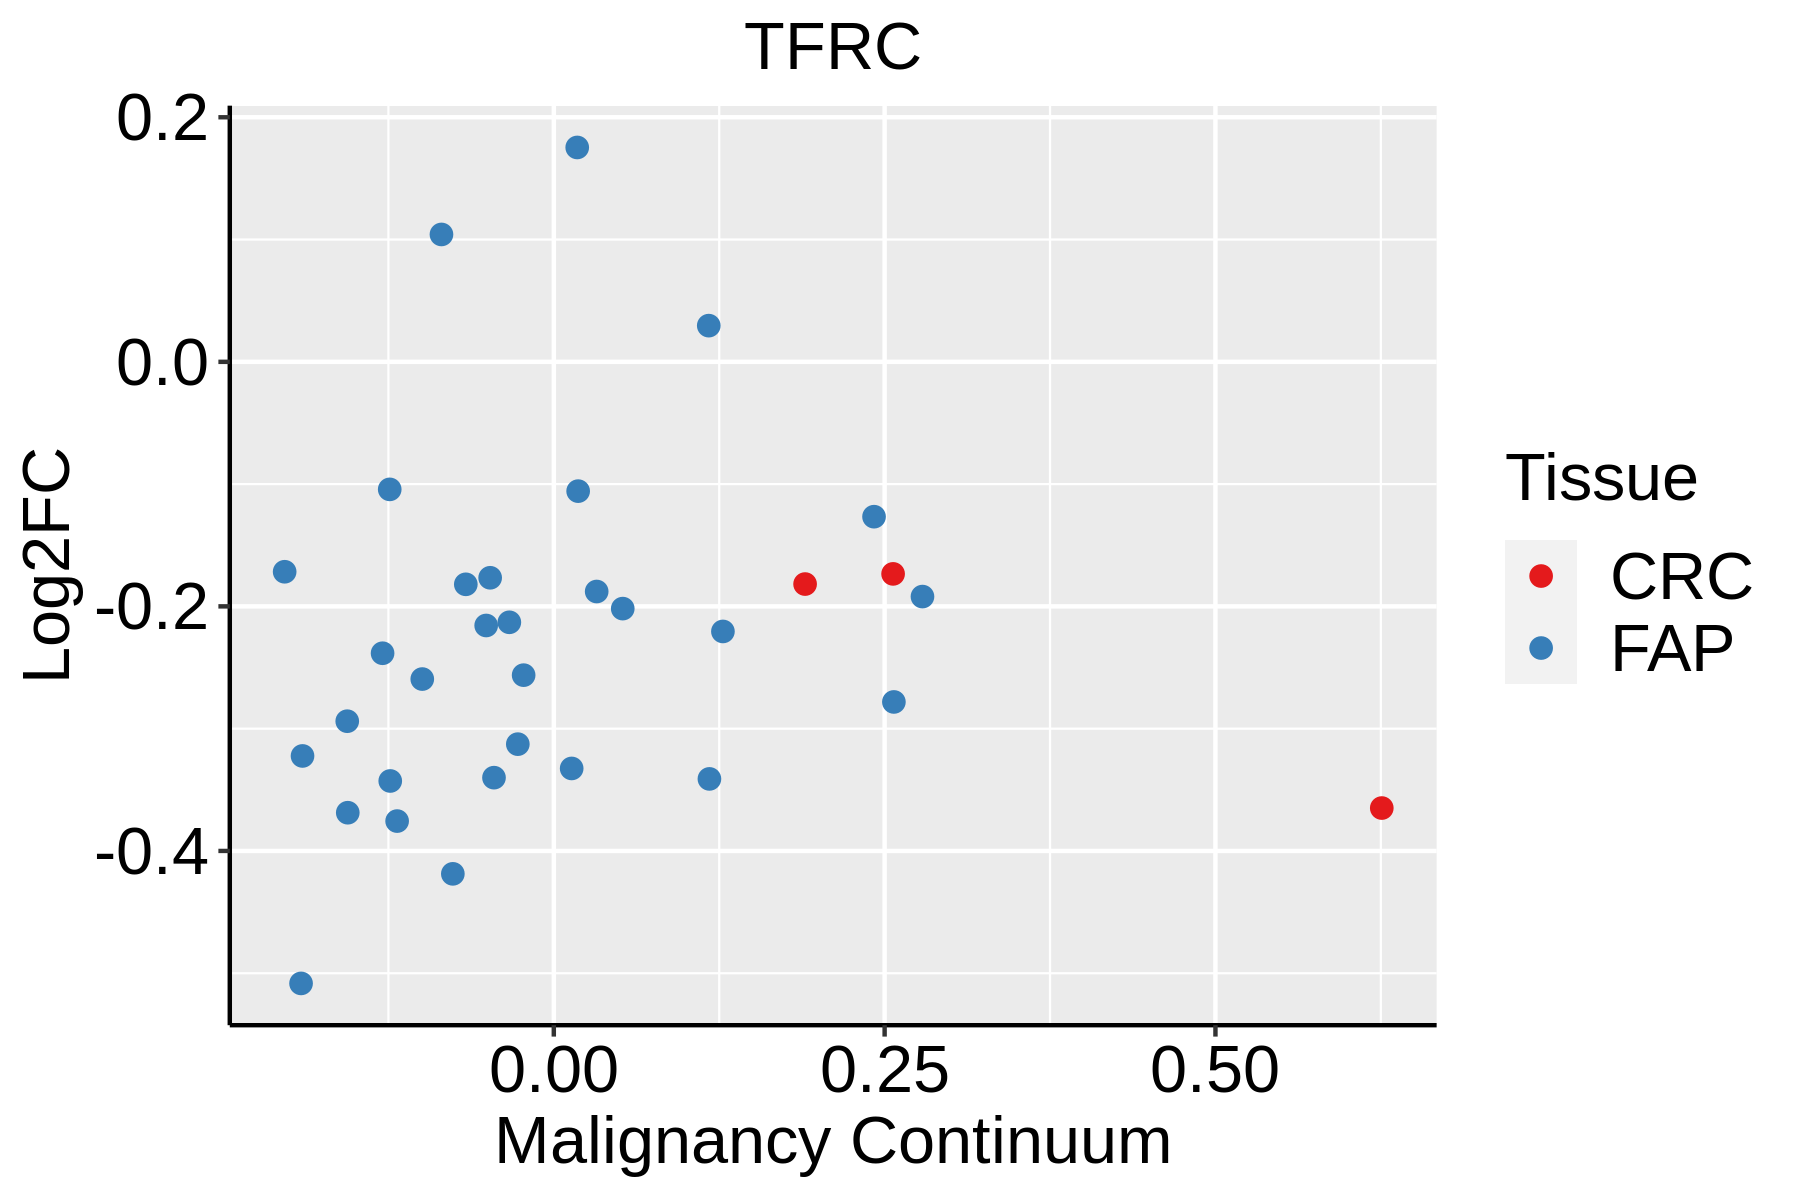 | FAP: Familial adenomatous polyposis |
| CRC: Colorectal cancer | ||
| Colorectum (HTA11) |  | AD: Adenomas |
| SER: Sessile serrated lesions | ||
| MSI-H: Microsatellite-high colorectal cancer | ||
| MSS: Microsatellite stable colorectal cancer | ||
| Endometrium | 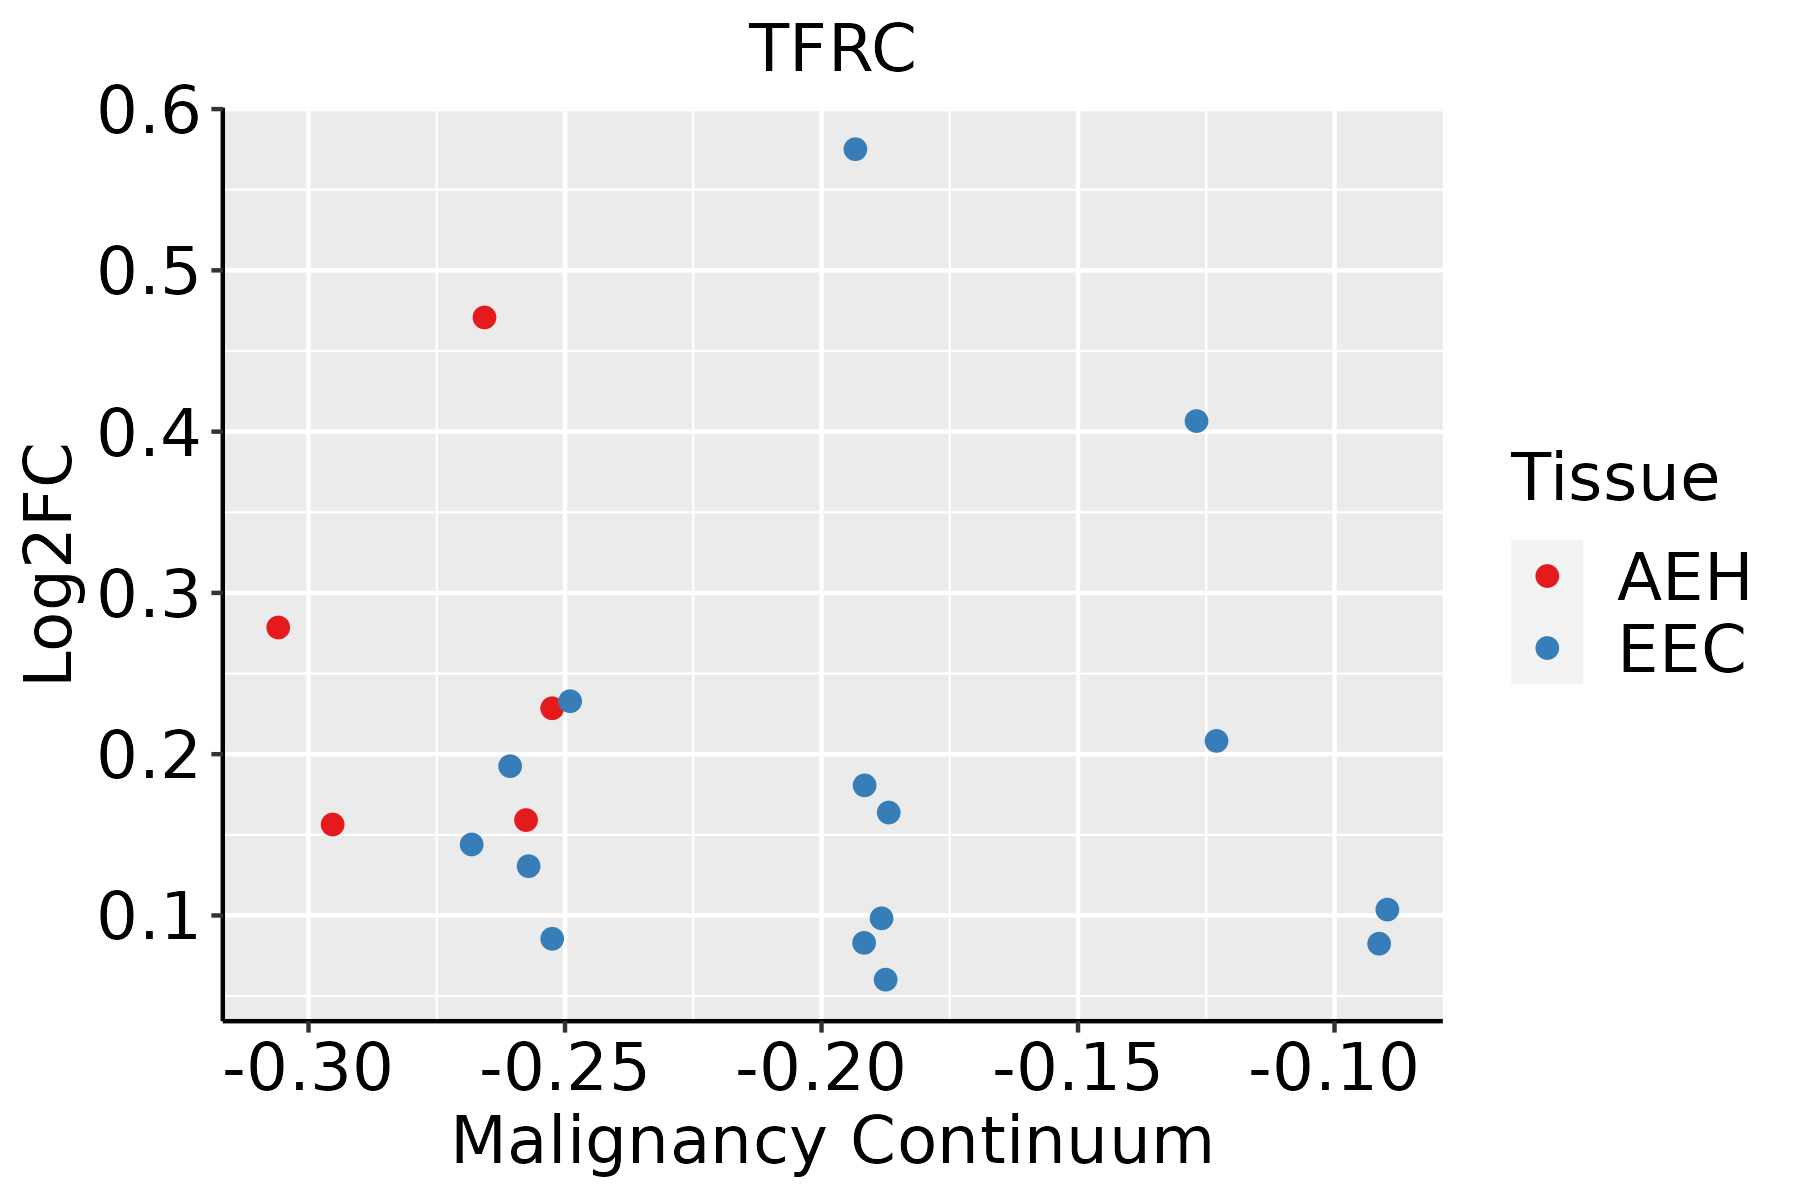 | AEH: Atypical endometrial hyperplasia |
| EEC: Endometrioid Cancer | ||
| Esophagus |  | ESCC: Esophageal squamous cell carcinoma |
| HGIN: High-grade intraepithelial neoplasias | ||
| LGIN: Low-grade intraepithelial neoplasias | ||
| Liver | 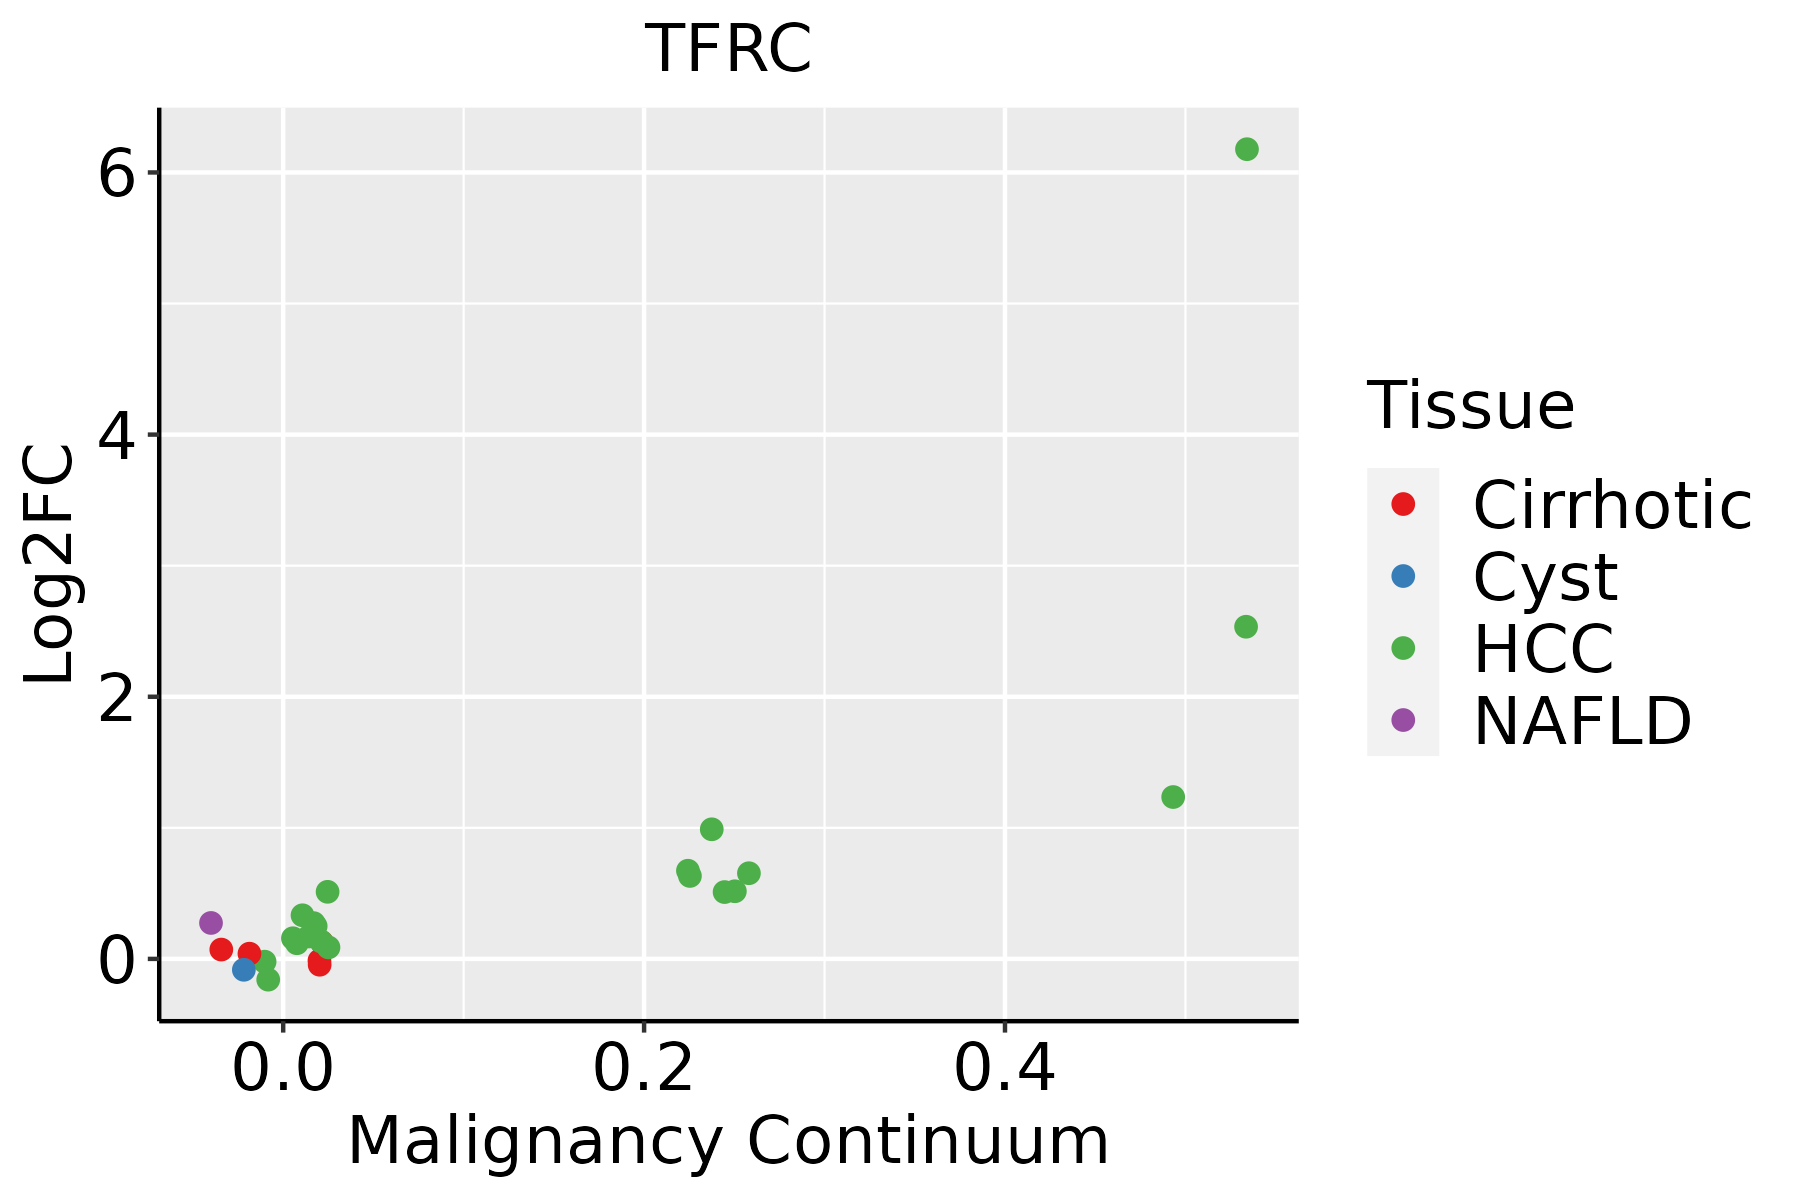 | HCC: Hepatocellular carcinoma |
| NAFLD: Non-alcoholic fatty liver disease | ||
| Oral Cavity | 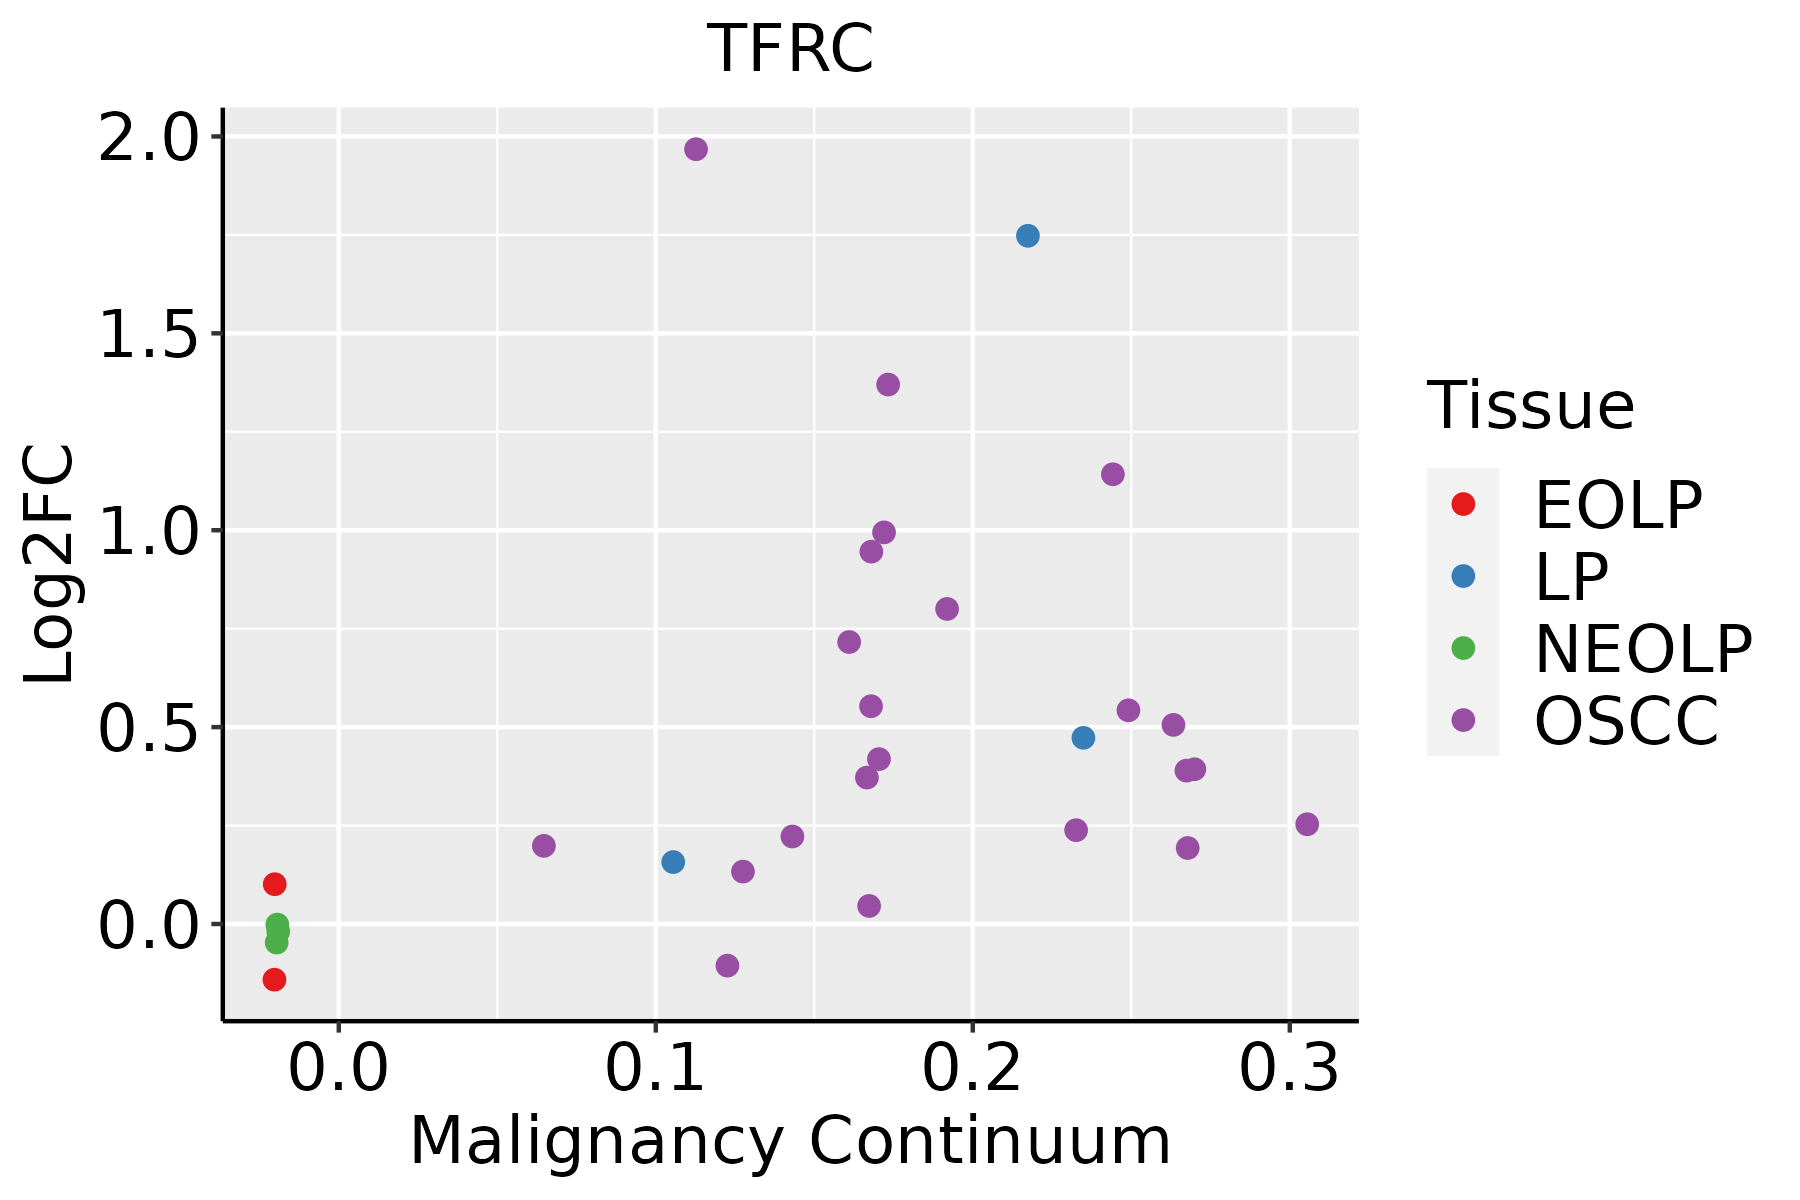 | EOLP: Erosive Oral lichen planus |
| LP: leukoplakia | ||
| NEOLP: Non-erosive oral lichen planus | ||
| OSCC: Oral squamous cell carcinoma | ||
| Skin |  | AK: Actinic keratosis |
| cSCC: Cutaneous squamous cell carcinoma | ||
| SCCIS:squamous cell carcinoma in situ |
| ∗log2FC in expression of this searched gene in stem-like cells from each diseased tissue sample relative to stem-like cells in normal samples in each tissue plotted against the malignancy continuum. Samples are colored based on if they are from different disease stage. |
Top |
Malignant transformation related pathway analysis |
| Find out the enriched GO biological processes and KEGG pathways involved in transition from healthy to precancer to cancer |
| Tissue | Disease Stage | Enriched GO biological Processes |
| Colorectum | AD |  |
| Colorectum | SER |  |
| Colorectum | MSS |  |
| Colorectum | MSI-H |  |
| Colorectum | FAP |  |
| ∗Top 15 enriched GO BP terms are showed in the bar plot of each disease state in each tissue. Each row represents a significant GO biological process which is colored according to the -log10(p.adjust). |
| Page: 1 2 3 4 5 6 7 8 9 |
| GO ID | Tissue | Disease Stage | Description | Gene Ratio | Bg Ratio | pvalue | p.adjust | Count |
| GO:005105414 | Oral cavity | OSCC | positive regulation of DNA metabolic process | 126/7305 | 201/18723 | 8.12e-12 | 3.01e-10 | 126 |
| GO:003009920 | Oral cavity | OSCC | myeloid cell differentiation | 213/7305 | 381/18723 | 1.24e-11 | 4.42e-10 | 213 |
| GO:005170120 | Oral cavity | OSCC | biological process involved in interaction with host | 125/7305 | 203/18723 | 5.60e-11 | 1.74e-09 | 125 |
| GO:001063918 | Oral cavity | OSCC | negative regulation of organelle organization | 190/7305 | 348/18723 | 2.12e-09 | 4.97e-08 | 190 |
| GO:005212620 | Oral cavity | OSCC | movement in host environment | 106/7305 | 175/18723 | 5.84e-09 | 1.26e-07 | 106 |
| GO:004578520 | Oral cavity | OSCC | positive regulation of cell adhesion | 225/7305 | 437/18723 | 6.06e-08 | 1.09e-06 | 225 |
| GO:000257310 | Oral cavity | OSCC | myeloid leukocyte differentiation | 119/7305 | 208/18723 | 7.29e-08 | 1.29e-06 | 119 |
| GO:004211016 | Oral cavity | OSCC | T cell activation | 245/7305 | 487/18723 | 2.00e-07 | 3.22e-06 | 245 |
| GO:00510907 | Oral cavity | OSCC | regulation of DNA-binding transcription factor activity | 221/7305 | 440/18723 | 9.06e-07 | 1.23e-05 | 221 |
| GO:00182098 | Oral cavity | OSCC | peptidyl-serine modification | 175/7305 | 338/18723 | 1.09e-06 | 1.46e-05 | 175 |
| GO:001810510 | Oral cavity | OSCC | peptidyl-serine phosphorylation | 164/7305 | 315/18723 | 1.51e-06 | 1.99e-05 | 164 |
| GO:005507610 | Oral cavity | OSCC | transition metal ion homeostasis | 81/7305 | 138/18723 | 2.13e-06 | 2.72e-05 | 81 |
| GO:00482843 | Oral cavity | OSCC | organelle fusion | 82/7305 | 141/18723 | 3.08e-06 | 3.72e-05 | 82 |
| GO:004440920 | Oral cavity | OSCC | entry into host | 86/7305 | 151/18723 | 5.74e-06 | 6.37e-05 | 86 |
| GO:19908237 | Oral cavity | OSCC | response to leukemia inhibitory factor | 58/7305 | 95/18723 | 1.10e-05 | 1.14e-04 | 58 |
| GO:00108239 | Oral cavity | OSCC | negative regulation of mitochondrion organization | 34/7305 | 49/18723 | 1.59e-05 | 1.59e-04 | 34 |
| GO:002240718 | Oral cavity | OSCC | regulation of cell-cell adhesion | 218/7305 | 448/18723 | 1.71e-05 | 1.68e-04 | 218 |
| GO:19908307 | Oral cavity | OSCC | cellular response to leukemia inhibitory factor | 57/7305 | 94/18723 | 1.75e-05 | 1.71e-04 | 57 |
| GO:004671820 | Oral cavity | OSCC | viral entry into host cell | 81/7305 | 144/18723 | 1.98e-05 | 1.89e-04 | 81 |
| GO:00510917 | Oral cavity | OSCC | positive regulation of DNA-binding transcription factor activity | 134/7305 | 260/18723 | 2.52e-05 | 2.35e-04 | 134 |
| Page: 1 2 3 4 5 6 7 8 9 10 11 12 13 14 15 16 17 18 19 20 21 22 23 24 25 26 27 28 29 30 31 32 33 |
| Pathway ID | Tissue | Disease Stage | Description | Gene Ratio | Bg Ratio | pvalue | p.adjust | qvalue | Count |
| hsa0414520 | Cervix | CC | Phagosome | 47/1267 | 152/8465 | 3.95e-07 | 4.26e-06 | 2.52e-06 | 47 |
| hsa0414418 | Cervix | CC | Endocytosis | 64/1267 | 251/8465 | 6.97e-06 | 6.10e-05 | 3.61e-05 | 64 |
| hsa0421614 | Cervix | CC | Ferroptosis | 14/1267 | 41/8465 | 1.75e-03 | 7.21e-03 | 4.26e-03 | 14 |
| hsa0406618 | Cervix | CC | HIF-1 signaling pathway | 27/1267 | 109/8465 | 4.72e-03 | 1.64e-02 | 9.72e-03 | 27 |
| hsa04145110 | Cervix | CC | Phagosome | 47/1267 | 152/8465 | 3.95e-07 | 4.26e-06 | 2.52e-06 | 47 |
| hsa0414419 | Cervix | CC | Endocytosis | 64/1267 | 251/8465 | 6.97e-06 | 6.10e-05 | 3.61e-05 | 64 |
| hsa0421615 | Cervix | CC | Ferroptosis | 14/1267 | 41/8465 | 1.75e-03 | 7.21e-03 | 4.26e-03 | 14 |
| hsa0406619 | Cervix | CC | HIF-1 signaling pathway | 27/1267 | 109/8465 | 4.72e-03 | 1.64e-02 | 9.72e-03 | 27 |
| hsa04144 | Colorectum | AD | Endocytosis | 111/2092 | 251/8465 | 5.95e-12 | 1.42e-10 | 9.08e-11 | 111 |
| hsa04066 | Colorectum | AD | HIF-1 signaling pathway | 48/2092 | 109/8465 | 7.25e-06 | 7.84e-05 | 5.00e-05 | 48 |
| hsa04216 | Colorectum | AD | Ferroptosis | 21/2092 | 41/8465 | 2.23e-04 | 1.78e-03 | 1.13e-03 | 21 |
| hsa041441 | Colorectum | AD | Endocytosis | 111/2092 | 251/8465 | 5.95e-12 | 1.42e-10 | 9.08e-11 | 111 |
| hsa040661 | Colorectum | AD | HIF-1 signaling pathway | 48/2092 | 109/8465 | 7.25e-06 | 7.84e-05 | 5.00e-05 | 48 |
| hsa042161 | Colorectum | AD | Ferroptosis | 21/2092 | 41/8465 | 2.23e-04 | 1.78e-03 | 1.13e-03 | 21 |
| hsa041444 | Colorectum | MSS | Endocytosis | 102/1875 | 251/8465 | 1.85e-11 | 4.43e-10 | 2.71e-10 | 102 |
| hsa040664 | Colorectum | MSS | HIF-1 signaling pathway | 39/1875 | 109/8465 | 7.61e-04 | 5.00e-03 | 3.06e-03 | 39 |
| hsa042162 | Colorectum | MSS | Ferroptosis | 18/1875 | 41/8465 | 1.53e-03 | 8.53e-03 | 5.23e-03 | 18 |
| hsa041445 | Colorectum | MSS | Endocytosis | 102/1875 | 251/8465 | 1.85e-11 | 4.43e-10 | 2.71e-10 | 102 |
| hsa040665 | Colorectum | MSS | HIF-1 signaling pathway | 39/1875 | 109/8465 | 7.61e-04 | 5.00e-03 | 3.06e-03 | 39 |
| hsa042163 | Colorectum | MSS | Ferroptosis | 18/1875 | 41/8465 | 1.53e-03 | 8.53e-03 | 5.23e-03 | 18 |
| Page: 1 2 3 4 5 |
Top |
Cell-cell communication analysis |
| Identification of potential cell-cell interactions between two cell types and their ligand-receptor pairs for different disease states |
| Ligand | Receptor | LRpair | Pathway | Tissue | Disease Stage |
| Page: 1 |
Top |
Single-cell gene regulatory network inference analysis |
| Find out the significant the regulons (TFs) and the target genes of each regulon across cell types for different disease states |
| TF | Cell Type | Tissue | Disease Stage | Target Gene | RSS | Regulon Activity |
| ∗The dot plots of a searched regulon are shown for all cell subpopulations in each disease state of each tissue based on the regulon specific score inferred using pySCENIC and by calculating the average expression. |
| Page: 1 |
Top |
Somatic mutation of malignant transformation related genes |
| Annotation of somatic variants for genes involved in malignant transformation |
| Hugo Symbol | Variant Class | Variant Classification | dbSNP RS | HGVSc | HGVSp | HGVSp Short | SWISSPROT | BIOTYPE | SIFT | PolyPhen | Tumor Sample Barcode | Tissue | Histology | Sex | Age | Stage | Therapy Types | Drugs | Outcome |
| TFRC | SNV | Missense_Mutation | rs769366579 | c.1511C>T | p.Thr504Met | p.T504M | P02786 | protein_coding | deleterious(0.05) | benign(0.055) | TCGA-AN-A0FZ-01 | Breast | breast invasive carcinoma | Female | <65 | III/IV | Unknown | Unknown | SD |
| TFRC | SNV | Missense_Mutation | novel | c.145N>T | p.Asp49Tyr | p.D49Y | P02786 | protein_coding | deleterious(0.01) | possibly_damaging(0.819) | TCGA-D8-A27V-01 | Breast | breast invasive carcinoma | Female | <65 | I/II | Hormone Therapy | tamoxiphen | SD |
| TFRC | insertion | Frame_Shift_Ins | novel | c.1815_1816insTTCCCCTATAGGGACATTTTCCCCCAAAAGGA | p.Glu606PhefsTer13 | p.E606Ffs*13 | P02786 | protein_coding | TCGA-AN-A0FX-01 | Breast | breast invasive carcinoma | Female | <65 | I/II | Unknown | Unknown | SD | ||
| TFRC | SNV | Missense_Mutation | rs41298067 | c.2030G>A | p.Arg677His | p.R677H | P02786 | protein_coding | deleterious(0) | probably_damaging(1) | TCGA-2W-A8YY-01 | Cervix | cervical & endocervical cancer | Female | <65 | I/II | Chemotherapy | cisplatin | CR |
| TFRC | SNV | Missense_Mutation | novel | c.323T>C | p.Val108Ala | p.V108A | P02786 | protein_coding | tolerated(0.85) | benign(0) | TCGA-2W-A8YY-01 | Cervix | cervical & endocervical cancer | Female | <65 | I/II | Chemotherapy | cisplatin | CR |
| TFRC | SNV | Missense_Mutation | novel | c.2249N>T | p.Ser750Phe | p.S750F | P02786 | protein_coding | deleterious(0.02) | possibly_damaging(0.882) | TCGA-VS-A8EL-01 | Cervix | cervical & endocervical cancer | Female | <65 | I/II | Chemotherapy | cisplatin | CR |
| TFRC | SNV | Missense_Mutation | rs764730449 | c.2155N>T | p.Arg719Cys | p.R719C | P02786 | protein_coding | tolerated(0.14) | probably_damaging(0.981) | TCGA-VS-A94Z-01 | Cervix | cervical & endocervical cancer | Female | <65 | I/II | Chemotherapy | cisplatin | CR |
| TFRC | SNV | Missense_Mutation | novel | c.349N>G | p.Leu117Val | p.L117V | protein_coding | deleterious_low_confidence(0.02) | unknown(0) | TCGA-VS-A958-01 | Cervix | cervical & endocervical cancer | Female | <65 | I/II | Chemotherapy | cisplatin | CR | |
| TFRC | SNV | Missense_Mutation | rs370784605 | c.395C>T | p.Ser132Leu | p.S132L | P02786 | protein_coding | deleterious(0.02) | probably_damaging(0.976) | TCGA-VS-A9UL-01 | Cervix | cervical & endocervical cancer | Female | >=65 | III/IV | Unknown | Unknown | PD |
| TFRC | SNV | Missense_Mutation | rs772641140 | c.362N>A | p.Arg121His | p.R121H | P02786 | protein_coding | tolerated(0.57) | benign(0) | TCGA-AA-A00N-01 | Colorectum | colon adenocarcinoma | Male | >=65 | I/II | Unknown | Unknown | PD |
| Page: 1 2 3 4 5 6 7 8 |
Top |
Related drugs of malignant transformation related genes |
| Identification of chemicals and drugs interact with genes involved in malignant transfromation |
| (DGIdb 4.0) |
| Entrez ID | Symbol | Category | Interaction Types | Drug Claim Name | Drug Name | PMIDs |
| Page: 1 |

Copyright 2023-Present -The University of Texas Health Science Center at Houston |