
|
|||||
|
 | |
| |
| |
| |
| |
| |
|
Gene: SRSF1 |
Gene summary for SRSF1 |
| Gene information | Species | Human | Gene symbol | SRSF1 | Gene ID | 6426 |
| Gene name | serine and arginine rich splicing factor 1 | |
| Gene Alias | ASF | |
| Cytomap | 17q22 | |
| Gene Type | protein-coding | GO ID | GO:0000245 | UniProtAcc | Q07955 |
Top |
Malignant transformation analysis |
| Identification of the aberrant gene expression in precancerous and cancerous lesions by comparing the gene expression of stem-like cells in diseased tissues with normal stem cells |
| Entrez ID | Symbol | Replicates | Species | Organ | Tissue | Adj P-value | Log2FC | Malignancy |
| 6426 | SRSF1 | HTA11_2487_2000001011 | Human | Colorectum | SER | 3.78e-06 | 3.14e-01 | -0.1808 |
| 6426 | SRSF1 | HTA11_1938_2000001011 | Human | Colorectum | AD | 5.15e-17 | 6.66e-01 | -0.0811 |
| 6426 | SRSF1 | HTA11_78_2000001011 | Human | Colorectum | AD | 9.25e-15 | 5.29e-01 | -0.1088 |
| 6426 | SRSF1 | HTA11_347_2000001011 | Human | Colorectum | AD | 6.17e-16 | 4.49e-01 | -0.1954 |
| 6426 | SRSF1 | HTA11_83_2000001011 | Human | Colorectum | SER | 8.45e-10 | 5.32e-01 | -0.1526 |
| 6426 | SRSF1 | HTA11_696_2000001011 | Human | Colorectum | AD | 2.10e-03 | 2.21e-01 | -0.1464 |
| 6426 | SRSF1 | HTA11_1391_2000001011 | Human | Colorectum | AD | 2.82e-12 | 5.14e-01 | -0.059 |
| 6426 | SRSF1 | HTA11_7862_2000001011 | Human | Colorectum | AD | 5.68e-08 | 5.40e-01 | -0.0179 |
| 6426 | SRSF1 | HTA11_866_3004761011 | Human | Colorectum | AD | 3.37e-15 | 4.41e-01 | 0.096 |
| 6426 | SRSF1 | HTA11_4255_2000001011 | Human | Colorectum | SER | 1.88e-11 | 7.44e-01 | 0.0446 |
| 6426 | SRSF1 | HTA11_7663_2000001011 | Human | Colorectum | SER | 4.58e-12 | 6.51e-01 | 0.0131 |
| 6426 | SRSF1 | HTA11_10623_2000001011 | Human | Colorectum | AD | 1.10e-10 | 6.32e-01 | -0.0177 |
| 6426 | SRSF1 | HTA11_6801_2000001011 | Human | Colorectum | SER | 7.05e-09 | 9.45e-01 | 0.0171 |
| 6426 | SRSF1 | HTA11_7696_3000711011 | Human | Colorectum | AD | 7.89e-07 | 3.31e-01 | 0.0674 |
| 6426 | SRSF1 | HTA11_7469_2000001011 | Human | Colorectum | AD | 2.04e-06 | 8.44e-01 | -0.0124 |
| 6426 | SRSF1 | HTA11_6818_2000001021 | Human | Colorectum | AD | 5.11e-11 | 4.84e-01 | 0.0588 |
| 6426 | SRSF1 | HTA11_99999970781_79442 | Human | Colorectum | MSS | 6.61e-52 | 1.23e+00 | 0.294 |
| 6426 | SRSF1 | HTA11_99999965062_69753 | Human | Colorectum | MSI-H | 8.43e-06 | 7.75e-01 | 0.3487 |
| 6426 | SRSF1 | HTA11_99999965104_69814 | Human | Colorectum | MSS | 2.68e-31 | 1.04e+00 | 0.281 |
| 6426 | SRSF1 | HTA11_99999971662_82457 | Human | Colorectum | MSS | 3.53e-31 | 8.32e-01 | 0.3859 |
| Page: 1 2 3 4 5 6 7 8 9 |
| Tissue | Expression Dynamics | Abbreviation |
| Colorectum (GSE201348) |  | FAP: Familial adenomatous polyposis |
| CRC: Colorectal cancer | ||
| Colorectum (HTA11) |  | AD: Adenomas |
| SER: Sessile serrated lesions | ||
| MSI-H: Microsatellite-high colorectal cancer | ||
| MSS: Microsatellite stable colorectal cancer | ||
| Endometrium |  | AEH: Atypical endometrial hyperplasia |
| EEC: Endometrioid Cancer | ||
| Esophagus | 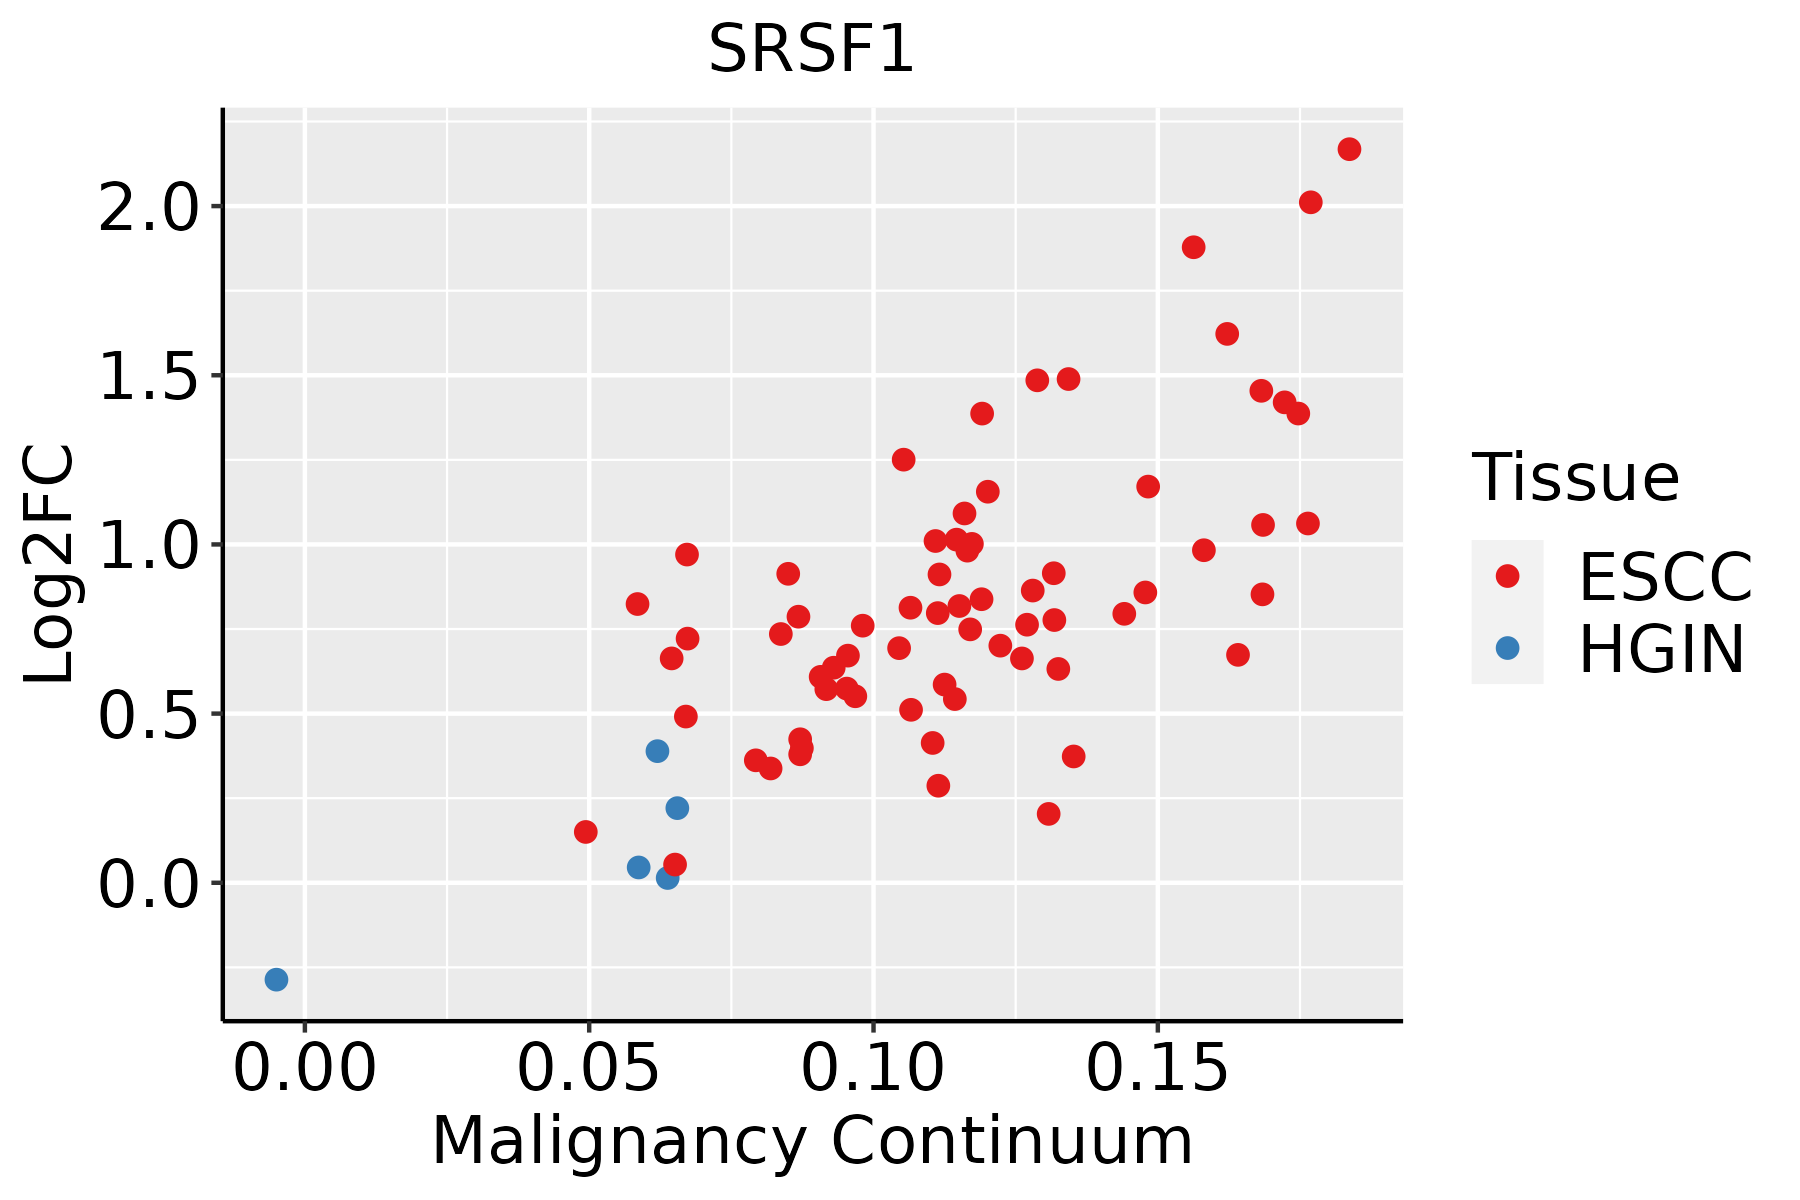 | ESCC: Esophageal squamous cell carcinoma |
| HGIN: High-grade intraepithelial neoplasias | ||
| LGIN: Low-grade intraepithelial neoplasias | ||
| Liver |  | HCC: Hepatocellular carcinoma |
| NAFLD: Non-alcoholic fatty liver disease | ||
| Oral Cavity |  | EOLP: Erosive Oral lichen planus |
| LP: leukoplakia | ||
| NEOLP: Non-erosive oral lichen planus | ||
| OSCC: Oral squamous cell carcinoma | ||
| Skin | 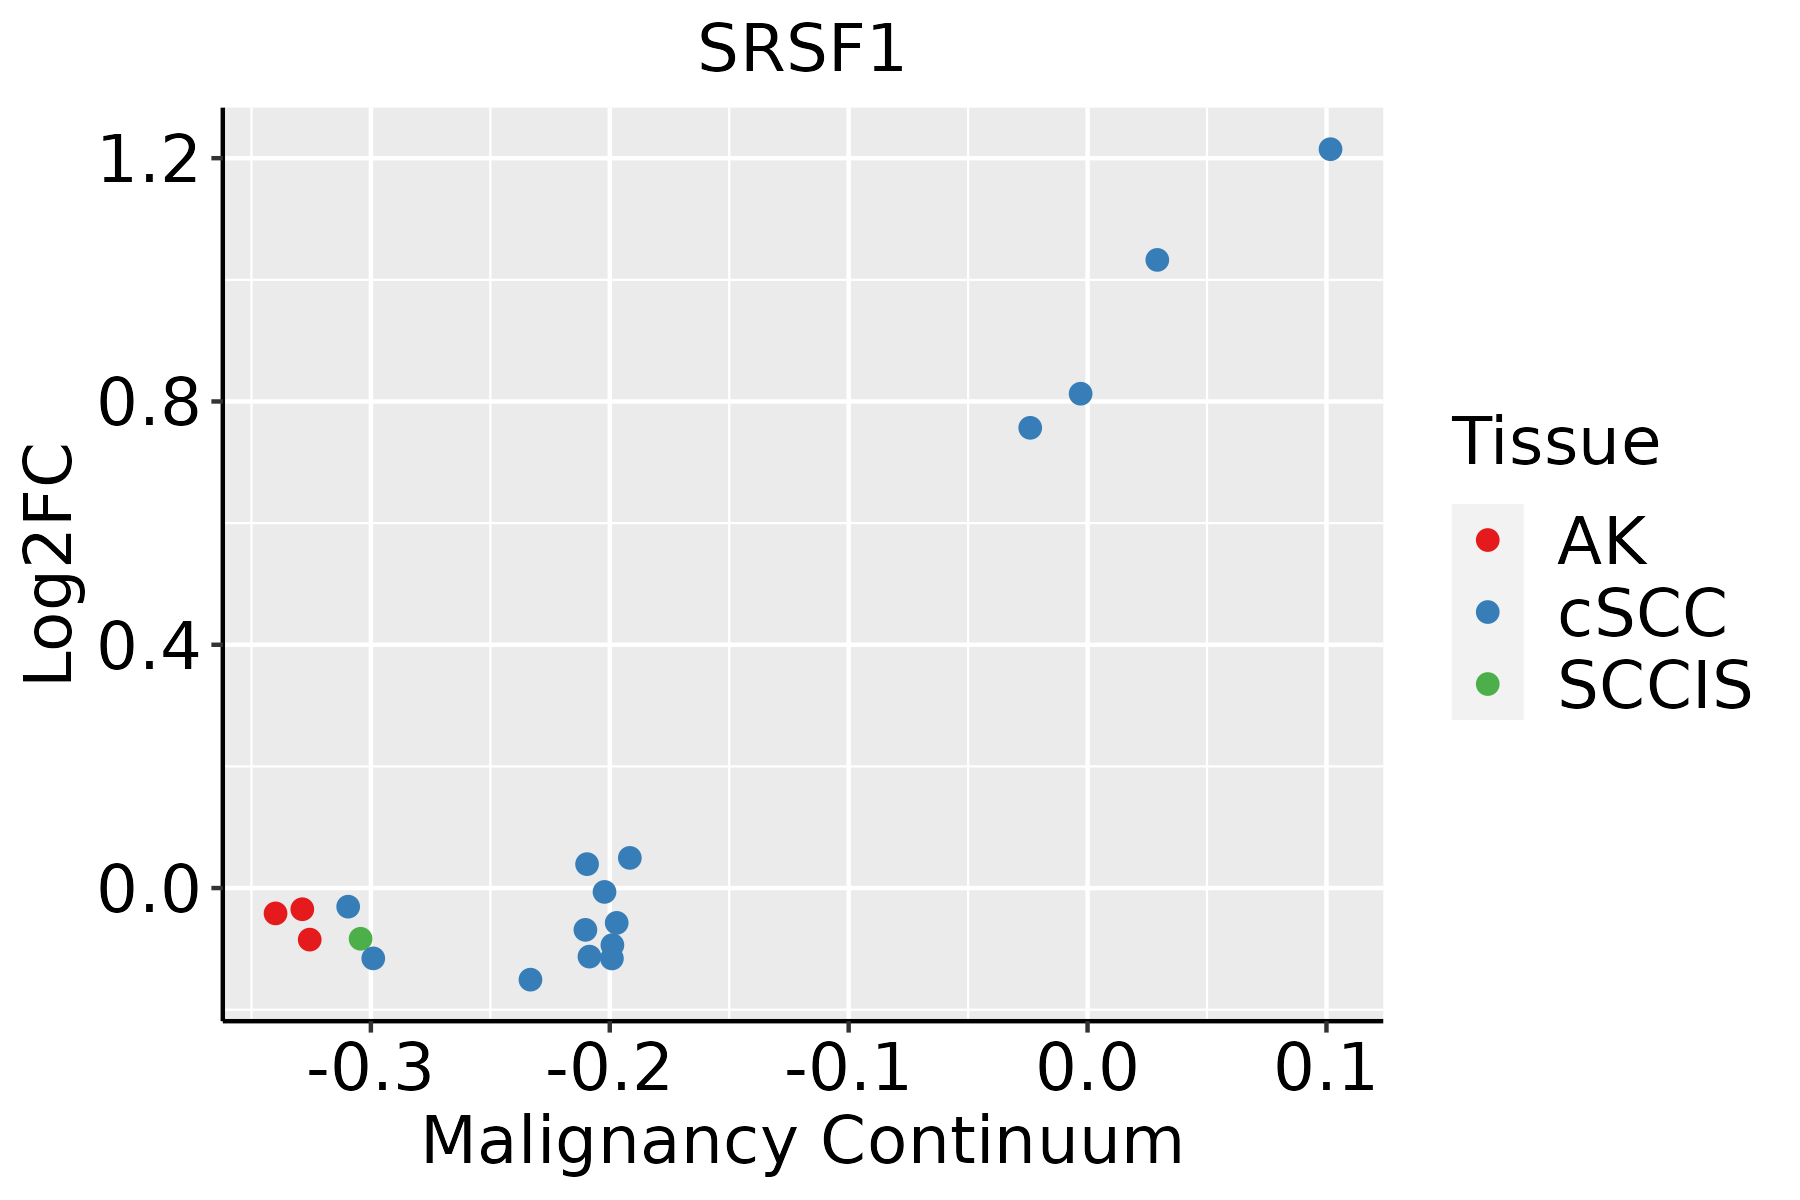 | AK: Actinic keratosis |
| cSCC: Cutaneous squamous cell carcinoma | ||
| SCCIS:squamous cell carcinoma in situ | ||
| Thyroid | 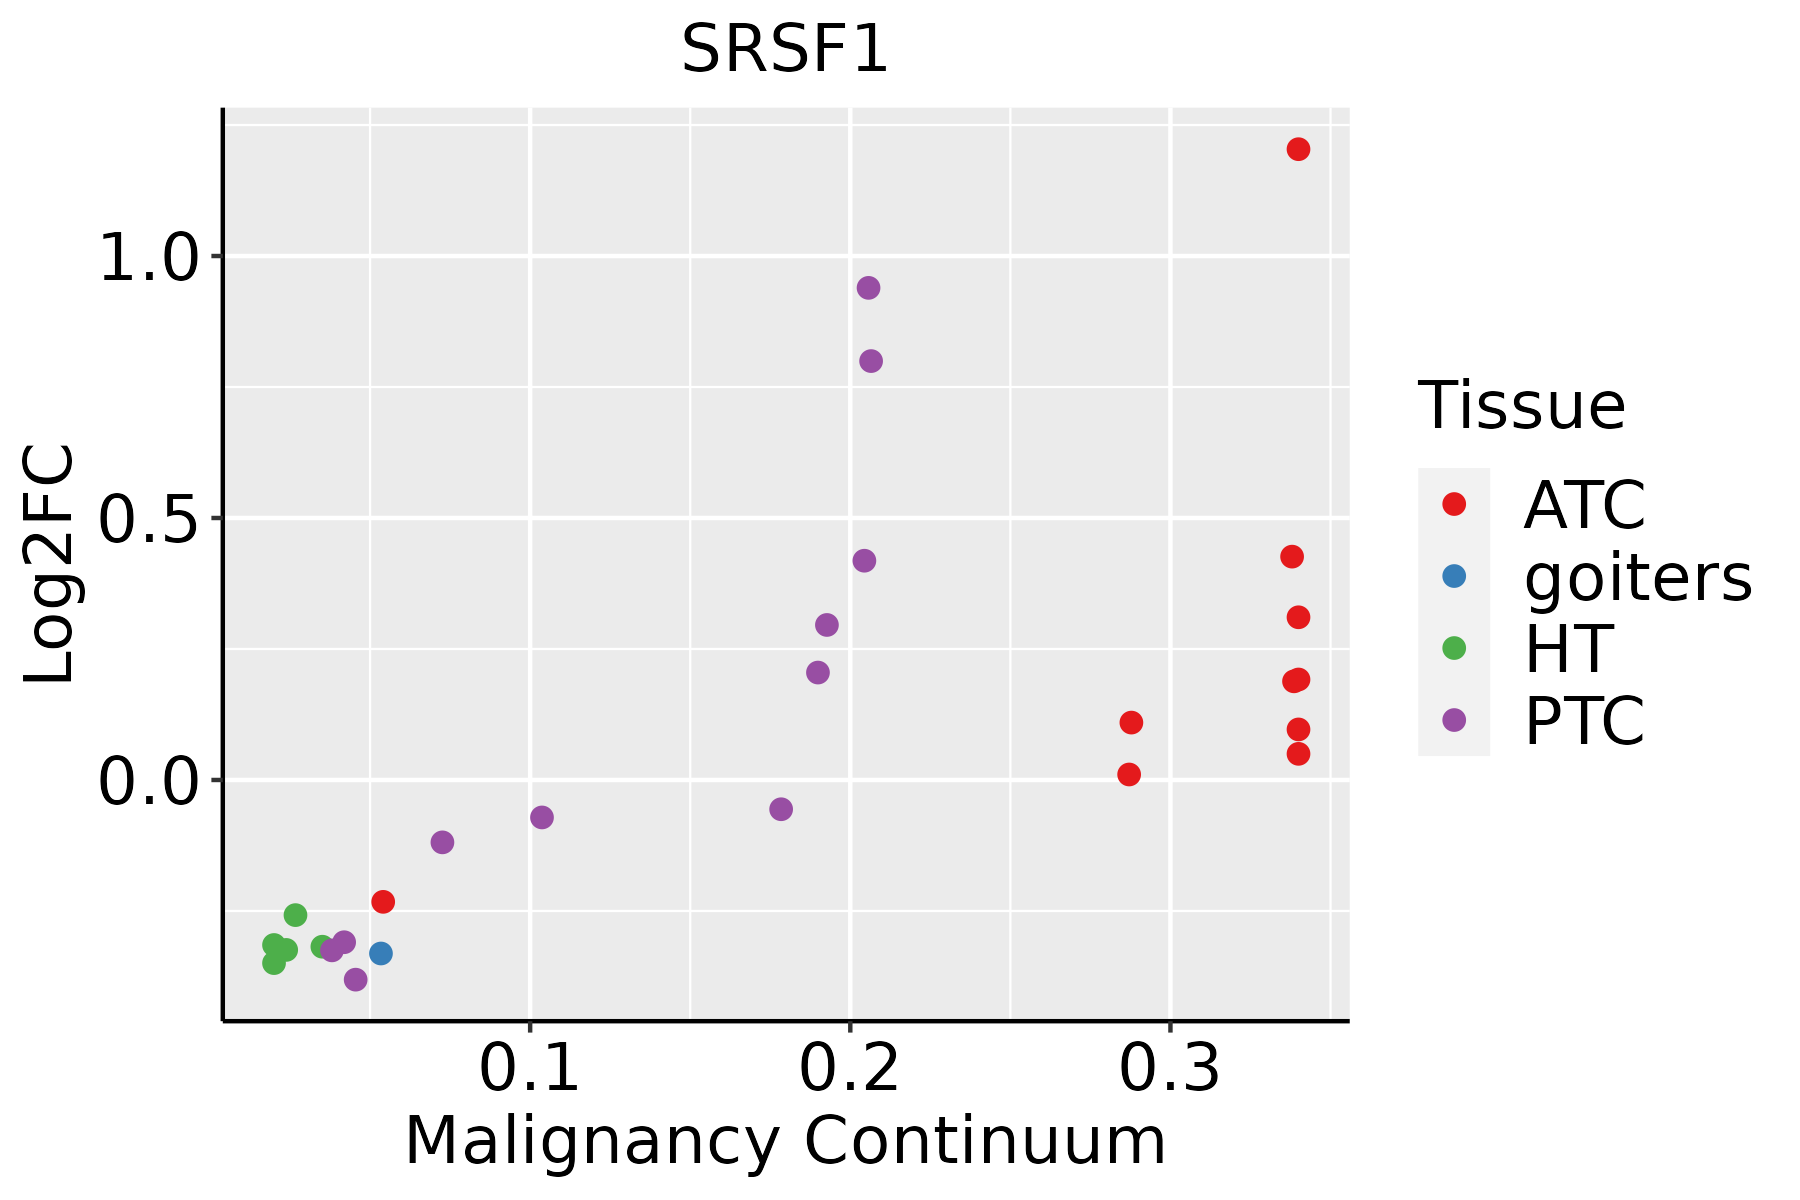 | ATC: Anaplastic thyroid cancer |
| HT: Hashimoto's thyroiditis | ||
| PTC: Papillary thyroid cancer |
| ∗log2FC in expression of this searched gene in stem-like cells from each diseased tissue sample relative to stem-like cells in normal samples in each tissue plotted against the malignancy continuum. Samples are colored based on if they are from different disease stage. |
Top |
Malignant transformation related pathway analysis |
| Find out the enriched GO biological processes and KEGG pathways involved in transition from healthy to precancer to cancer |
| Tissue | Disease Stage | Enriched GO biological Processes |
| Colorectum | AD |  |
| Colorectum | SER |  |
| Colorectum | MSS |  |
| Colorectum | MSI-H |  |
| Colorectum | FAP |  |
| ∗Top 15 enriched GO BP terms are showed in the bar plot of each disease state in each tissue. Each row represents a significant GO biological process which is colored according to the -log10(p.adjust). |
| Page: 1 2 3 4 5 6 7 8 9 |
| GO ID | Tissue | Disease Stage | Description | Gene Ratio | Bg Ratio | pvalue | p.adjust | Count |
| GO:190331218 | Prostate | BPH | negative regulation of mRNA metabolic process | 38/3107 | 92/18723 | 1.63e-08 | 5.11e-07 | 38 |
| GO:00506868 | Prostate | BPH | negative regulation of mRNA processing | 17/3107 | 29/18723 | 3.61e-07 | 7.60e-06 | 17 |
| GO:00480258 | Prostate | BPH | negative regulation of mRNA splicing, via spliceosome | 13/3107 | 20/18723 | 1.72e-06 | 2.88e-05 | 13 |
| GO:00164828 | Prostate | BPH | cytosolic transport | 51/3107 | 168/18723 | 6.56e-06 | 9.53e-05 | 51 |
| GO:00002455 | Prostate | BPH | spliceosomal complex assembly | 24/3107 | 79/18723 | 1.69e-03 | 9.75e-03 | 24 |
| GO:000838019 | Prostate | Tumor | RNA splicing | 153/3246 | 434/18723 | 9.15e-20 | 5.79e-17 | 153 |
| GO:002261319 | Prostate | Tumor | ribonucleoprotein complex biogenesis | 159/3246 | 463/18723 | 3.17e-19 | 1.52e-16 | 159 |
| GO:190331117 | Prostate | Tumor | regulation of mRNA metabolic process | 111/3246 | 288/18723 | 6.66e-18 | 2.30e-15 | 111 |
| GO:004348419 | Prostate | Tumor | regulation of RNA splicing | 70/3246 | 148/18723 | 3.22e-17 | 1.05e-14 | 70 |
| GO:000037518 | Prostate | Tumor | RNA splicing, via transesterification reactions | 119/3246 | 324/18723 | 3.40e-17 | 1.06e-14 | 119 |
| GO:000037718 | Prostate | Tumor | RNA splicing, via transesterification reactions with bulged adenosine as nucleophile | 117/3246 | 320/18723 | 9.31e-17 | 2.22e-14 | 117 |
| GO:000039818 | Prostate | Tumor | mRNA splicing, via spliceosome | 117/3246 | 320/18723 | 9.31e-17 | 2.22e-14 | 117 |
| GO:007182619 | Prostate | Tumor | ribonucleoprotein complex subunit organization | 91/3246 | 227/18723 | 3.62e-16 | 7.50e-14 | 91 |
| GO:002261819 | Prostate | Tumor | ribonucleoprotein complex assembly | 89/3246 | 220/18723 | 3.94e-16 | 7.89e-14 | 89 |
| GO:005068416 | Prostate | Tumor | regulation of mRNA processing | 64/3246 | 137/18723 | 1.55e-15 | 2.75e-13 | 64 |
| GO:004802419 | Prostate | Tumor | regulation of mRNA splicing, via spliceosome | 51/3246 | 101/18723 | 2.29e-14 | 2.97e-12 | 51 |
| GO:003311919 | Prostate | Tumor | negative regulation of RNA splicing | 17/3246 | 25/18723 | 2.91e-08 | 9.49e-07 | 17 |
| GO:190331219 | Prostate | Tumor | negative regulation of mRNA metabolic process | 38/3246 | 92/18723 | 5.44e-08 | 1.64e-06 | 38 |
| GO:005068613 | Prostate | Tumor | negative regulation of mRNA processing | 17/3246 | 29/18723 | 6.89e-07 | 1.40e-05 | 17 |
| GO:001648213 | Prostate | Tumor | cytosolic transport | 54/3246 | 168/18723 | 2.01e-06 | 3.46e-05 | 54 |
| Page: 1 2 3 4 5 6 7 8 9 10 11 12 13 14 15 16 17 18 19 20 21 22 23 24 25 26 27 28 29 30 31 32 33 34 |
| Pathway ID | Tissue | Disease Stage | Description | Gene Ratio | Bg Ratio | pvalue | p.adjust | qvalue | Count |
| hsa03040 | Colorectum | AD | Spliceosome | 73/2092 | 217/8465 | 1.73e-03 | 9.68e-03 | 6.18e-03 | 73 |
| hsa030401 | Colorectum | AD | Spliceosome | 73/2092 | 217/8465 | 1.73e-03 | 9.68e-03 | 6.18e-03 | 73 |
| hsa030402 | Colorectum | MSS | Spliceosome | 66/1875 | 217/8465 | 2.58e-03 | 1.27e-02 | 7.81e-03 | 66 |
| hsa030403 | Colorectum | MSS | Spliceosome | 66/1875 | 217/8465 | 2.58e-03 | 1.27e-02 | 7.81e-03 | 66 |
| hsa030404 | Colorectum | MSI-H | Spliceosome | 37/797 | 217/8465 | 2.49e-04 | 3.23e-03 | 2.70e-03 | 37 |
| hsa030405 | Colorectum | MSI-H | Spliceosome | 37/797 | 217/8465 | 2.49e-04 | 3.23e-03 | 2.70e-03 | 37 |
| hsa030409 | Endometrium | AEH | Spliceosome | 54/1197 | 217/8465 | 1.47e-05 | 1.65e-04 | 1.21e-04 | 54 |
| hsa0304014 | Endometrium | AEH | Spliceosome | 54/1197 | 217/8465 | 1.47e-05 | 1.65e-04 | 1.21e-04 | 54 |
| hsa0304024 | Endometrium | EEC | Spliceosome | 54/1237 | 217/8465 | 3.78e-05 | 3.88e-04 | 2.89e-04 | 54 |
| hsa0465720 | Endometrium | EEC | IL-17 signaling pathway | 23/1237 | 94/8465 | 7.61e-03 | 3.63e-02 | 2.71e-02 | 23 |
| hsa0304034 | Endometrium | EEC | Spliceosome | 54/1237 | 217/8465 | 3.78e-05 | 3.88e-04 | 2.89e-04 | 54 |
| hsa04657110 | Endometrium | EEC | IL-17 signaling pathway | 23/1237 | 94/8465 | 7.61e-03 | 3.63e-02 | 2.71e-02 | 23 |
| hsa0304018 | Esophagus | HGIN | Spliceosome | 79/1383 | 217/8465 | 3.22e-13 | 7.00e-12 | 5.56e-12 | 79 |
| hsa0465726 | Esophagus | HGIN | IL-17 signaling pathway | 25/1383 | 94/8465 | 7.52e-03 | 4.63e-02 | 3.68e-02 | 25 |
| hsa0304019 | Esophagus | HGIN | Spliceosome | 79/1383 | 217/8465 | 3.22e-13 | 7.00e-12 | 5.56e-12 | 79 |
| hsa04657113 | Esophagus | HGIN | IL-17 signaling pathway | 25/1383 | 94/8465 | 7.52e-03 | 4.63e-02 | 3.68e-02 | 25 |
| hsa0465727 | Esophagus | ESCC | IL-17 signaling pathway | 66/4205 | 94/8465 | 3.93e-05 | 1.75e-04 | 8.99e-05 | 66 |
| hsa0304027 | Esophagus | ESCC | Spliceosome | 128/4205 | 217/8465 | 3.31e-03 | 8.79e-03 | 4.50e-03 | 128 |
| hsa0465734 | Esophagus | ESCC | IL-17 signaling pathway | 66/4205 | 94/8465 | 3.93e-05 | 1.75e-04 | 8.99e-05 | 66 |
| hsa0304037 | Esophagus | ESCC | Spliceosome | 128/4205 | 217/8465 | 3.31e-03 | 8.79e-03 | 4.50e-03 | 128 |
| Page: 1 2 |
Top |
Cell-cell communication analysis |
| Identification of potential cell-cell interactions between two cell types and their ligand-receptor pairs for different disease states |
| Ligand | Receptor | LRpair | Pathway | Tissue | Disease Stage |
| Page: 1 |
Top |
Single-cell gene regulatory network inference analysis |
| Find out the significant the regulons (TFs) and the target genes of each regulon across cell types for different disease states |
| TF | Cell Type | Tissue | Disease Stage | Target Gene | RSS | Regulon Activity |
| ∗The dot plots of a searched regulon are shown for all cell subpopulations in each disease state of each tissue based on the regulon specific score inferred using pySCENIC and by calculating the average expression. |
| Page: 1 |
Top |
Somatic mutation of malignant transformation related genes |
| Annotation of somatic variants for genes involved in malignant transformation |
| Hugo Symbol | Variant Class | Variant Classification | dbSNP RS | HGVSc | HGVSp | HGVSp Short | SWISSPROT | BIOTYPE | SIFT | PolyPhen | Tumor Sample Barcode | Tissue | Histology | Sex | Age | Stage | Therapy Types | Drugs | Outcome |
| SRSF1 | SNV | Missense_Mutation | novel | c.427N>A | p.Glu143Lys | p.E143K | Q07955 | protein_coding | tolerated(0.36) | probably_damaging(0.969) | TCGA-PE-A5DD-01 | Breast | breast invasive carcinoma | Female | <65 | I/II | Chemotherapy | CR | |
| SRSF1 | insertion | Frame_Shift_Ins | novel | c.581_582insCATAGCAGATCTCGCTCTCGTACATAAGATGATTGGTG | p.Asp195IlefsTer106 | p.D195Ifs*106 | Q07955 | protein_coding | TCGA-A2-A0CM-01 | Breast | breast invasive carcinoma | Female | <65 | I/II | Chemotherapy | adriamycin | PD | ||
| SRSF1 | SNV | Missense_Mutation | c.158N>A | p.Gly53Glu | p.G53E | Q07955 | protein_coding | tolerated(0.24) | possibly_damaging(0.893) | TCGA-BI-A0VS-01 | Cervix | cervical & endocervical cancer | Female | <65 | I/II | Unknown | Unknown | SD | |
| SRSF1 | SNV | Missense_Mutation | c.416A>G | p.Asp139Gly | p.D139G | Q07955 | protein_coding | deleterious(0.01) | probably_damaging(1) | TCGA-EX-A69M-01 | Cervix | cervical & endocervical cancer | Female | <65 | I/II | Unknown | Unknown | PD | |
| SRSF1 | SNV | Missense_Mutation | novel | c.405N>T | p.Gln135His | p.Q135H | Q07955 | protein_coding | deleterious(0) | probably_damaging(0.997) | TCGA-A6-6653-01 | Colorectum | colon adenocarcinoma | Male | >=65 | I/II | Unknown | Unknown | SD |
| SRSF1 | SNV | Missense_Mutation | c.229T>A | p.Tyr77Asn | p.Y77N | Q07955 | protein_coding | deleterious(0) | probably_damaging(0.962) | TCGA-CK-4951-01 | Colorectum | colon adenocarcinoma | Female | >=65 | I/II | Unknown | Unknown | PD | |
| SRSF1 | SNV | Missense_Mutation | c.414N>T | p.Lys138Asn | p.K138N | Q07955 | protein_coding | deleterious(0) | probably_damaging(1) | TCGA-CM-4743-01 | Colorectum | colon adenocarcinoma | Male | >=65 | I/II | Chemotherapy | capecitabine | SD | |
| SRSF1 | SNV | Missense_Mutation | c.731C>A | p.Ser244Tyr | p.S244Y | Q07955 | protein_coding | deleterious_low_confidence(0) | possibly_damaging(0.831) | TCGA-B5-A0JY-01 | Endometrium | uterine corpus endometrioid carcinoma | Female | <65 | III/IV | Chemotherapy | doxorubicin | SD | |
| SRSF1 | SNV | Missense_Mutation | c.478G>A | p.Val160Met | p.V160M | Q07955 | protein_coding | deleterious(0.01) | probably_damaging(0.955) | TCGA-BG-A0M0-01 | Endometrium | uterine corpus endometrioid carcinoma | Female | >=65 | I/II | Unknown | Unknown | SD | |
| SRSF1 | SNV | Missense_Mutation | novel | c.581N>C | p.Val194Ala | p.V194A | Q07955 | protein_coding | tolerated(0.65) | benign(0.011) | TCGA-BG-A222-01 | Endometrium | uterine corpus endometrioid carcinoma | Female | <65 | I/II | Unknown | Unknown | SD |
| Page: 1 2 3 |
Top |
Related drugs of malignant transformation related genes |
| Identification of chemicals and drugs interact with genes involved in malignant transfromation |
| (DGIdb 4.0) |
| Entrez ID | Symbol | Category | Interaction Types | Drug Claim Name | Drug Name | PMIDs |
| Page: 1 |

Copyright 2023-Present -The University of Texas Health Science Center at Houston |