| Tissue | Expression Dynamics | Abbreviation |
| Cervix | 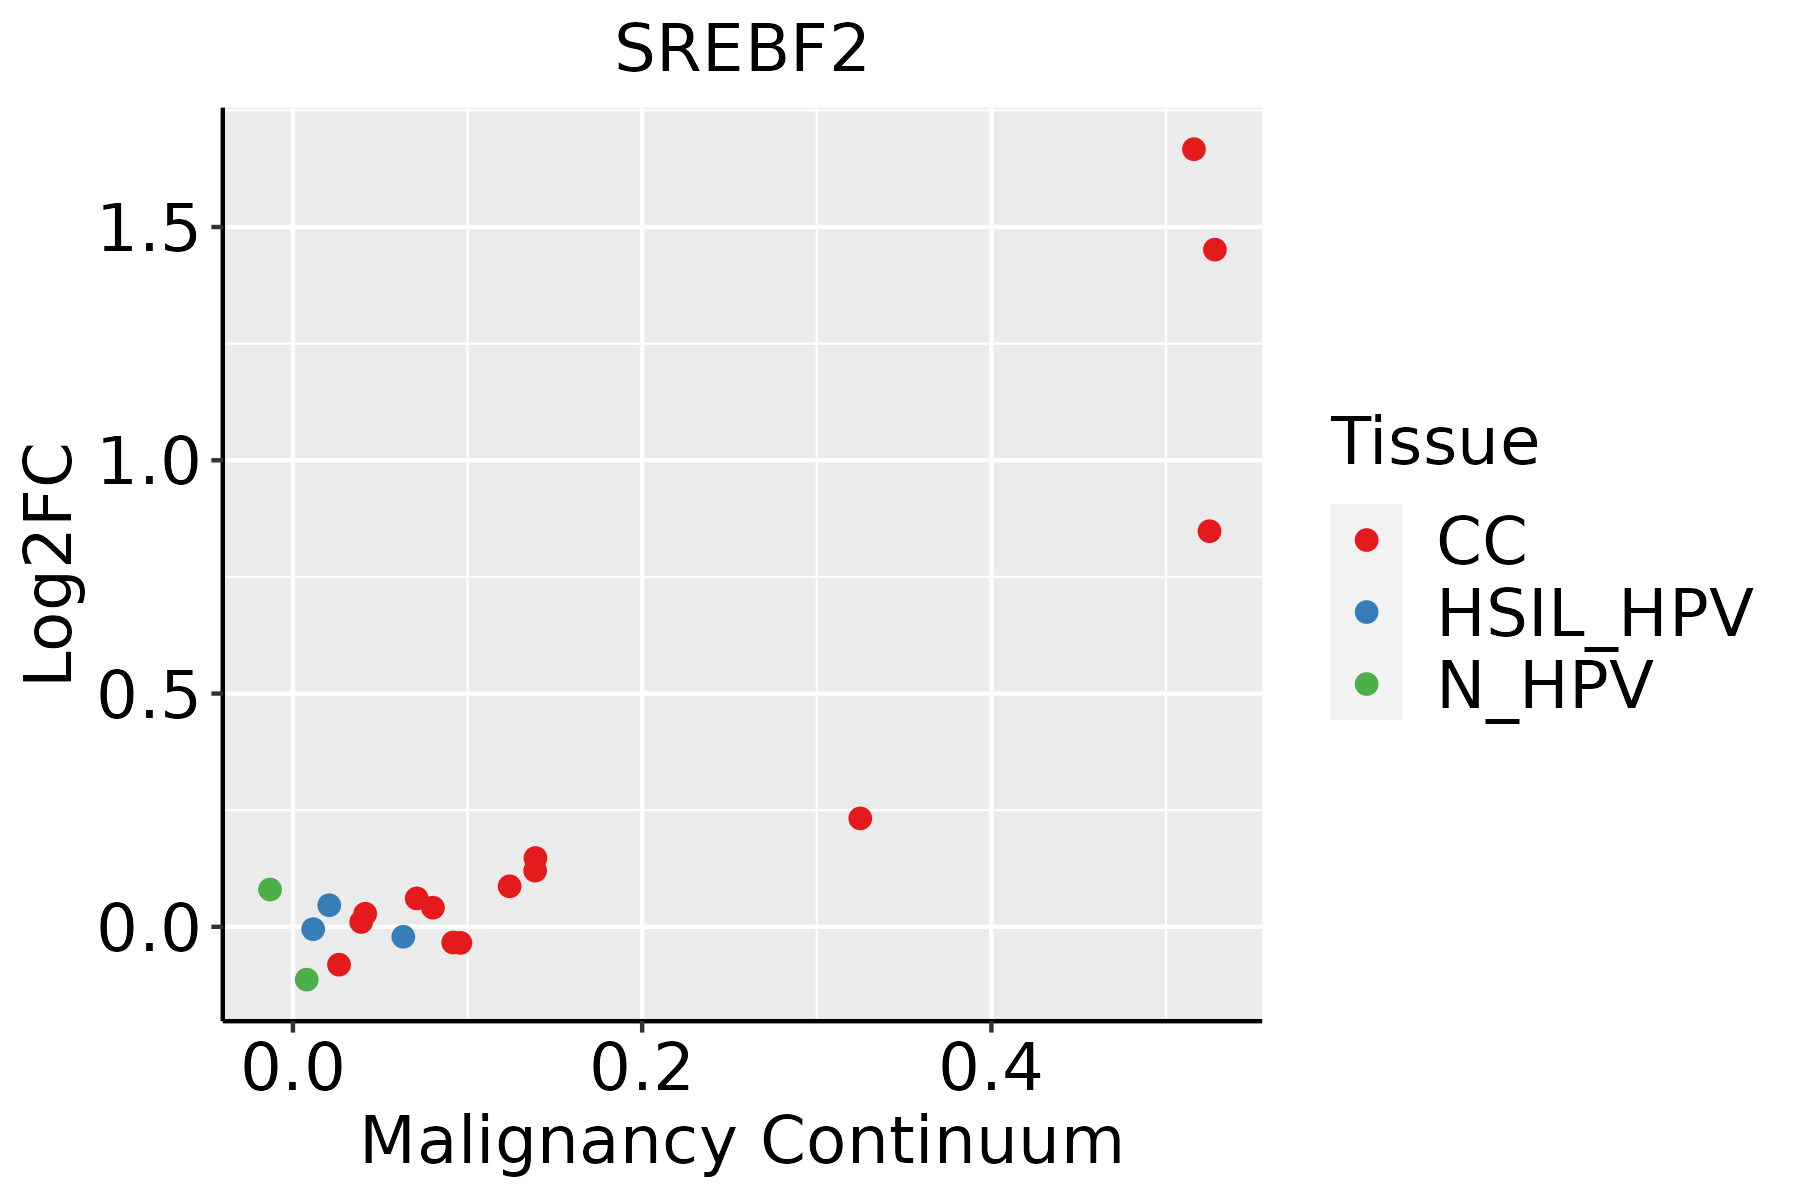 | CC: Cervix cancer |
| HSIL_HPV: HPV-infected high-grade squamous intraepithelial lesions |
| N_HPV: HPV-infected normal cervix |
| Colorectum (GSE201348) |  | FAP: Familial adenomatous polyposis |
| CRC: Colorectal cancer |
| Colorectum (HTA11) | 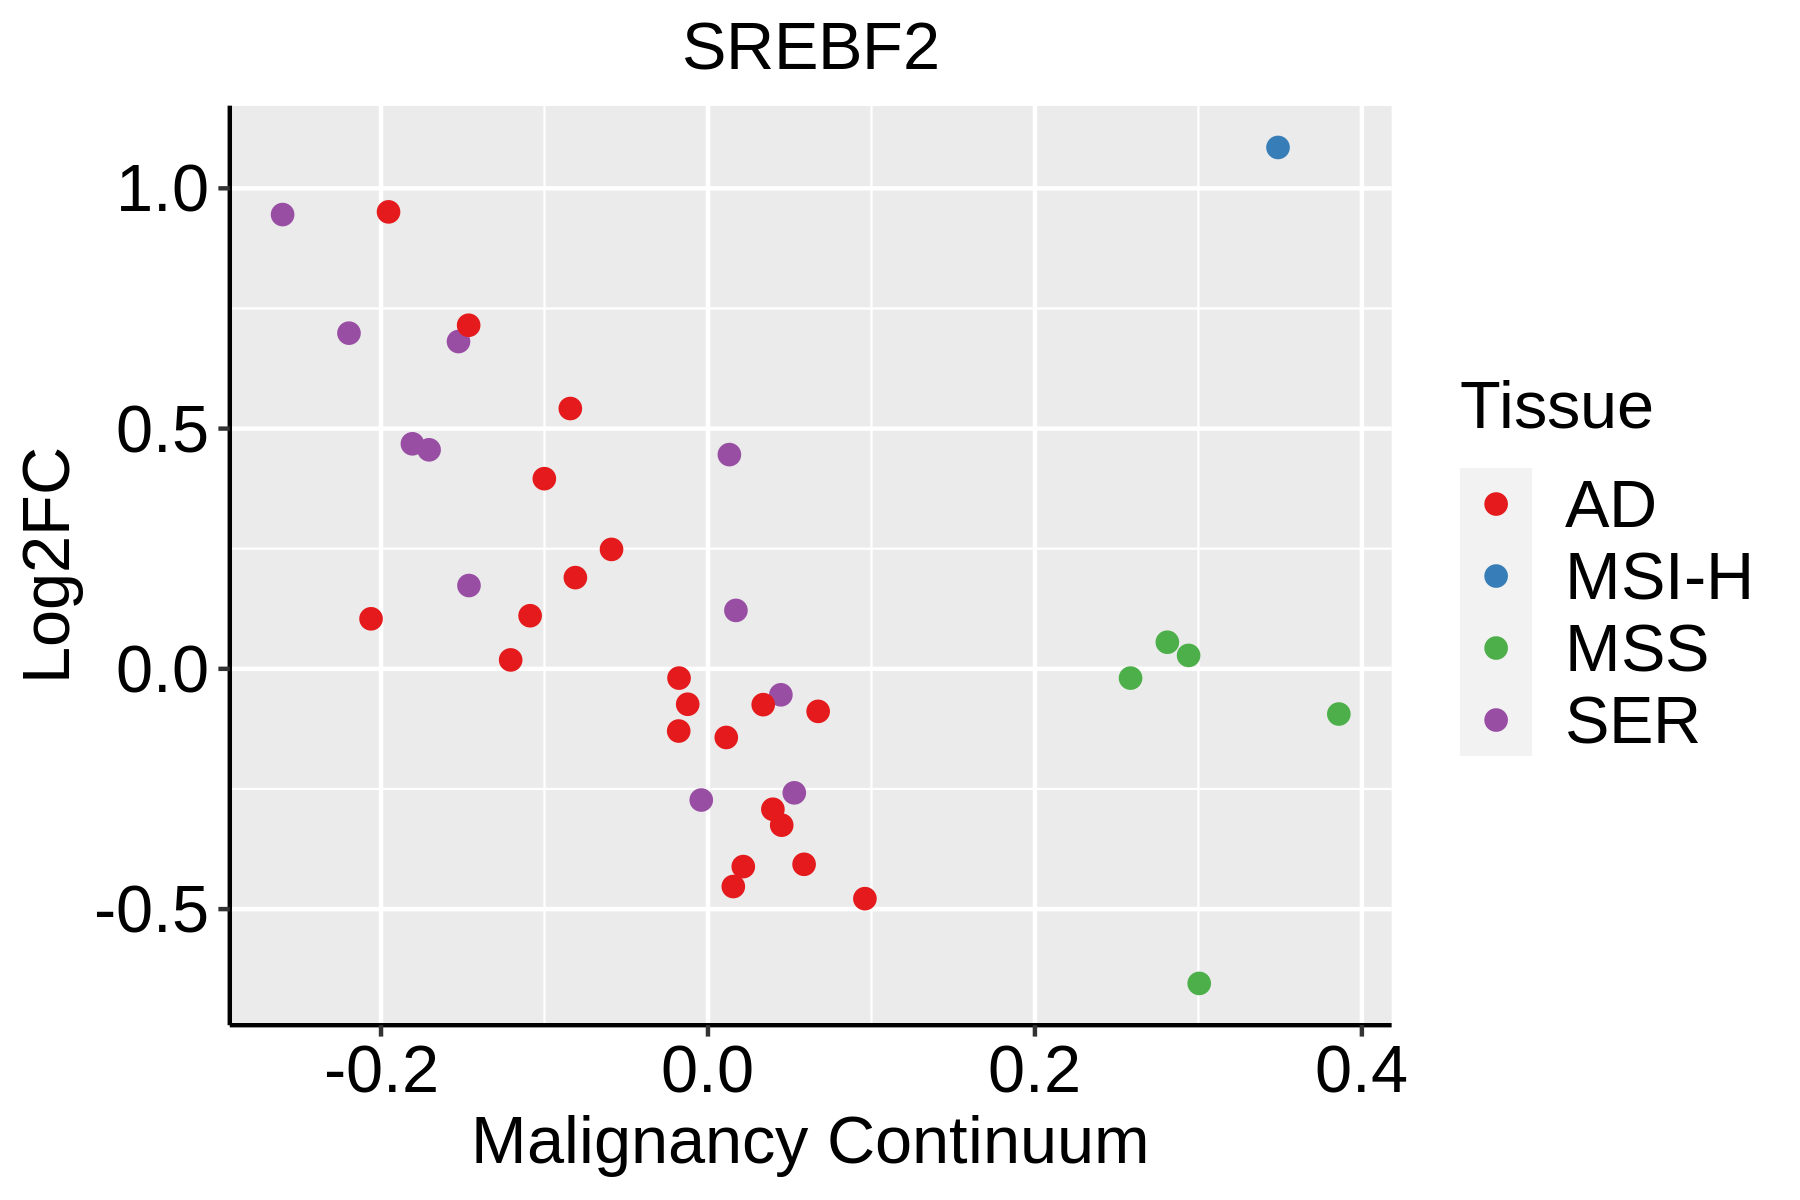 | AD: Adenomas |
| SER: Sessile serrated lesions |
| MSI-H: Microsatellite-high colorectal cancer |
| MSS: Microsatellite stable colorectal cancer |
| Endometrium |  | AEH: Atypical endometrial hyperplasia |
| EEC: Endometrioid Cancer |
| Esophagus | 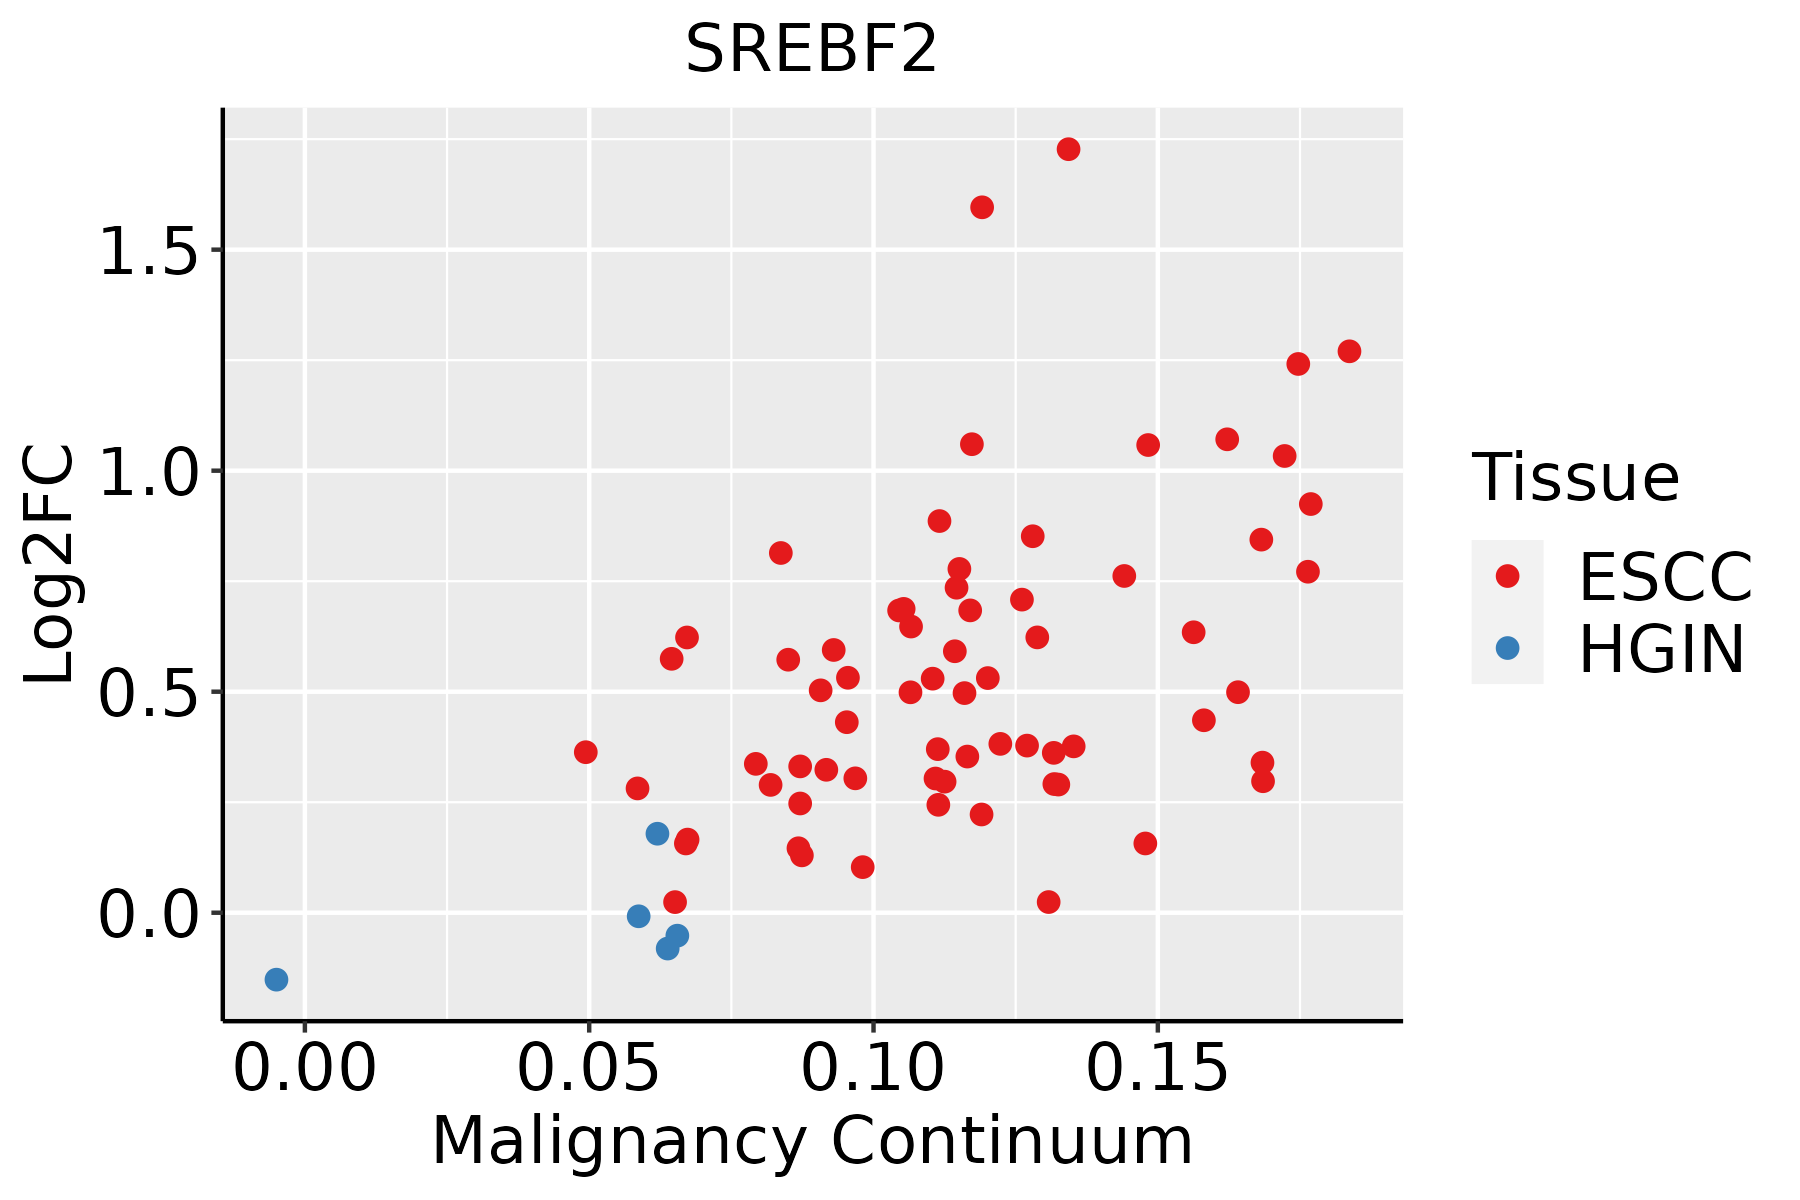 | ESCC: Esophageal squamous cell carcinoma |
| HGIN: High-grade intraepithelial neoplasias |
| LGIN: Low-grade intraepithelial neoplasias |
| Liver | 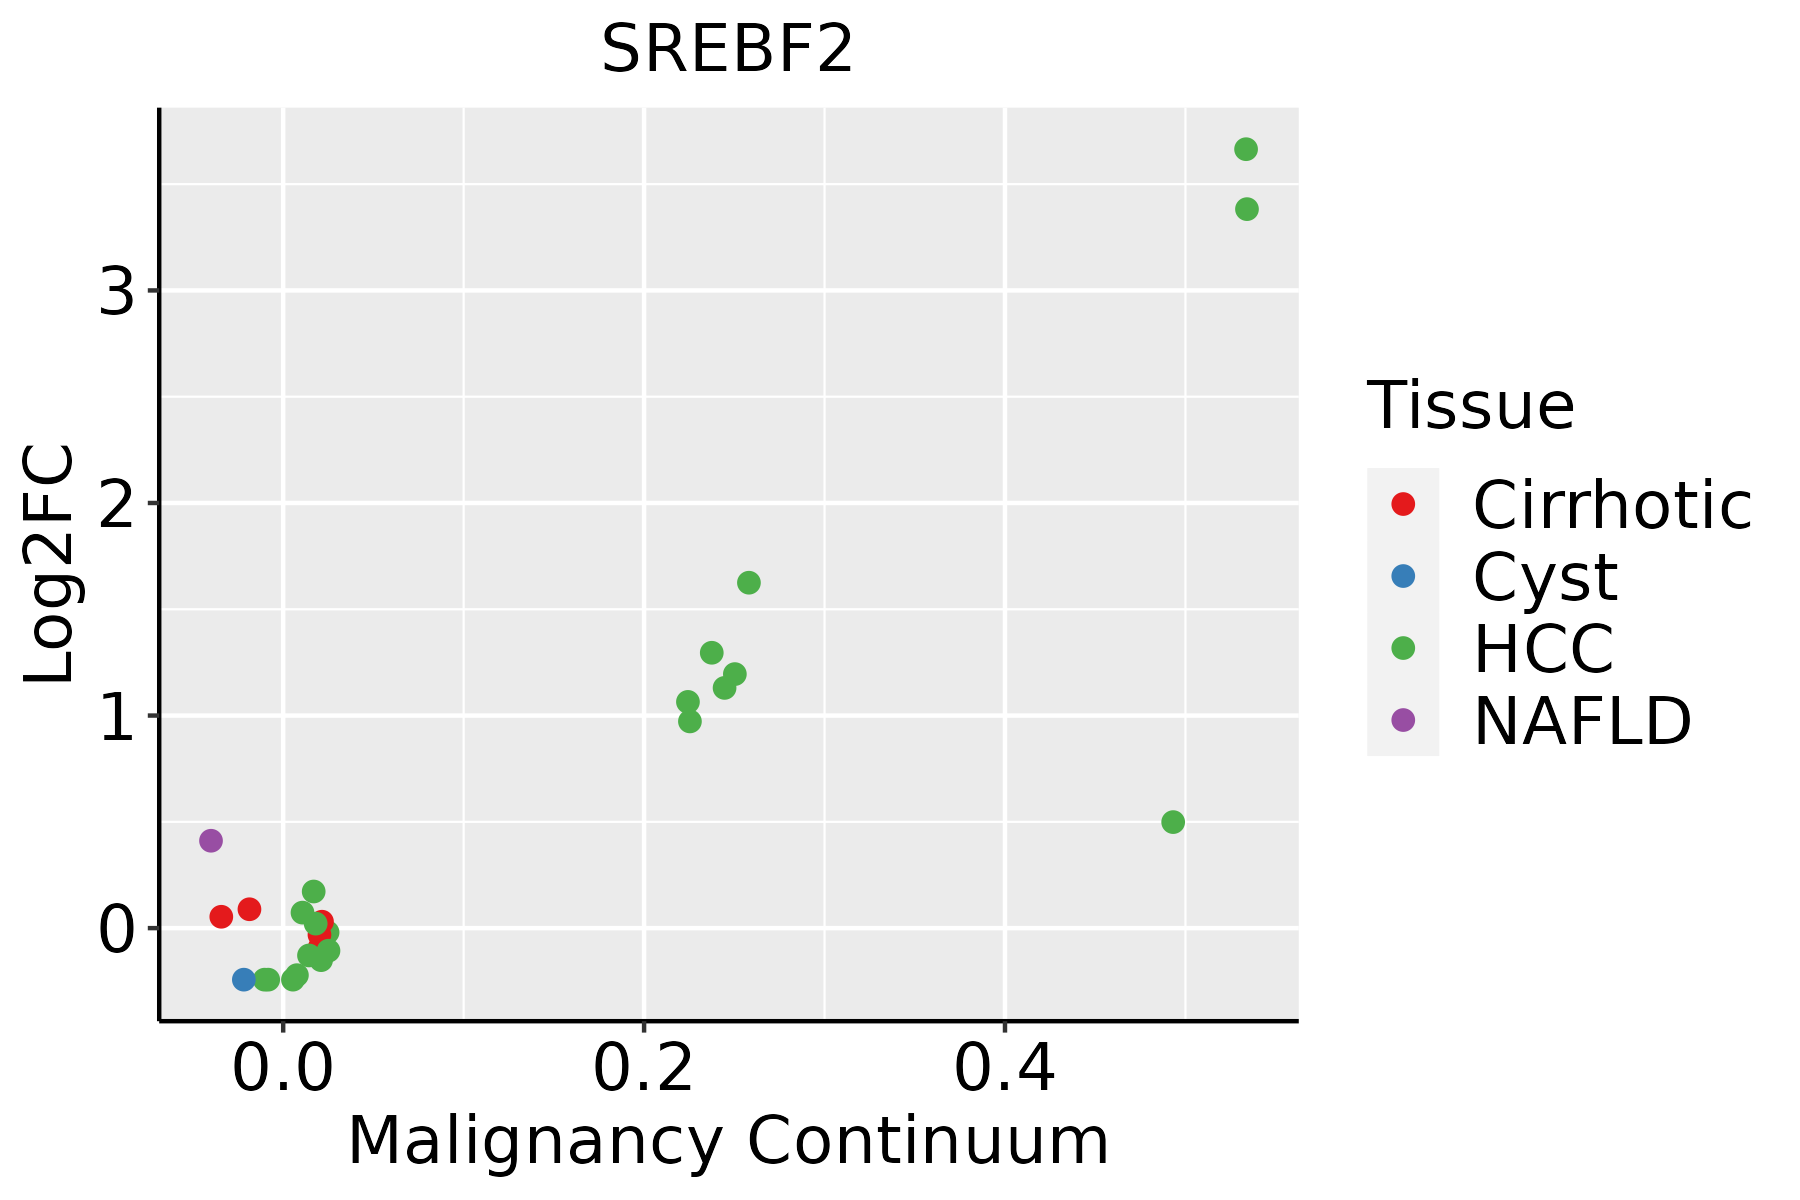 | HCC: Hepatocellular carcinoma |
| NAFLD: Non-alcoholic fatty liver disease |
| Oral Cavity | 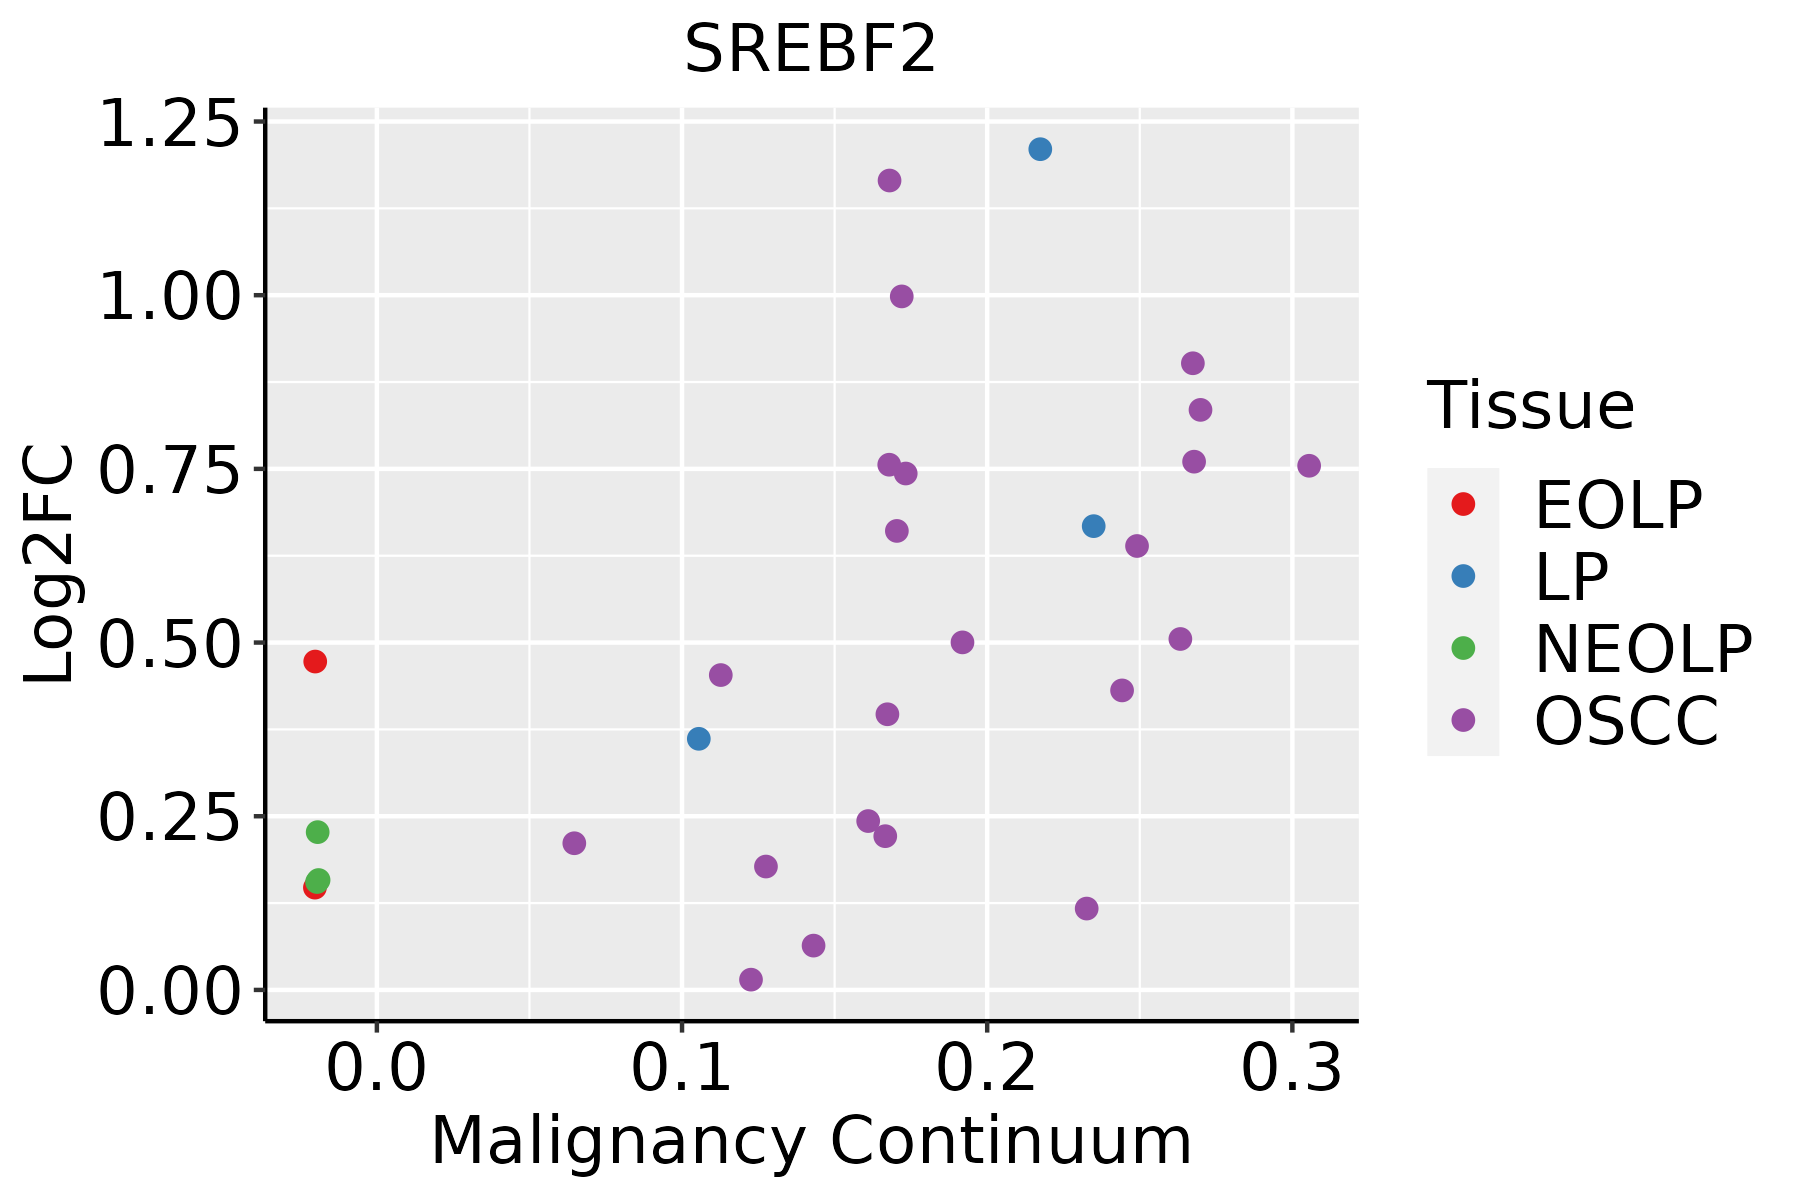 | EOLP: Erosive Oral lichen planus |
| LP: leukoplakia |
| NEOLP: Non-erosive oral lichen planus |
| OSCC: Oral squamous cell carcinoma |
| Prostate |  | BPH: Benign Prostatic Hyperplasia |
| Skin | 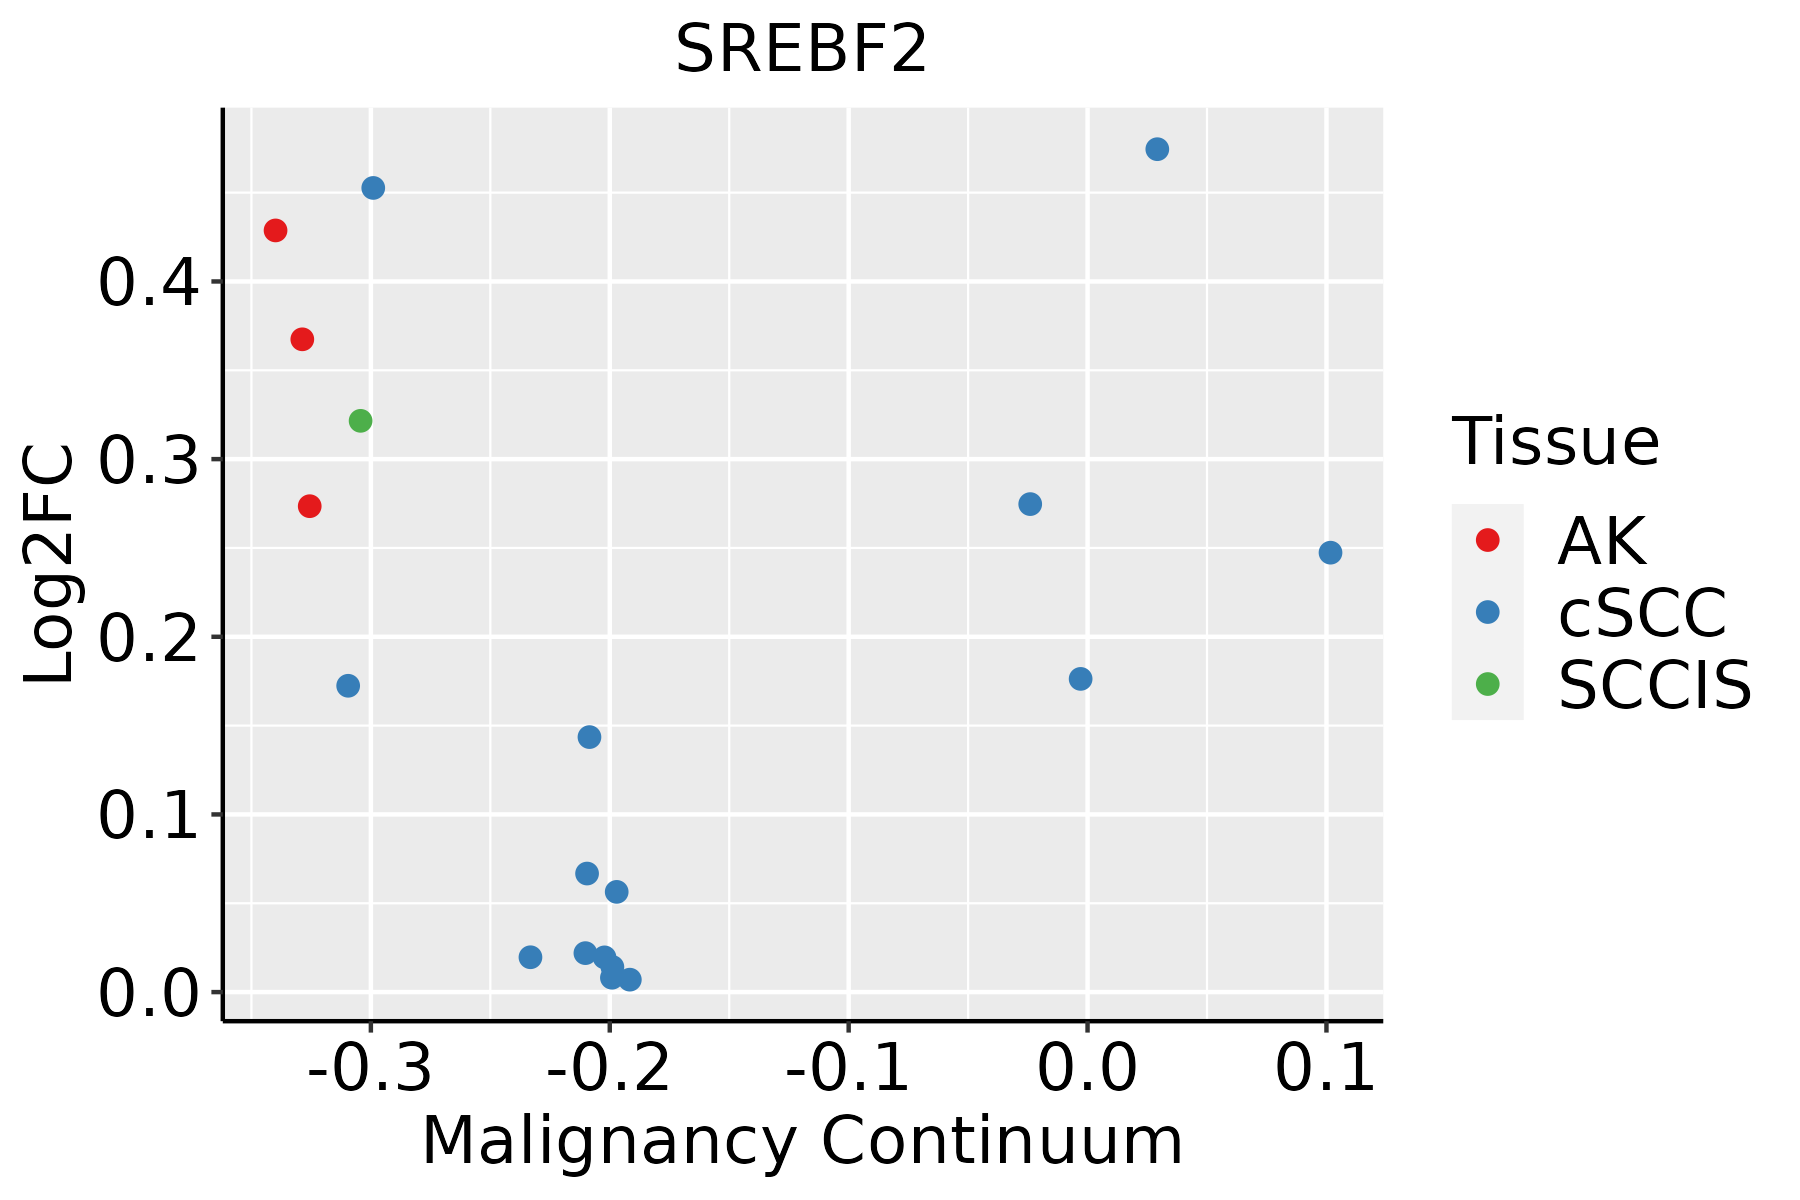 | AK: Actinic keratosis |
| cSCC: Cutaneous squamous cell carcinoma |
| SCCIS:squamous cell carcinoma in situ |
| Thyroid | 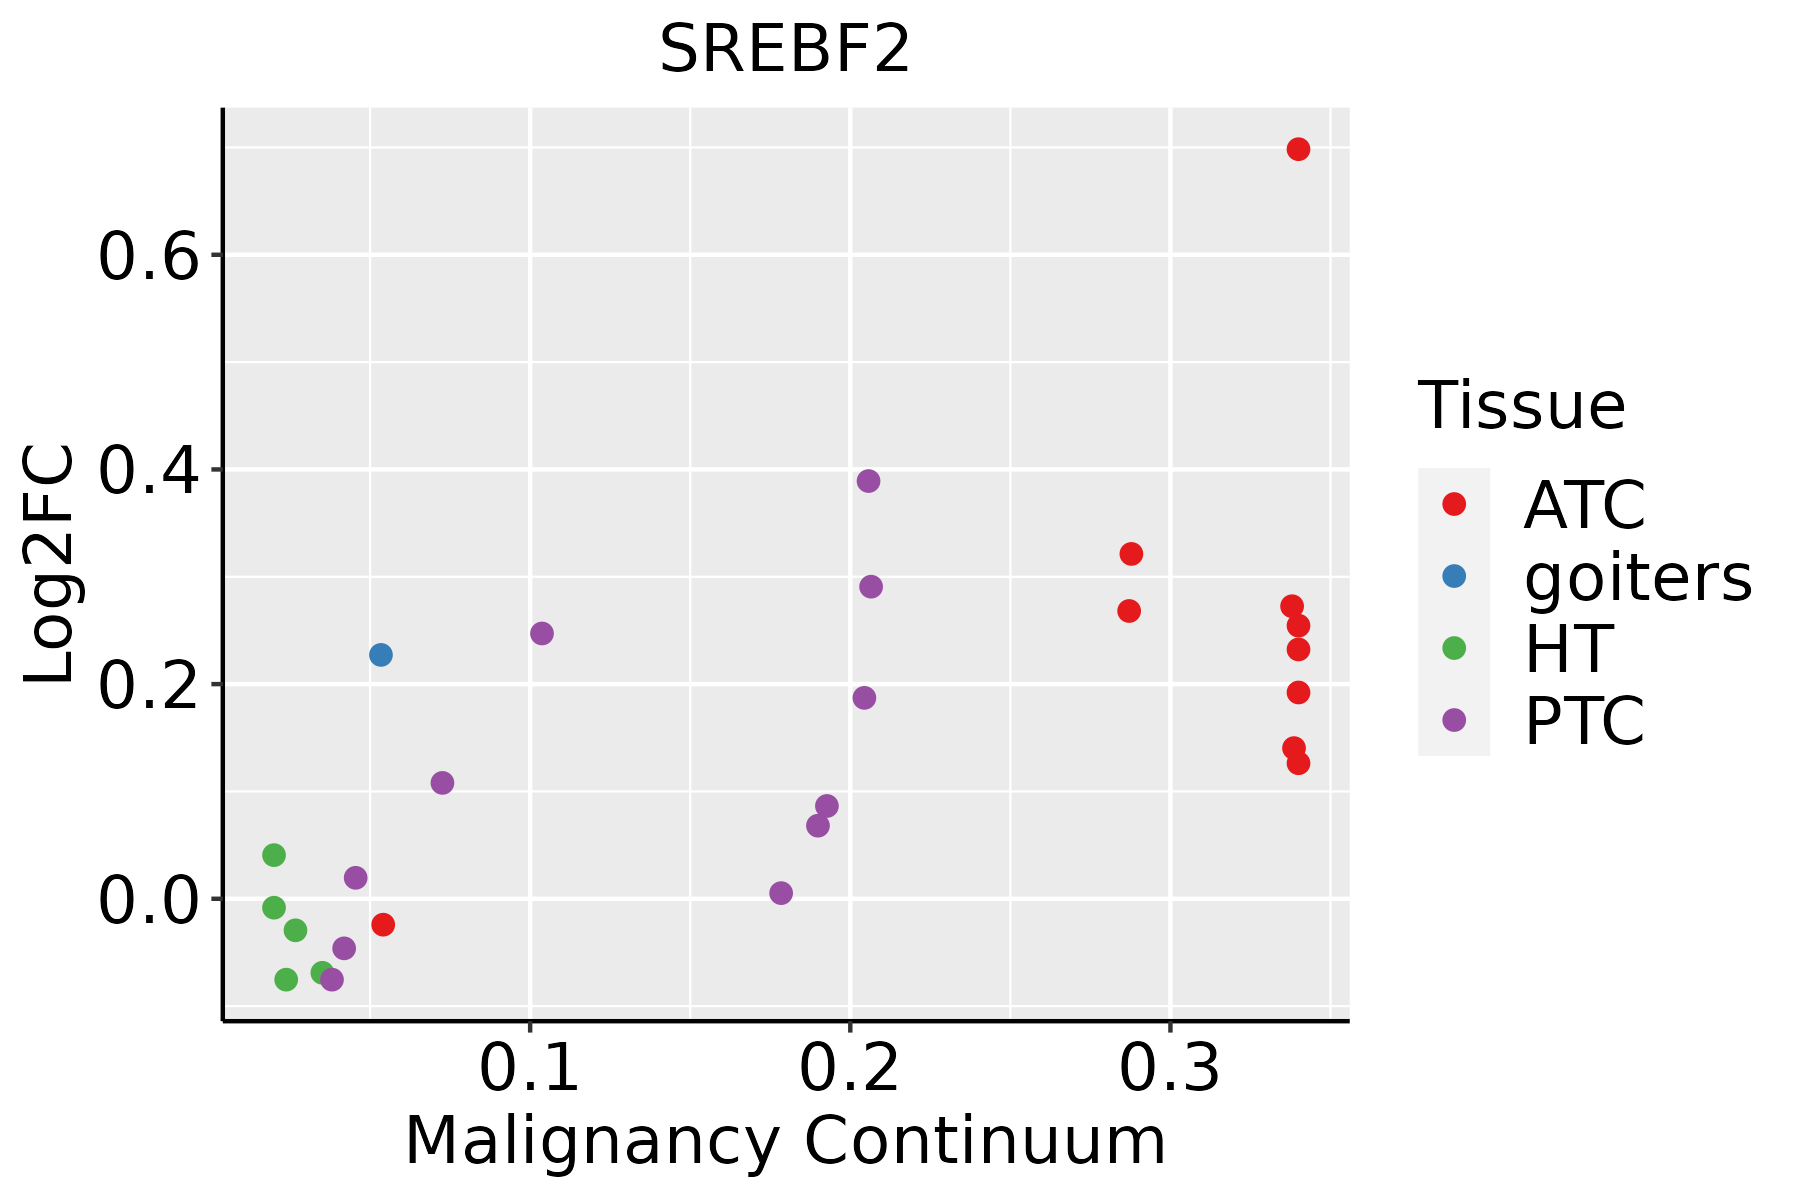 | ATC: Anaplastic thyroid cancer |
| HT: Hashimoto's thyroiditis |
| PTC: Papillary thyroid cancer |
| GO ID | Tissue | Disease Stage | Description | Gene Ratio | Bg Ratio | pvalue | p.adjust | Count |
| GO:006161417 | Oral cavity | OSCC | pri-miRNA transcription by RNA polymerase II | 35/7305 | 55/18723 | 1.88e-04 | 1.27e-03 | 35 |
| GO:19026523 | Oral cavity | OSCC | secondary alcohol metabolic process | 79/7305 | 147/18723 | 1.98e-04 | 1.33e-03 | 79 |
| GO:190289317 | Oral cavity | OSCC | regulation of pri-miRNA transcription by RNA polymerase II | 34/7305 | 54/18723 | 3.12e-04 | 1.94e-03 | 34 |
| GO:00085934 | Oral cavity | OSCC | regulation of Notch signaling pathway | 53/7305 | 95/18723 | 6.64e-04 | 3.72e-03 | 53 |
| GO:00082033 | Oral cavity | OSCC | cholesterol metabolic process | 72/7305 | 137/18723 | 8.63e-04 | 4.55e-03 | 72 |
| GO:00344053 | Oral cavity | OSCC | response to fluid shear stress | 23/7305 | 35/18723 | 1.25e-03 | 6.25e-03 | 23 |
| GO:00199154 | Oral cavity | OSCC | lipid storage | 48/7305 | 87/18723 | 1.60e-03 | 7.62e-03 | 48 |
| GO:19028958 | Oral cavity | OSCC | positive regulation of pri-miRNA transcription by RNA polymerase II | 26/7305 | 42/18723 | 2.22e-03 | 1.00e-02 | 26 |
| GO:00161253 | Oral cavity | OSCC | sterol metabolic process | 77/7305 | 152/18723 | 2.26e-03 | 1.00e-02 | 77 |
| GO:00714022 | Oral cavity | OSCC | cellular response to lipoprotein particle stimulus | 22/7305 | 36/18723 | 5.96e-03 | 2.27e-02 | 22 |
| GO:00108835 | Oral cavity | OSCC | regulation of lipid storage | 32/7305 | 57/18723 | 6.45e-03 | 2.40e-02 | 32 |
| GO:00329334 | Oral cavity | OSCC | SREBP signaling pathway | 11/7305 | 15/18723 | 7.49e-03 | 2.75e-02 | 11 |
| GO:00082024 | Oral cavity | OSCC | steroid metabolic process | 146/7305 | 319/18723 | 7.78e-03 | 2.85e-02 | 146 |
| GO:0055094 | Oral cavity | OSCC | response to lipoprotein particle | 20/7305 | 34/18723 | 1.51e-02 | 4.91e-02 | 20 |
| GO:00715014 | Oral cavity | OSCC | cellular response to sterol depletion | 11/7305 | 16/18723 | 1.56e-02 | 4.99e-02 | 11 |
| GO:007259419 | Oral cavity | LP | establishment of protein localization to organelle | 205/4623 | 422/18723 | 6.76e-27 | 3.85e-24 | 205 |
| GO:0006605110 | Oral cavity | LP | protein targeting | 156/4623 | 314/18723 | 5.43e-22 | 1.62e-19 | 156 |
| GO:1903829110 | Oral cavity | LP | positive regulation of cellular protein localization | 127/4623 | 276/18723 | 7.52e-15 | 9.81e-13 | 127 |
| GO:000683919 | Oral cavity | LP | mitochondrial transport | 119/4623 | 254/18723 | 1.06e-14 | 1.33e-12 | 119 |
| GO:007058519 | Oral cavity | LP | protein localization to mitochondrion | 70/4623 | 125/18723 | 6.73e-14 | 7.02e-12 | 70 |
| Hugo Symbol | Variant Class | Variant Classification | dbSNP RS | HGVSc | HGVSp | HGVSp Short | SWISSPROT | BIOTYPE | SIFT | PolyPhen | Tumor Sample Barcode | Tissue | Histology | Sex | Age | Stage | Therapy Types | Drugs | Outcome |
| SREBF2 | SNV | Missense_Mutation | | c.1412N>T | p.Pro471Leu | p.P471L | Q12772 | protein_coding | deleterious(0.02) | benign(0.154) | TCGA-BH-A0HF-01 | Breast | breast invasive carcinoma | Female | >=65 | I/II | Hormone Therapy | arimidex | SD |
| SREBF2 | SNV | Missense_Mutation | rs147747695 | c.2562N>A | p.Met854Ile | p.M854I | Q12772 | protein_coding | deleterious(0.04) | benign(0) | TCGA-BH-A0HP-01 | Breast | breast invasive carcinoma | Female | >=65 | III/IV | Chemotherapy | doxorubicin | SD |
| SREBF2 | SNV | Missense_Mutation | | c.1334N>G | p.Ser445Cys | p.S445C | Q12772 | protein_coding | deleterious(0) | probably_damaging(0.997) | TCGA-BH-A18U-01 | Breast | breast invasive carcinoma | Female | >=65 | III/IV | Unknown | Unknown | SD |
| SREBF2 | insertion | Frame_Shift_Ins | novel | c.653_654insAAAAATTAGC | p.Thr219LysfsTer99 | p.T219Kfs*99 | Q12772 | protein_coding | | | TCGA-A8-A07J-01 | Breast | breast invasive carcinoma | Female | <65 | I/II | Chemotherapy | 5-fluorouracil | CR |
| SREBF2 | insertion | Nonsense_Mutation | novel | c.1267_1268insGATTAACCCAGGAAGAGTCTCAGACCTCATGAAGTACTGCC | p.Asp423GlyfsTer11 | p.D423Gfs*11 | Q12772 | protein_coding | | | TCGA-A8-A08H-01 | Breast | breast invasive carcinoma | Female | >=65 | I/II | Unknown | Unknown | SD |
| SREBF2 | deletion | Frame_Shift_Del | novel | c.1435delC | p.Arg479AlafsTer19 | p.R479Afs*19 | Q12772 | protein_coding | | | TCGA-D8-A27V-01 | Breast | breast invasive carcinoma | Female | <65 | I/II | Hormone Therapy | tamoxiphen | SD |
| SREBF2 | deletion | Frame_Shift_Del | novel | c.3047delG | p.Gly1016AlafsTer26 | p.G1016Afs*26 | Q12772 | protein_coding | | | TCGA-EW-A2FV-01 | Breast | breast invasive carcinoma | Female | <65 | III/IV | Chemotherapy | docetaxel | SD |
| SREBF2 | SNV | Missense_Mutation | rs200228342 | c.1418N>T | p.Ala473Val | p.A473V | Q12772 | protein_coding | deleterious(0.02) | benign(0.266) | TCGA-2W-A8YY-01 | Cervix | cervical & endocervical cancer | Female | <65 | I/II | Chemotherapy | cisplatin | CR |
| SREBF2 | SNV | Missense_Mutation | | c.2674G>A | p.Asp892Asn | p.D892N | Q12772 | protein_coding | deleterious(0) | probably_damaging(0.997) | TCGA-LP-A4AV-01 | Cervix | cervical & endocervical cancer | Female | <65 | I/II | Unknown | Unknown | SD |
| SREBF2 | SNV | Missense_Mutation | | c.2661N>T | p.Trp887Cys | p.W887C | Q12772 | protein_coding | deleterious(0) | probably_damaging(0.998) | TCGA-ZJ-AAXD-01 | Cervix | cervical & endocervical cancer | Female | <65 | III/IV | Unknown | Unknown | SD |


