
|
|||||
|
 | |
| |
| |
| |
| |
| |
|
Gene: SKI |
Gene summary for SKI |
| Gene information | Species | Human | Gene symbol | SKI | Gene ID | 6497 |
| Gene name | SKI proto-oncogene | |
| Gene Alias | SGS | |
| Cytomap | 1p36.33-p36.32 | |
| Gene Type | protein-coding | GO ID | GO:0000122 | UniProtAcc | P12755 |
Top |
Malignant transformation analysis |
| Identification of the aberrant gene expression in precancerous and cancerous lesions by comparing the gene expression of stem-like cells in diseased tissues with normal stem cells |
| Entrez ID | Symbol | Replicates | Species | Organ | Tissue | Adj P-value | Log2FC | Malignancy |
| 6497 | SKI | LZE7T | Human | Esophagus | ESCC | 2.91e-05 | 2.53e-02 | 0.0667 |
| 6497 | SKI | LZE8T | Human | Esophagus | ESCC | 3.04e-06 | -2.10e-02 | 0.067 |
| 6497 | SKI | LZE24D1 | Human | Esophagus | HGIN | 1.88e-03 | 3.97e-01 | 0.054 |
| 6497 | SKI | LZE24T | Human | Esophagus | ESCC | 7.94e-05 | 6.44e-02 | 0.0596 |
| 6497 | SKI | P1T-E | Human | Esophagus | ESCC | 2.62e-04 | 5.29e-02 | 0.0875 |
| 6497 | SKI | P2T-E | Human | Esophagus | ESCC | 1.00e-14 | 2.93e-01 | 0.1177 |
| 6497 | SKI | P4T-E | Human | Esophagus | ESCC | 1.79e-06 | 1.46e-01 | 0.1323 |
| 6497 | SKI | P5T-E | Human | Esophagus | ESCC | 1.27e-12 | -3.21e-02 | 0.1327 |
| 6497 | SKI | P8T-E | Human | Esophagus | ESCC | 1.12e-18 | 4.26e-01 | 0.0889 |
| 6497 | SKI | P9T-E | Human | Esophagus | ESCC | 1.37e-10 | 2.68e-02 | 0.1131 |
| 6497 | SKI | P10T-E | Human | Esophagus | ESCC | 2.55e-11 | 3.13e-01 | 0.116 |
| 6497 | SKI | P11T-E | Human | Esophagus | ESCC | 6.32e-11 | 9.20e-02 | 0.1426 |
| 6497 | SKI | P12T-E | Human | Esophagus | ESCC | 7.72e-10 | 2.74e-01 | 0.1122 |
| 6497 | SKI | P15T-E | Human | Esophagus | ESCC | 8.66e-11 | 1.12e-01 | 0.1149 |
| 6497 | SKI | P16T-E | Human | Esophagus | ESCC | 9.05e-15 | 1.43e-01 | 0.1153 |
| 6497 | SKI | P20T-E | Human | Esophagus | ESCC | 5.25e-10 | 4.43e-02 | 0.1124 |
| 6497 | SKI | P21T-E | Human | Esophagus | ESCC | 4.21e-19 | 1.77e-01 | 0.1617 |
| 6497 | SKI | P22T-E | Human | Esophagus | ESCC | 1.64e-09 | -8.58e-02 | 0.1236 |
| 6497 | SKI | P23T-E | Human | Esophagus | ESCC | 2.27e-04 | 1.16e-01 | 0.108 |
| 6497 | SKI | P24T-E | Human | Esophagus | ESCC | 1.52e-05 | -1.57e-02 | 0.1287 |
| Page: 1 2 3 4 |
| Tissue | Expression Dynamics | Abbreviation |
| Esophagus | 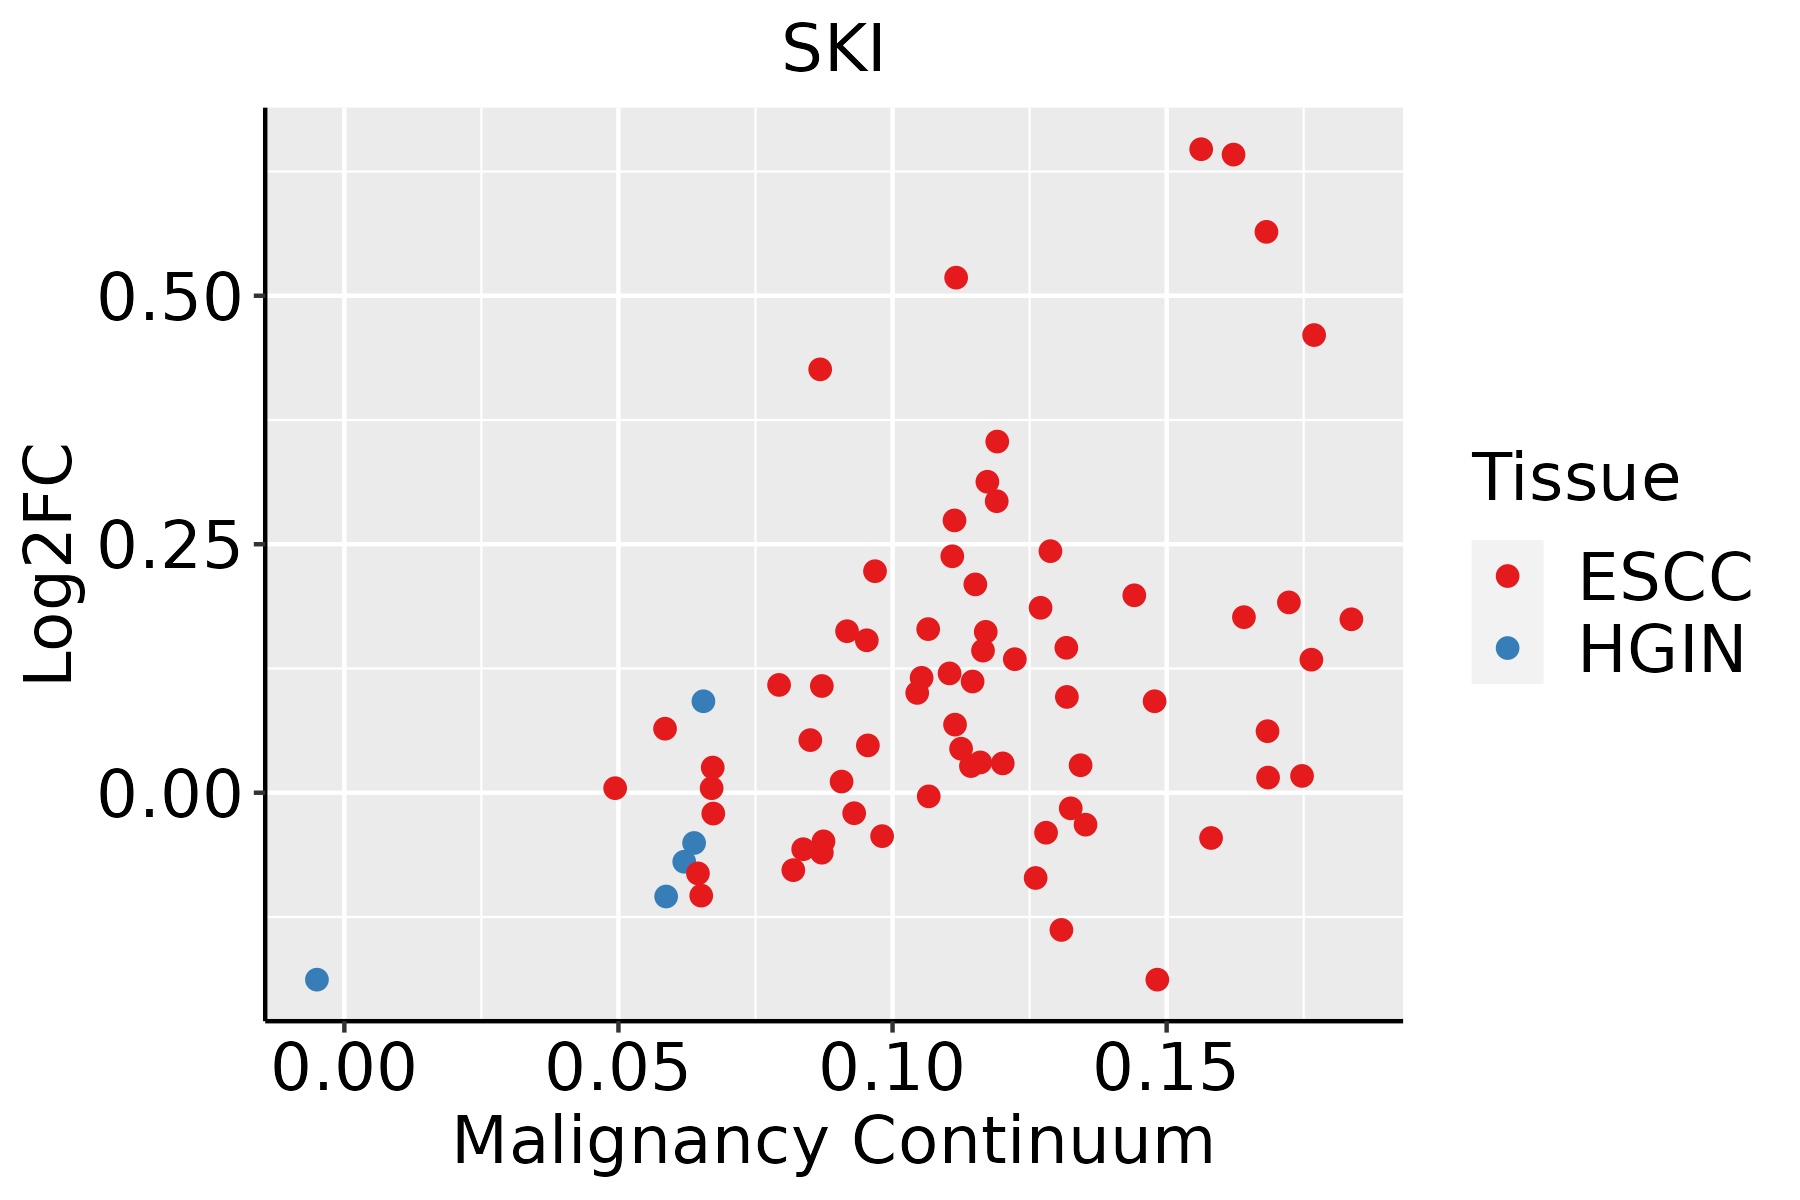 | ESCC: Esophageal squamous cell carcinoma |
| HGIN: High-grade intraepithelial neoplasias | ||
| LGIN: Low-grade intraepithelial neoplasias | ||
| Liver |  | HCC: Hepatocellular carcinoma |
| NAFLD: Non-alcoholic fatty liver disease | ||
| Thyroid | 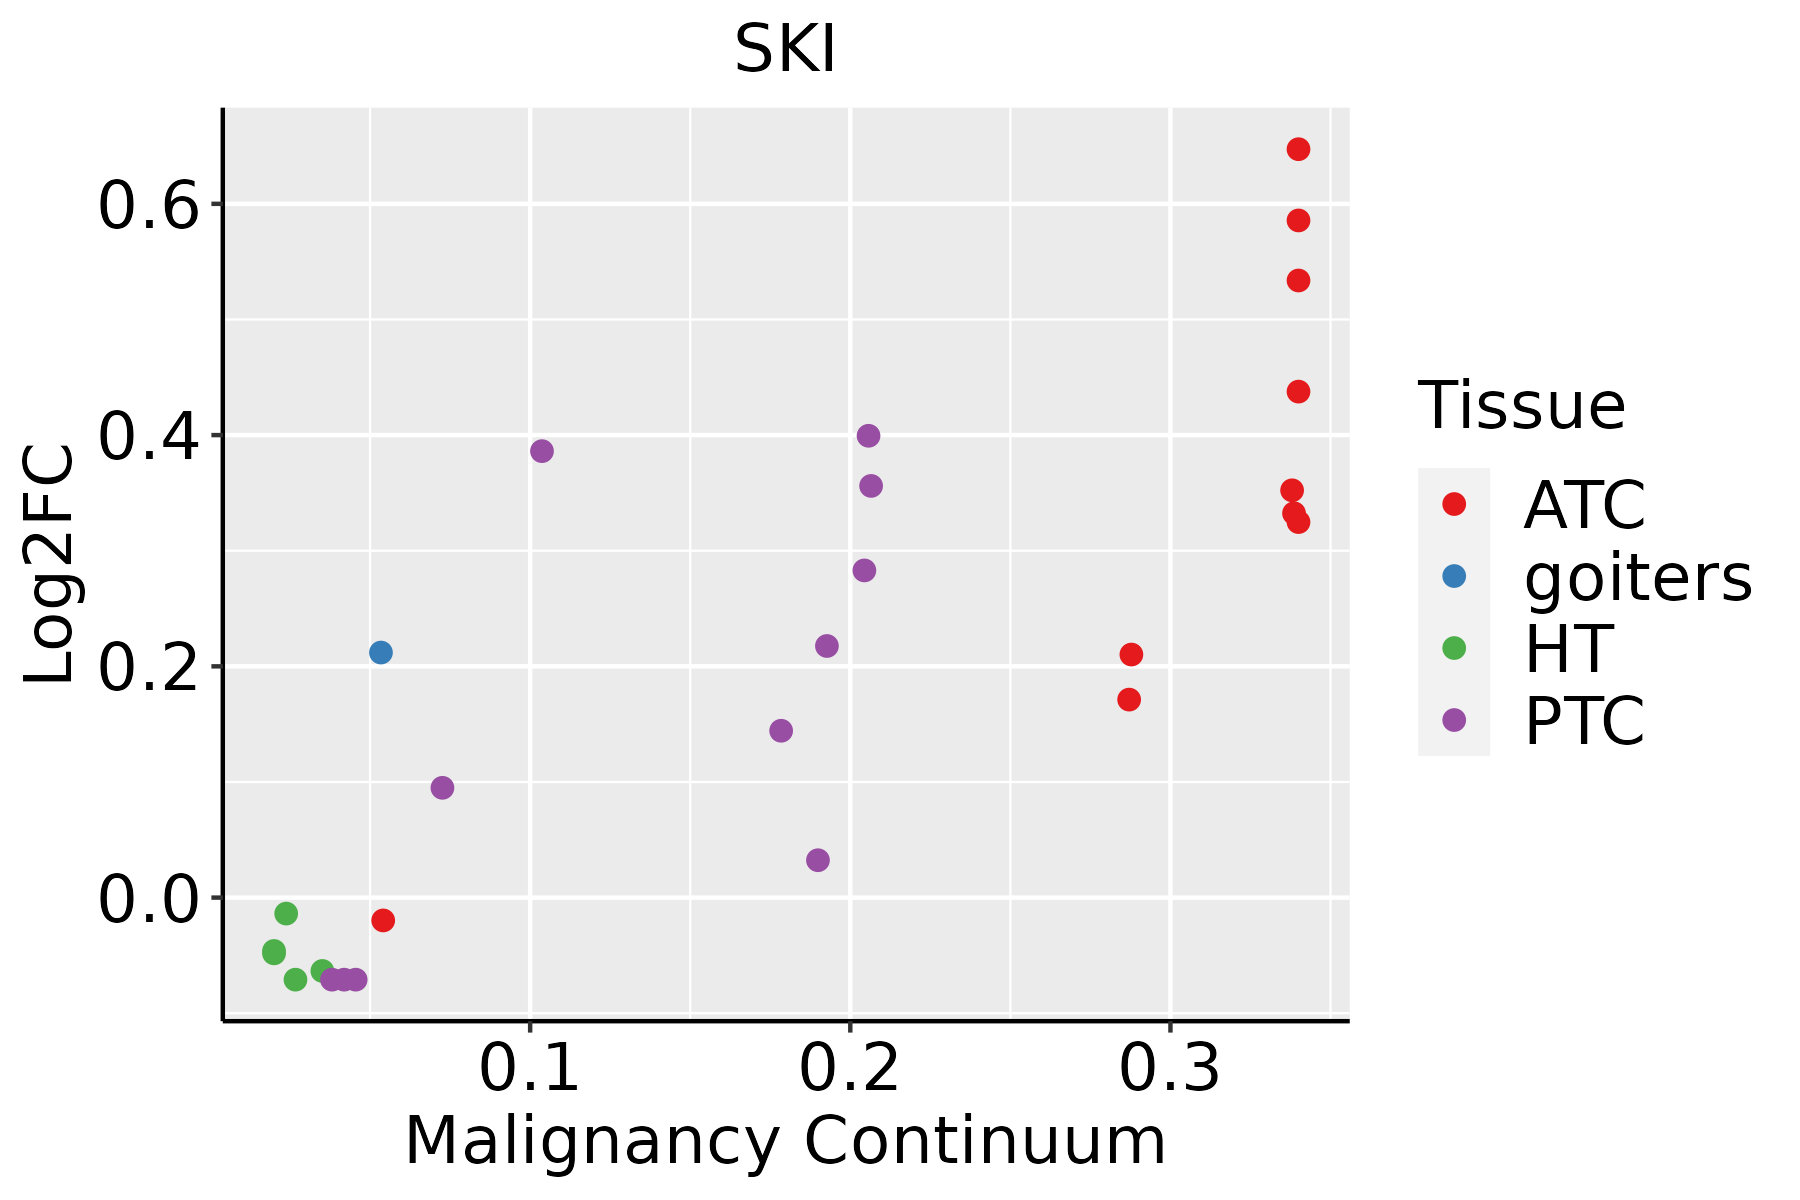 | ATC: Anaplastic thyroid cancer |
| HT: Hashimoto's thyroiditis | ||
| PTC: Papillary thyroid cancer |
| ∗log2FC in expression of this searched gene in stem-like cells from each diseased tissue sample relative to stem-like cells in normal samples in each tissue plotted against the malignancy continuum. Samples are colored based on if they are from different disease stage. |
Top |
Malignant transformation related pathway analysis |
| Find out the enriched GO biological processes and KEGG pathways involved in transition from healthy to precancer to cancer |
| Tissue | Disease Stage | Enriched GO biological Processes |
| Colorectum | AD |  |
| Colorectum | SER |  |
| Colorectum | MSS |  |
| Colorectum | MSI-H |  |
| Colorectum | FAP |  |
| ∗Top 15 enriched GO BP terms are showed in the bar plot of each disease state in each tissue. Each row represents a significant GO biological process which is colored according to the -log10(p.adjust). |
| Page: 1 2 3 4 5 6 7 8 9 |
| GO ID | Tissue | Disease Stage | Description | Gene Ratio | Bg Ratio | pvalue | p.adjust | Count |
| GO:200123525 | Oral cavity | EOLP | positive regulation of apoptotic signaling pathway | 41/2218 | 126/18723 | 6.68e-10 | 5.06e-08 | 41 |
| GO:004887226 | Oral cavity | EOLP | homeostasis of number of cells | 68/2218 | 272/18723 | 1.20e-09 | 8.27e-08 | 68 |
| GO:200123625 | Oral cavity | EOLP | regulation of extrinsic apoptotic signaling pathway | 42/2218 | 151/18723 | 7.31e-08 | 2.61e-06 | 42 |
| GO:009719125 | Oral cavity | EOLP | extrinsic apoptotic signaling pathway | 54/2218 | 219/18723 | 9.74e-08 | 3.36e-06 | 54 |
| GO:200124424 | Oral cavity | EOLP | positive regulation of intrinsic apoptotic signaling pathway | 22/2218 | 58/18723 | 2.98e-07 | 8.87e-06 | 22 |
| GO:003134621 | Oral cavity | EOLP | positive regulation of cell projection organization | 74/2218 | 353/18723 | 6.00e-07 | 1.56e-05 | 74 |
| GO:001097515 | Oral cavity | EOLP | regulation of neuron projection development | 86/2218 | 445/18723 | 2.75e-06 | 6.05e-05 | 86 |
| GO:007155916 | Oral cavity | EOLP | response to transforming growth factor beta | 56/2218 | 256/18723 | 3.54e-06 | 7.58e-05 | 56 |
| GO:190204122 | Oral cavity | EOLP | regulation of extrinsic apoptotic signaling pathway via death domain receptors | 18/2218 | 49/18723 | 6.01e-06 | 1.19e-04 | 18 |
| GO:007156016 | Oral cavity | EOLP | cellular response to transforming growth factor beta stimulus | 54/2218 | 250/18723 | 7.76e-06 | 1.49e-04 | 54 |
| GO:000170123 | Oral cavity | EOLP | in utero embryonic development | 72/2218 | 367/18723 | 1.02e-05 | 1.83e-04 | 72 |
| GO:000862521 | Oral cavity | EOLP | extrinsic apoptotic signaling pathway via death domain receptors | 24/2218 | 82/18723 | 1.73e-05 | 2.84e-04 | 24 |
| GO:200123821 | Oral cavity | EOLP | positive regulation of extrinsic apoptotic signaling pathway | 17/2218 | 48/18723 | 1.90e-05 | 3.02e-04 | 17 |
| GO:190204314 | Oral cavity | EOLP | positive regulation of extrinsic apoptotic signaling pathway via death domain receptors | 8/2218 | 13/18723 | 2.84e-05 | 4.12e-04 | 8 |
| GO:200102024 | Oral cavity | EOLP | regulation of response to DNA damage stimulus | 47/2218 | 219/18723 | 3.47e-05 | 4.85e-04 | 47 |
| GO:001072021 | Oral cavity | EOLP | positive regulation of cell development | 59/2218 | 298/18723 | 4.72e-05 | 6.25e-04 | 59 |
| GO:000717916 | Oral cavity | EOLP | transforming growth factor beta receptor signaling pathway | 43/2218 | 198/18723 | 5.48e-05 | 7.03e-04 | 43 |
| GO:000863023 | Oral cavity | EOLP | intrinsic apoptotic signaling pathway in response to DNA damage | 25/2218 | 99/18723 | 1.70e-04 | 1.78e-03 | 25 |
| GO:190384414 | Oral cavity | EOLP | regulation of cellular response to transforming growth factor beta stimulus | 30/2218 | 131/18723 | 2.66e-04 | 2.56e-03 | 30 |
| GO:00902872 | Oral cavity | EOLP | regulation of cellular response to growth factor stimulus | 57/2218 | 304/18723 | 2.84e-04 | 2.70e-03 | 57 |
| Page: 1 2 3 4 5 6 7 8 9 10 11 12 13 14 15 16 17 18 19 20 21 22 23 24 25 26 27 28 29 30 31 32 33 34 35 36 37 38 39 40 41 42 43 44 45 46 47 48 49 |
| Pathway ID | Tissue | Disease Stage | Description | Gene Ratio | Bg Ratio | pvalue | p.adjust | qvalue | Count |
| hsa043507 | Esophagus | ESCC | TGF-beta signaling pathway | 69/4205 | 108/8465 | 1.92e-03 | 5.54e-03 | 2.84e-03 | 69 |
| hsa0435014 | Esophagus | ESCC | TGF-beta signaling pathway | 69/4205 | 108/8465 | 1.92e-03 | 5.54e-03 | 2.84e-03 | 69 |
| Page: 1 |
Top |
Cell-cell communication analysis |
| Identification of potential cell-cell interactions between two cell types and their ligand-receptor pairs for different disease states |
| Ligand | Receptor | LRpair | Pathway | Tissue | Disease Stage |
| Page: 1 |
Top |
Single-cell gene regulatory network inference analysis |
| Find out the significant the regulons (TFs) and the target genes of each regulon across cell types for different disease states |
| TF | Cell Type | Tissue | Disease Stage | Target Gene | RSS | Regulon Activity |
| ∗The dot plots of a searched regulon are shown for all cell subpopulations in each disease state of each tissue based on the regulon specific score inferred using pySCENIC and by calculating the average expression. |
| Page: 1 |
Top |
Somatic mutation of malignant transformation related genes |
| Annotation of somatic variants for genes involved in malignant transformation |
| Hugo Symbol | Variant Class | Variant Classification | dbSNP RS | HGVSc | HGVSp | HGVSp Short | SWISSPROT | BIOTYPE | SIFT | PolyPhen | Tumor Sample Barcode | Tissue | Histology | Sex | Age | Stage | Therapy Types | Drugs | Outcome |
| SKI | SNV | Missense_Mutation | novel | c.644N>T | p.Glu215Val | p.E215V | P12755 | protein_coding | deleterious(0.02) | possibly_damaging(0.81) | TCGA-OL-A5D6-01 | Breast | breast invasive carcinoma | Female | >=65 | I/II | Unknown | Unknown | SD |
| SKI | SNV | Missense_Mutation | c.1435N>A | p.Asp479Asn | p.D479N | P12755 | protein_coding | tolerated(0.06) | benign(0.011) | TCGA-JX-A3Q0-01 | Cervix | cervical & endocervical cancer | Female | <65 | III/IV | Unknown | Unknown | SD | |
| SKI | SNV | Missense_Mutation | novel | c.833N>G | p.Ser278Trp | p.S278W | P12755 | protein_coding | deleterious(0) | probably_damaging(0.995) | TCGA-VS-A8QM-01 | Cervix | cervical & endocervical cancer | Female | <65 | I/II | Chemotherapy | cisplatin | PD |
| SKI | SNV | Missense_Mutation | rs752151031 | c.1400N>T | p.Thr467Met | p.T467M | P12755 | protein_coding | tolerated(0.15) | benign(0) | TCGA-AD-6889-01 | Colorectum | colon adenocarcinoma | Male | >=65 | I/II | Chemotherapy | xeloda | PD |
| SKI | SNV | Missense_Mutation | c.892G>A | p.Ala298Thr | p.A298T | P12755 | protein_coding | tolerated(0.26) | benign(0.027) | TCGA-CK-4951-01 | Colorectum | colon adenocarcinoma | Female | >=65 | I/II | Unknown | Unknown | PD | |
| SKI | SNV | Missense_Mutation | c.1670A>T | p.Glu557Val | p.E557V | P12755 | protein_coding | deleterious(0) | probably_damaging(0.991) | TCGA-DC-4749-01 | Colorectum | rectum adenocarcinoma | Male | <65 | I/II | Unknown | Unknown | SD | |
| SKI | SNV | Missense_Mutation | novel | c.1597N>A | p.Asp533Asn | p.D533N | P12755 | protein_coding | tolerated(0.27) | benign(0.059) | TCGA-AP-A1DV-01 | Endometrium | uterine corpus endometrioid carcinoma | Female | <65 | I/II | Unknown | Unknown | SD |
| SKI | SNV | Missense_Mutation | novel | c.434A>G | p.Glu145Gly | p.E145G | P12755 | protein_coding | deleterious(0) | possibly_damaging(0.553) | TCGA-AP-A1E0-01 | Endometrium | uterine corpus endometrioid carcinoma | Female | <65 | III/IV | Chemotherapy | paclitaxel | SD |
| SKI | SNV | Missense_Mutation | novel | c.1945N>A | p.Val649Met | p.V649M | P12755 | protein_coding | deleterious(0.01) | benign(0.38) | TCGA-AX-A2H4-01 | Endometrium | uterine corpus endometrioid carcinoma | Female | >=65 | III/IV | Unknown | Unknown | PD |
| SKI | SNV | Missense_Mutation | c.477G>T | p.Glu159Asp | p.E159D | P12755 | protein_coding | tolerated(0.08) | benign(0.007) | TCGA-AX-A2HC-01 | Endometrium | uterine corpus endometrioid carcinoma | Female | <65 | III/IV | Chemotherapy | paclitaxel | PD |
| Page: 1 2 3 4 |
Top |
Related drugs of malignant transformation related genes |
| Identification of chemicals and drugs interact with genes involved in malignant transfromation |
| (DGIdb 4.0) |
| Entrez ID | Symbol | Category | Interaction Types | Drug Claim Name | Drug Name | PMIDs |
| Page: 1 |

Copyright 2023-Present -The University of Texas Health Science Center at Houston |