
|
|||||
|
 | |
| |
| |
| |
| |
| |
|
Gene: POLDIP2 |
Gene summary for POLDIP2 |
| Gene information | Species | Human | Gene symbol | POLDIP2 | Gene ID | 26073 |
| Gene name | DNA polymerase delta interacting protein 2 | |
| Gene Alias | PDIP38 | |
| Cytomap | 17q11.2 | |
| Gene Type | protein-coding | GO ID | GO:0000226 | UniProtAcc | B4DEM9 |
Top |
Malignant transformation analysis |
| Identification of the aberrant gene expression in precancerous and cancerous lesions by comparing the gene expression of stem-like cells in diseased tissues with normal stem cells |
| Entrez ID | Symbol | Replicates | Species | Organ | Tissue | Adj P-value | Log2FC | Malignancy |
| 26073 | POLDIP2 | GSM4909286 | Human | Breast | IDC | 2.35e-04 | 1.50e-01 | 0.1081 |
| 26073 | POLDIP2 | GSM4909294 | Human | Breast | IDC | 1.72e-02 | 2.35e-01 | 0.2022 |
| 26073 | POLDIP2 | GSM4909311 | Human | Breast | IDC | 3.14e-09 | -8.46e-02 | 0.1534 |
| 26073 | POLDIP2 | GSM4909312 | Human | Breast | IDC | 1.02e-04 | 4.98e-02 | 0.1552 |
| 26073 | POLDIP2 | GSM4909319 | Human | Breast | IDC | 2.84e-20 | 8.76e-02 | 0.1563 |
| 26073 | POLDIP2 | GSM4909321 | Human | Breast | IDC | 1.84e-03 | 4.08e-02 | 0.1559 |
| 26073 | POLDIP2 | brca1 | Human | Breast | Precancer | 1.16e-03 | 1.95e-01 | -0.0338 |
| 26073 | POLDIP2 | brca2 | Human | Breast | Precancer | 4.46e-04 | 2.03e-01 | -0.024 |
| 26073 | POLDIP2 | NCCBC2 | Human | Breast | DCIS | 3.70e-07 | 5.42e-01 | 0.1554 |
| 26073 | POLDIP2 | NCCBC5 | Human | Breast | DCIS | 2.15e-07 | 2.88e-01 | 0.2046 |
| 26073 | POLDIP2 | P1 | Human | Breast | IDC | 2.63e-02 | -2.86e-02 | 0.1527 |
| 26073 | POLDIP2 | DCIS2 | Human | Breast | DCIS | 5.37e-28 | 4.47e-02 | 0.0085 |
| 26073 | POLDIP2 | HTA11_3410_2000001011 | Human | Colorectum | AD | 9.02e-05 | 1.34e-01 | 0.0155 |
| 26073 | POLDIP2 | HTA11_2487_2000001011 | Human | Colorectum | SER | 9.80e-06 | 2.90e-01 | -0.1808 |
| 26073 | POLDIP2 | HTA11_1938_2000001011 | Human | Colorectum | AD | 1.08e-04 | 3.48e-01 | -0.0811 |
| 26073 | POLDIP2 | HTA11_78_2000001011 | Human | Colorectum | AD | 4.05e-02 | 1.75e-01 | -0.1088 |
| 26073 | POLDIP2 | HTA11_347_2000001011 | Human | Colorectum | AD | 1.72e-11 | 3.72e-01 | -0.1954 |
| 26073 | POLDIP2 | HTA11_411_2000001011 | Human | Colorectum | SER | 1.69e-04 | 5.57e-01 | -0.2602 |
| 26073 | POLDIP2 | HTA11_3361_2000001011 | Human | Colorectum | AD | 2.06e-03 | 2.66e-01 | -0.1207 |
| 26073 | POLDIP2 | HTA11_696_2000001011 | Human | Colorectum | AD | 1.15e-08 | 3.04e-01 | -0.1464 |
| Page: 1 2 3 4 5 6 7 8 9 |
| Tissue | Expression Dynamics | Abbreviation |
| Breast | 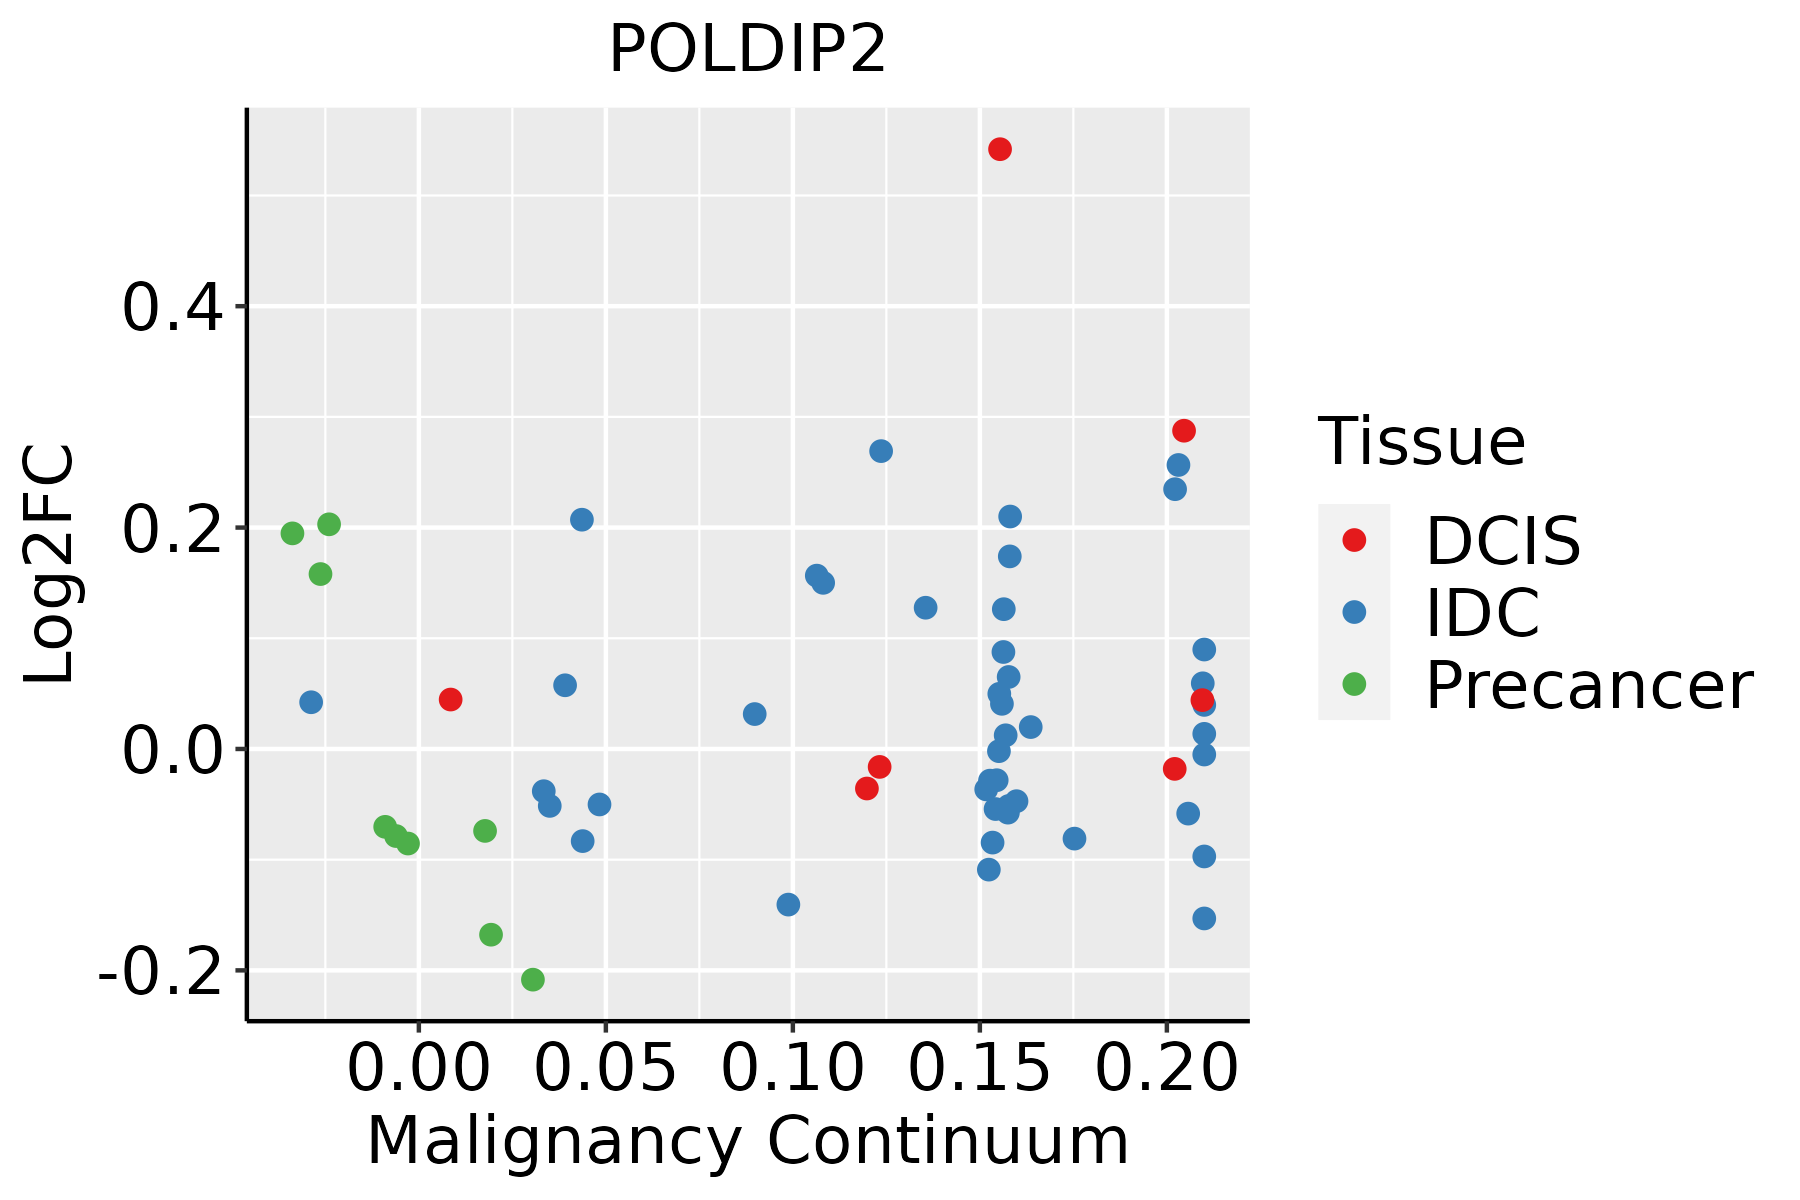 | IDC: Invasive ductal carcinoma |
| DCIS: Ductal carcinoma in situ | ||
| Precancer(BRCA1-mut): Precancerous lesion from BRCA1 mutation carriers | ||
| Colorectum (GSE201348) |  | FAP: Familial adenomatous polyposis |
| CRC: Colorectal cancer | ||
| Colorectum (HTA11) | 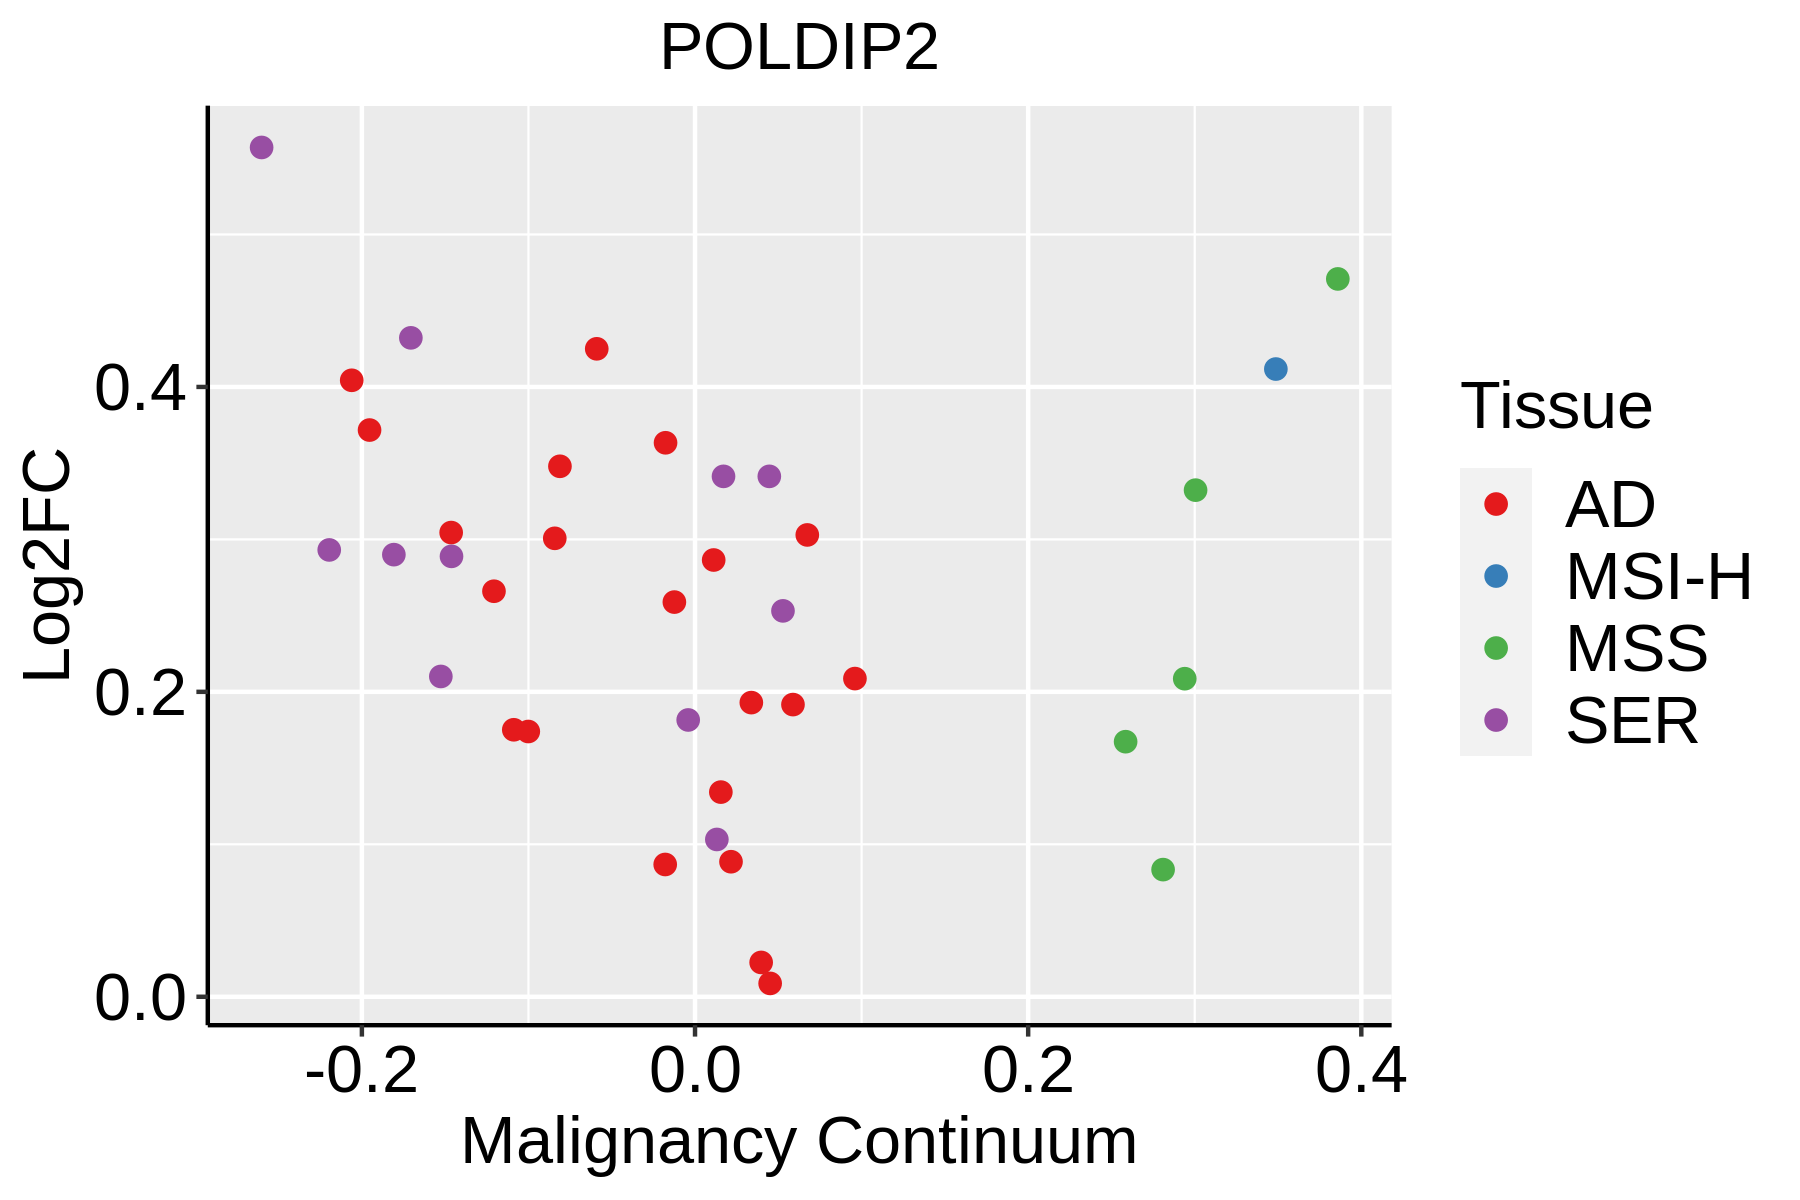 | AD: Adenomas |
| SER: Sessile serrated lesions | ||
| MSI-H: Microsatellite-high colorectal cancer | ||
| MSS: Microsatellite stable colorectal cancer | ||
| Esophagus | 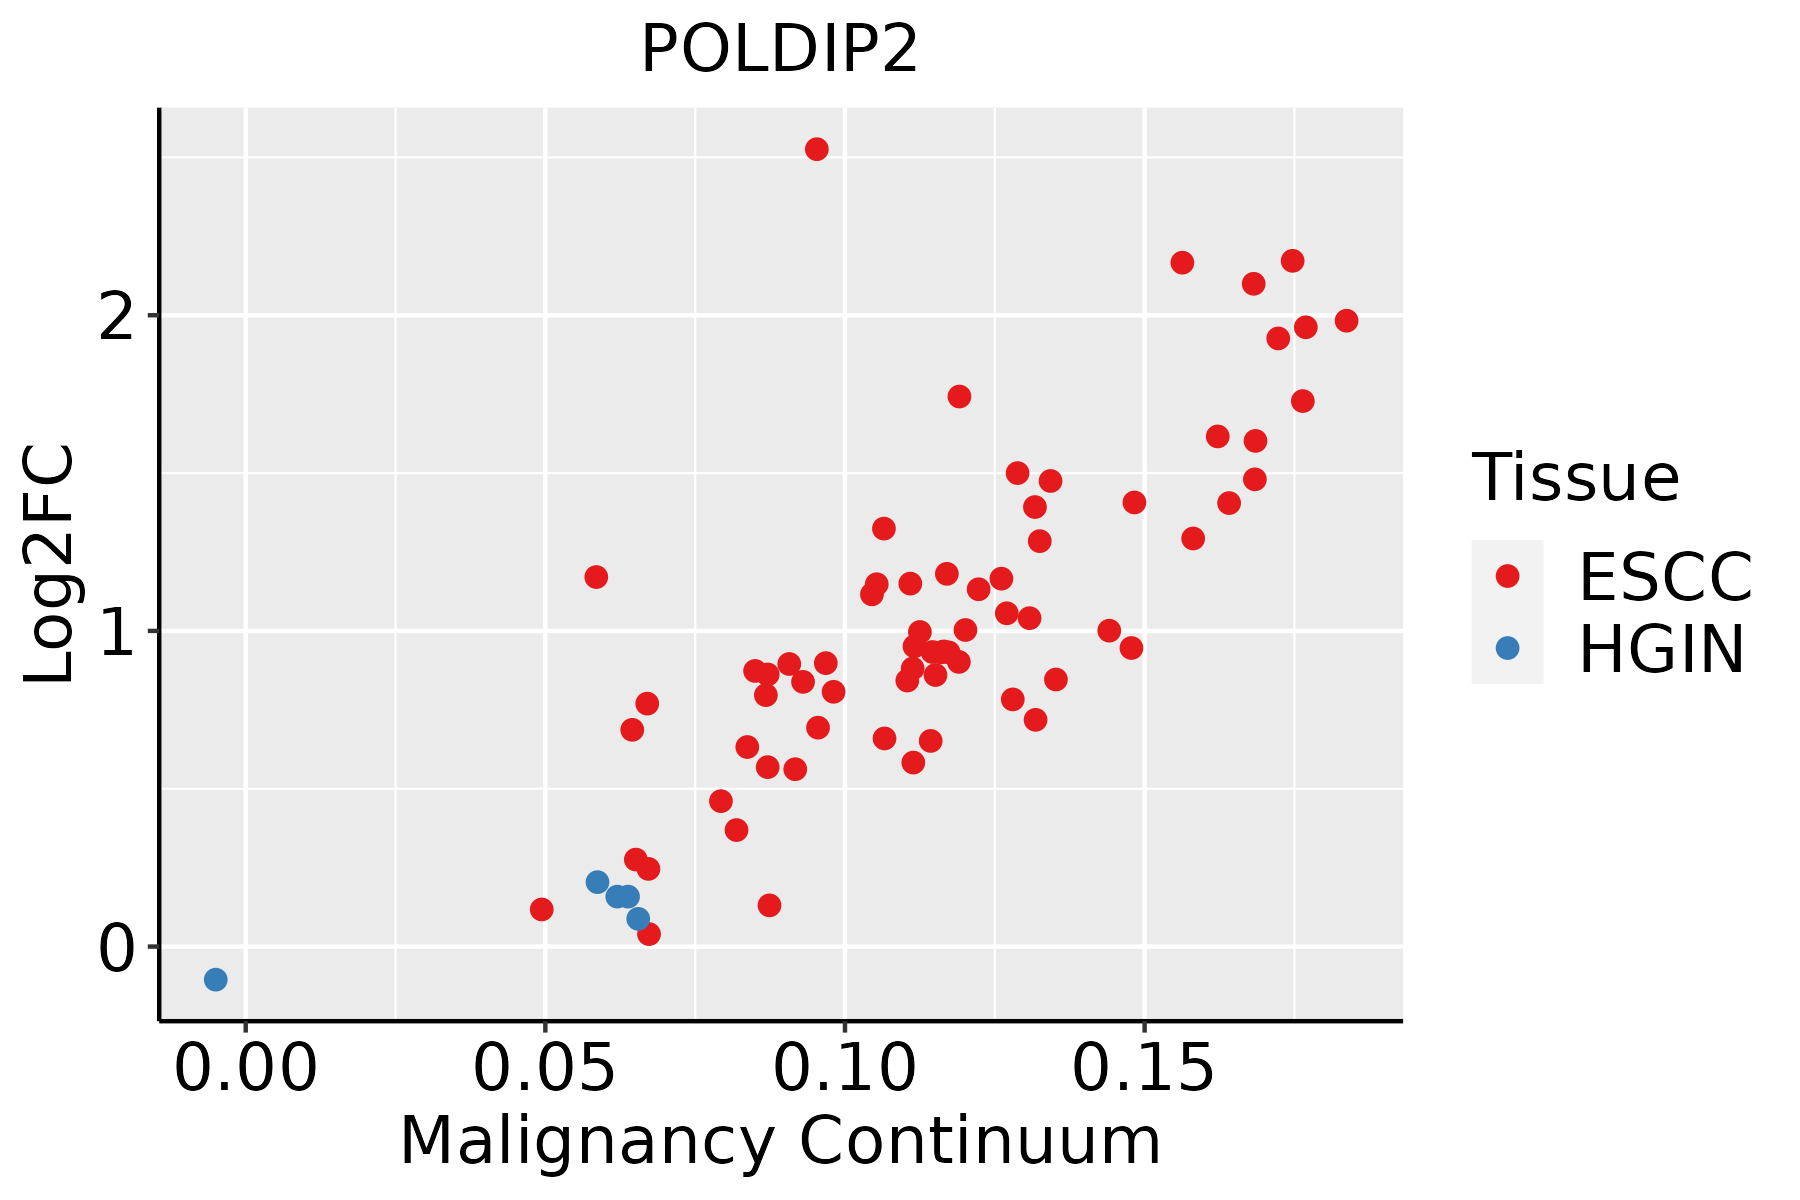 | ESCC: Esophageal squamous cell carcinoma |
| HGIN: High-grade intraepithelial neoplasias | ||
| LGIN: Low-grade intraepithelial neoplasias | ||
| Liver | 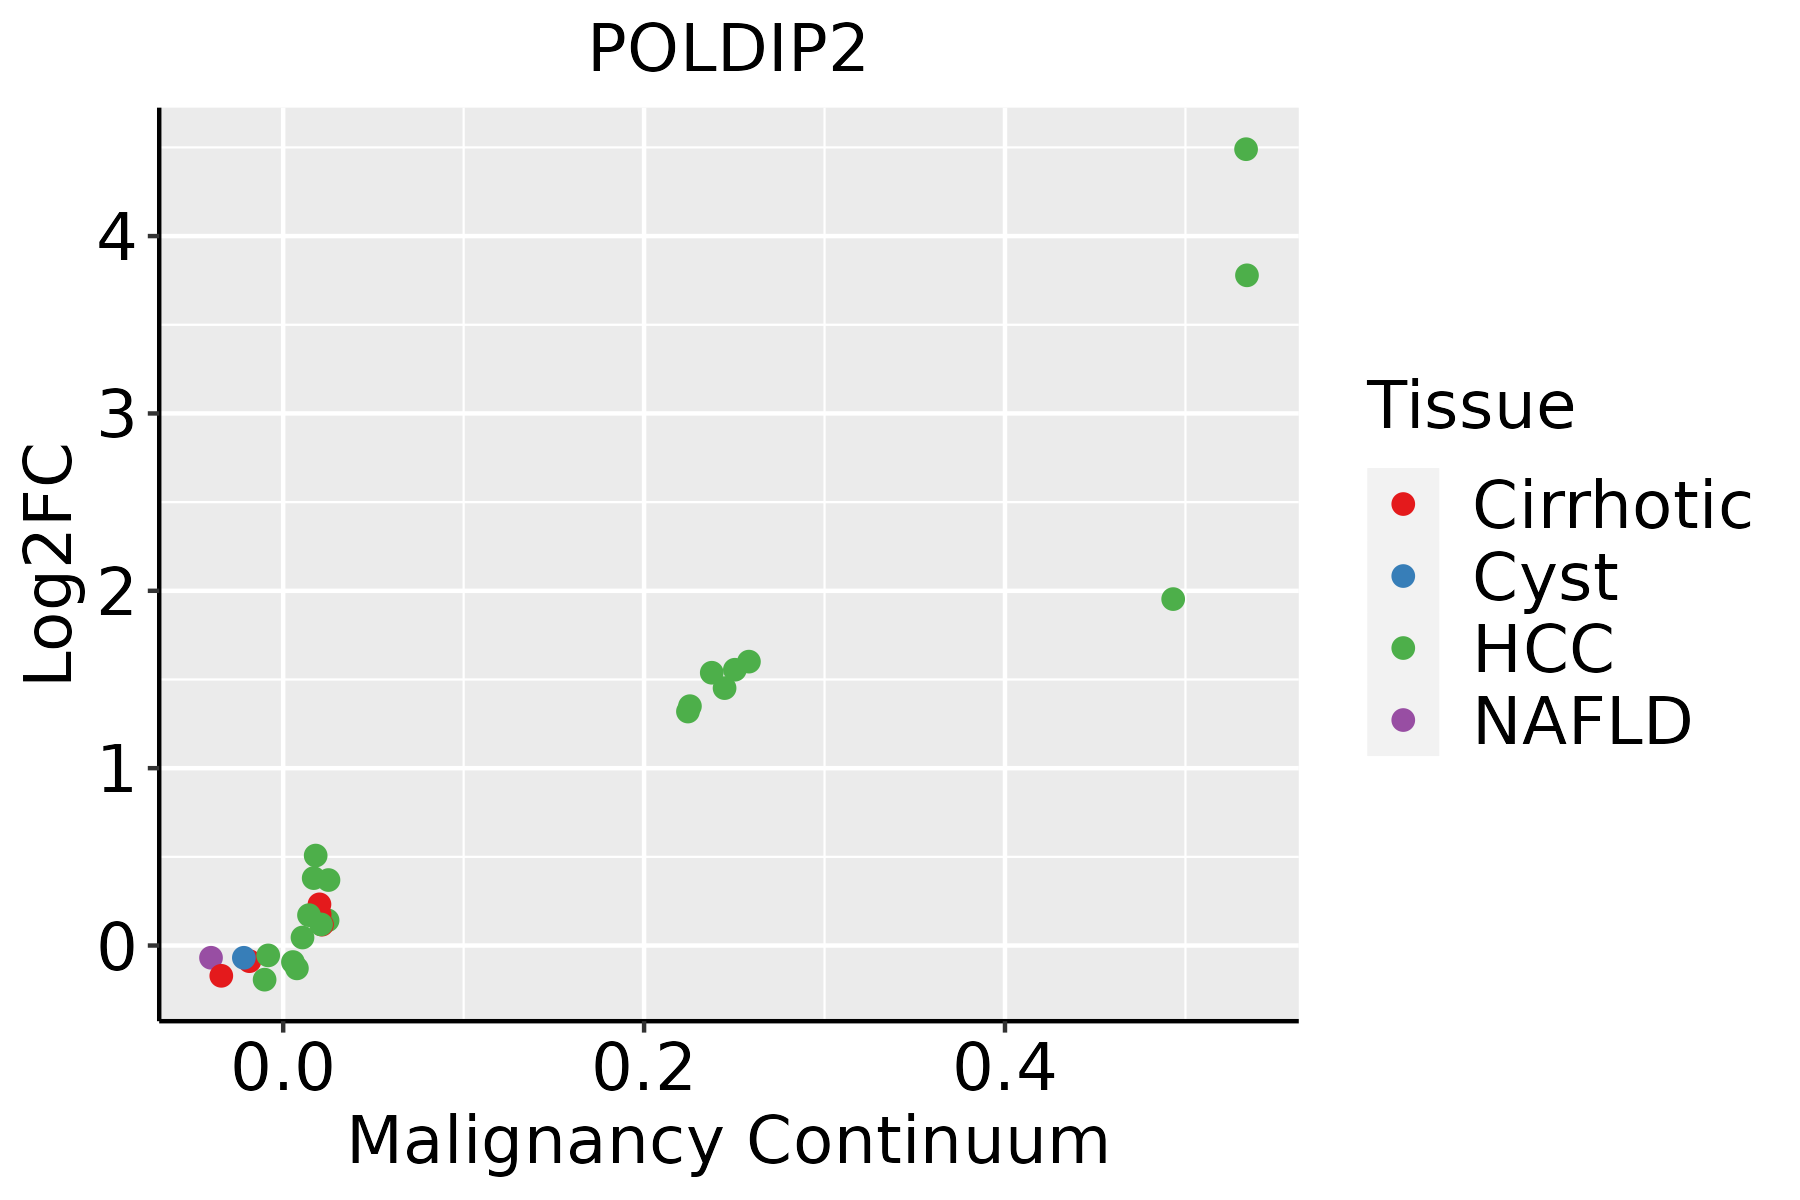 | HCC: Hepatocellular carcinoma |
| NAFLD: Non-alcoholic fatty liver disease | ||
| Oral Cavity | 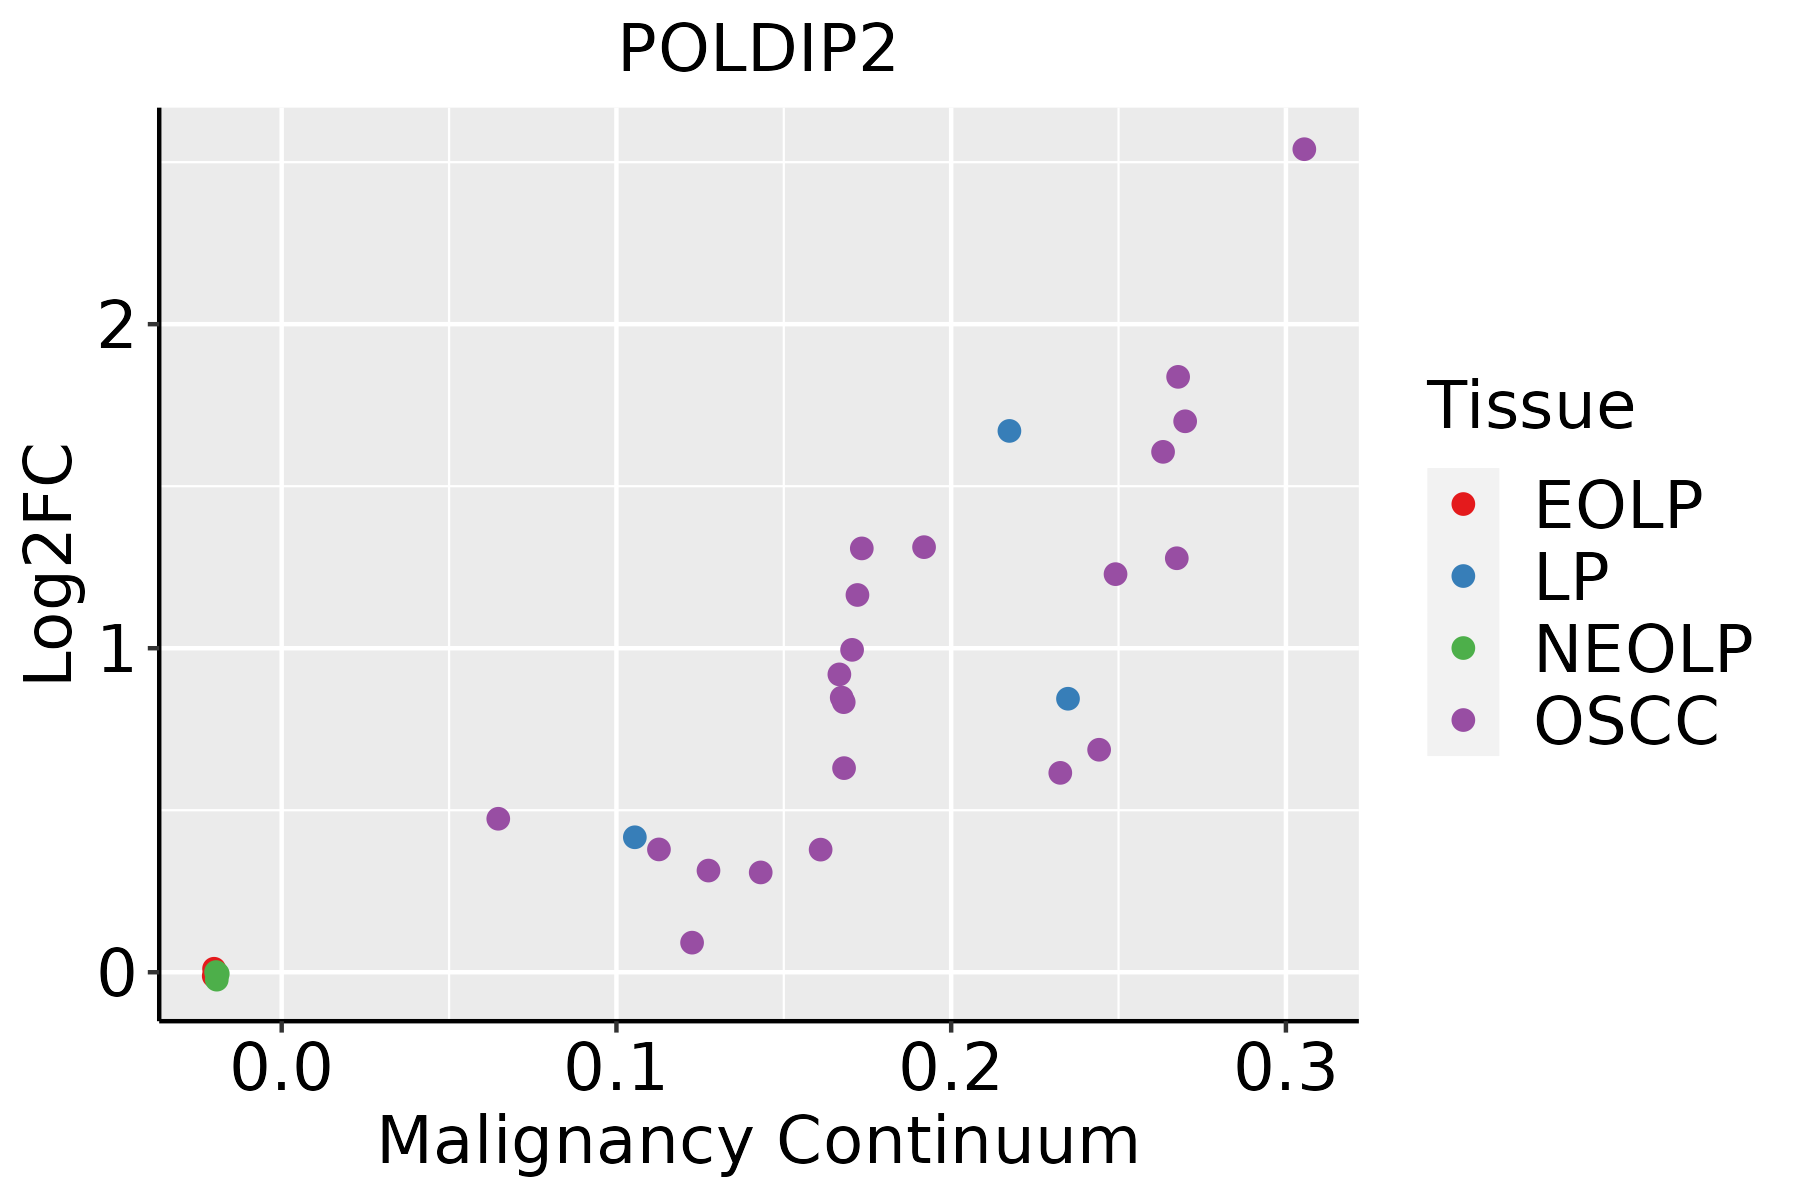 | EOLP: Erosive Oral lichen planus |
| LP: leukoplakia | ||
| NEOLP: Non-erosive oral lichen planus | ||
| OSCC: Oral squamous cell carcinoma | ||
| Skin | 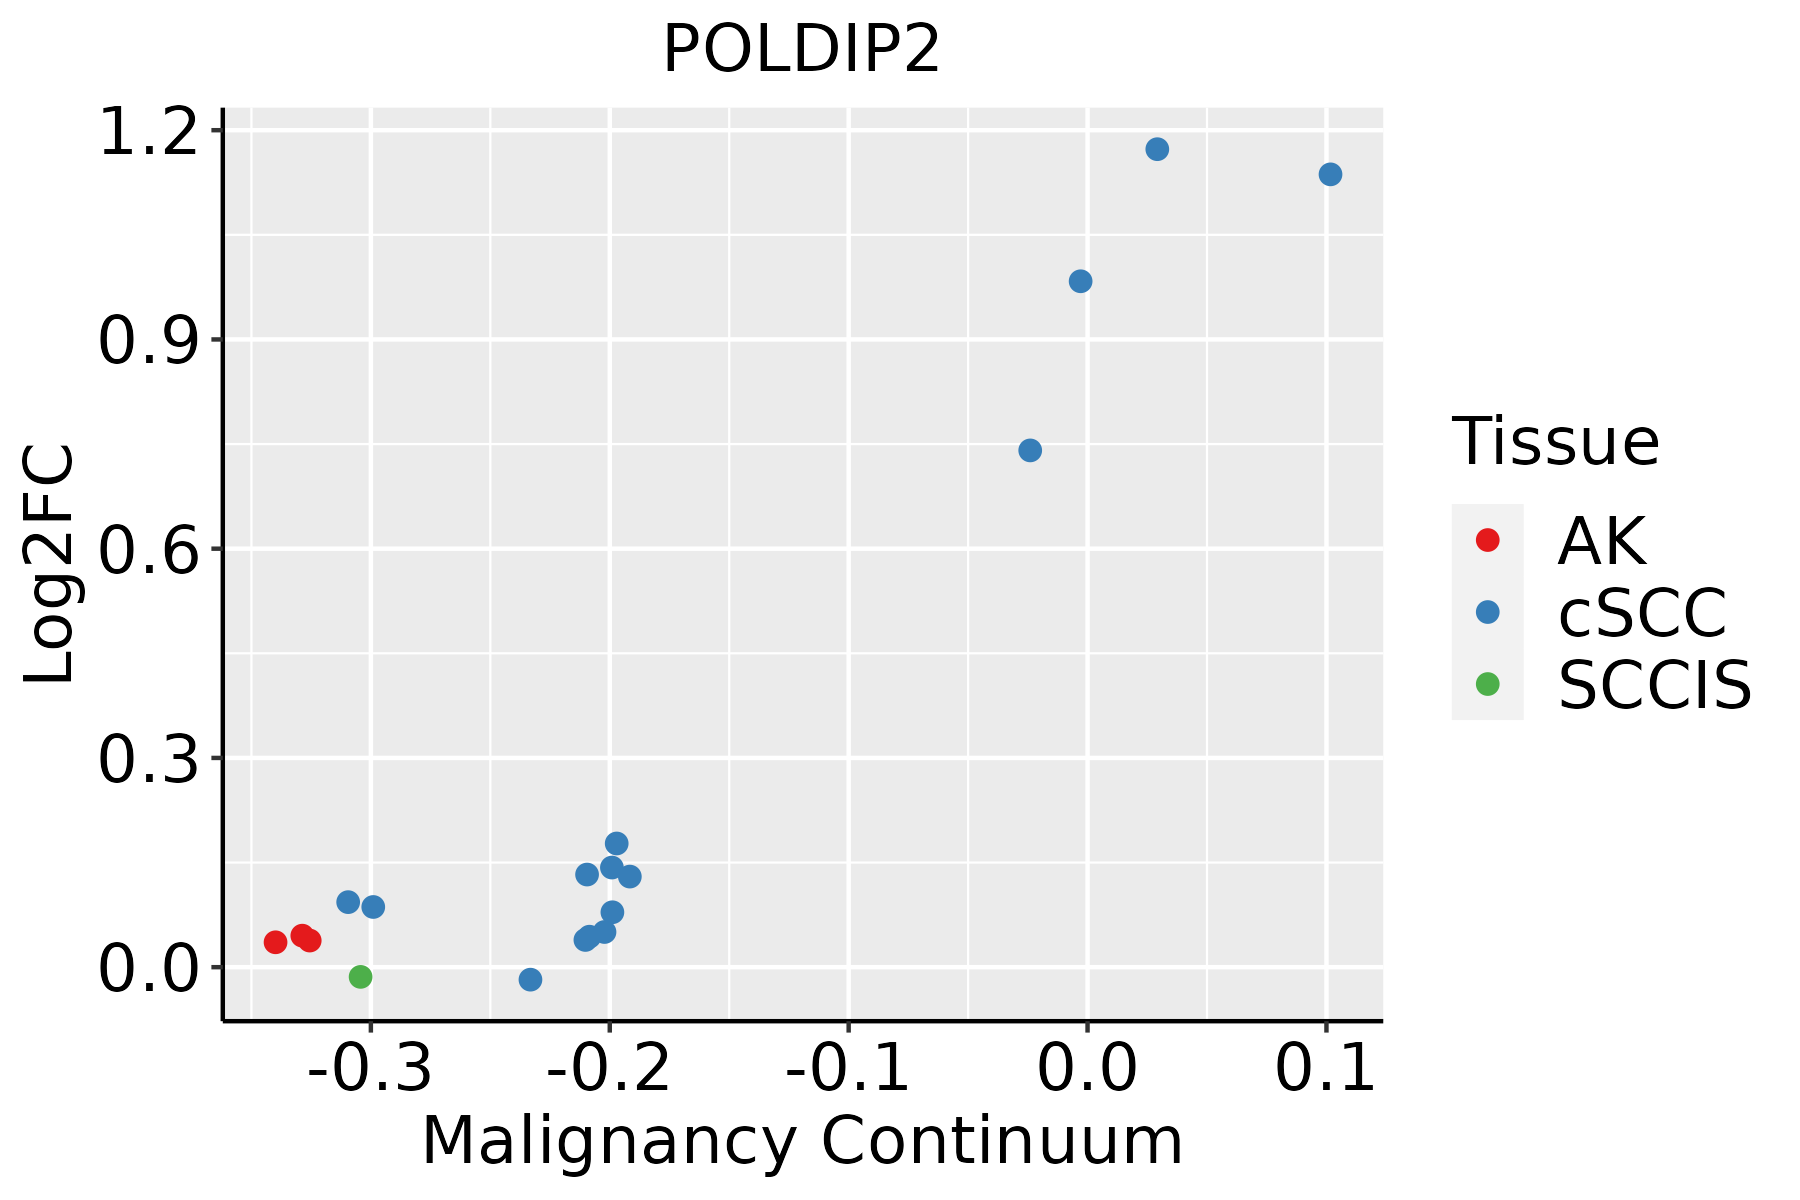 | AK: Actinic keratosis |
| cSCC: Cutaneous squamous cell carcinoma | ||
| SCCIS:squamous cell carcinoma in situ | ||
| Thyroid | 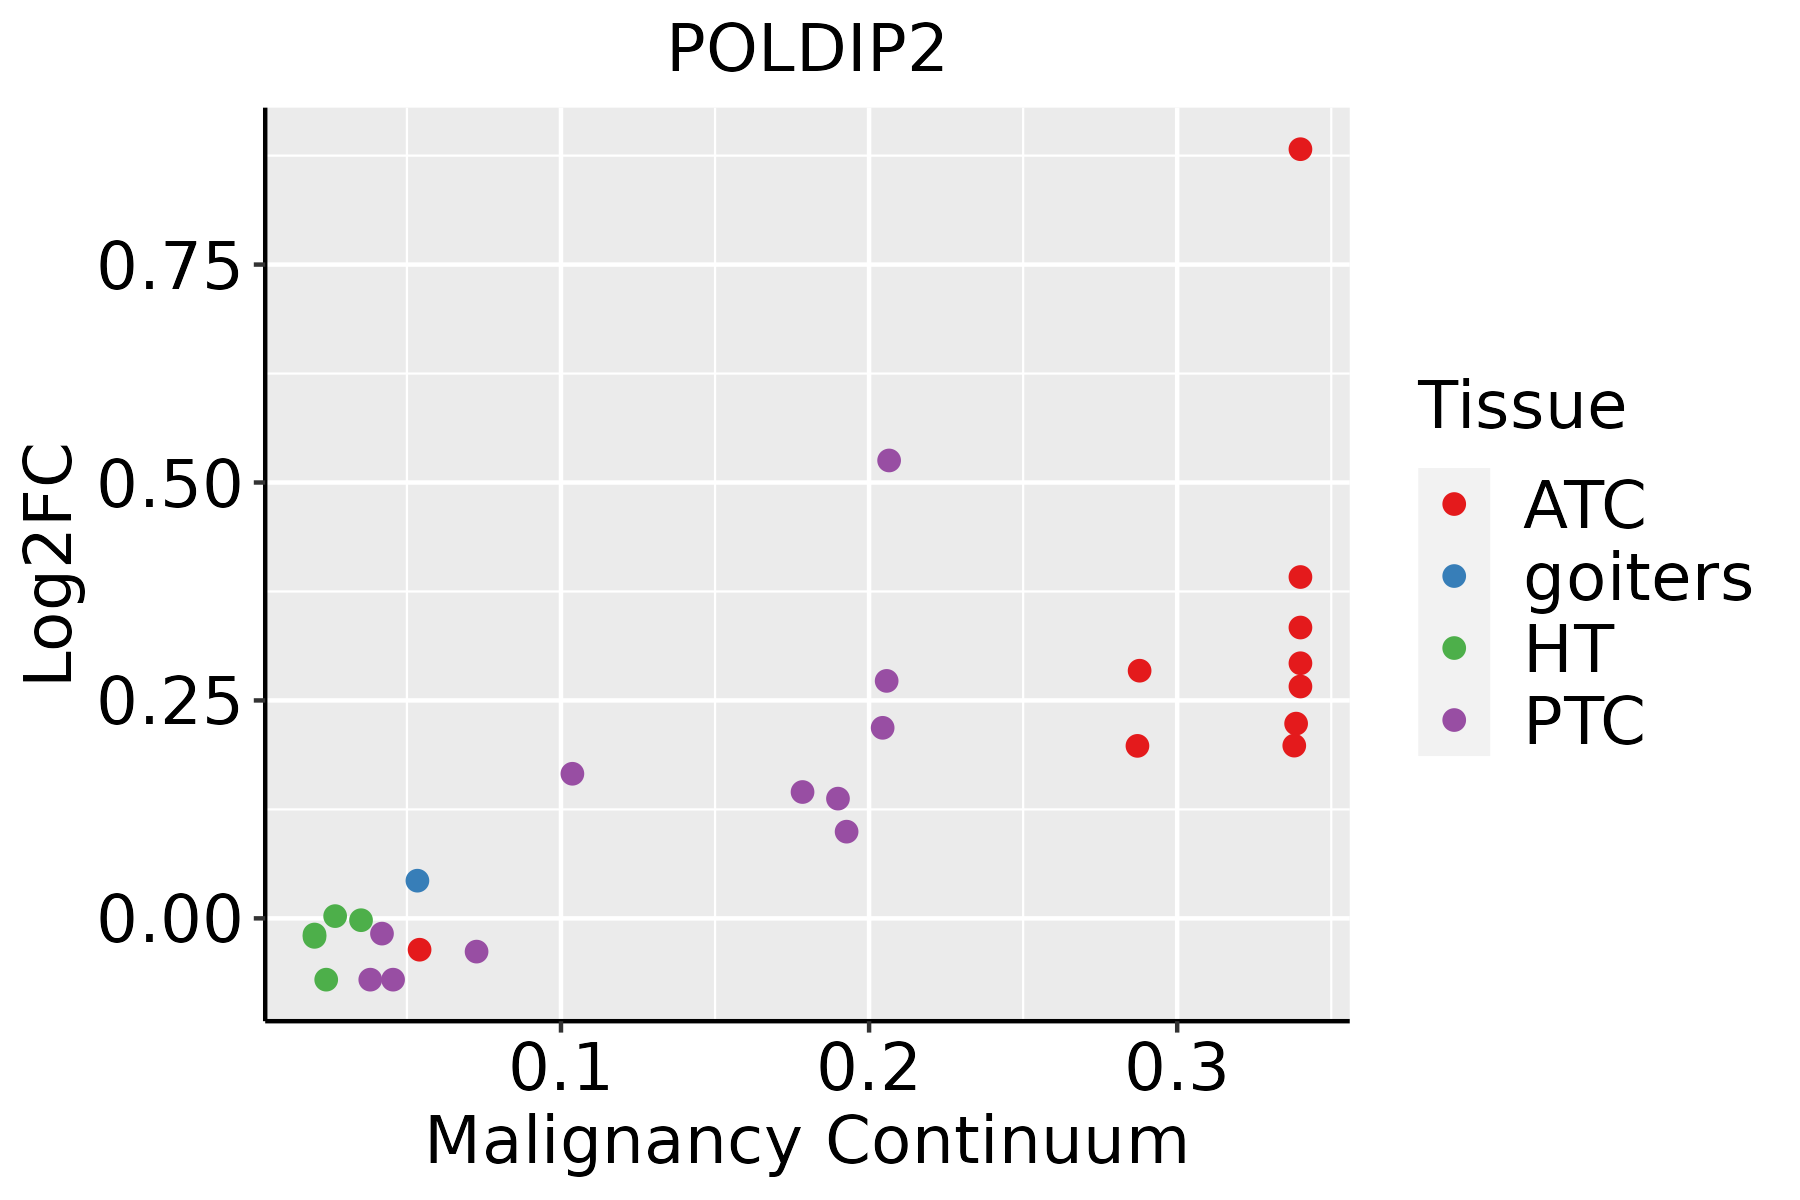 | ATC: Anaplastic thyroid cancer |
| HT: Hashimoto's thyroiditis | ||
| PTC: Papillary thyroid cancer |
| ∗log2FC in expression of this searched gene in stem-like cells from each diseased tissue sample relative to stem-like cells in normal samples in each tissue plotted against the malignancy continuum. Samples are colored based on if they are from different disease stage. |
Top |
Malignant transformation related pathway analysis |
| Find out the enriched GO biological processes and KEGG pathways involved in transition from healthy to precancer to cancer |
| Tissue | Disease Stage | Enriched GO biological Processes |
| Colorectum | AD |  |
| Colorectum | SER |  |
| Colorectum | MSS |  |
| Colorectum | MSI-H |  |
| Colorectum | FAP |  |
| ∗Top 15 enriched GO BP terms are showed in the bar plot of each disease state in each tissue. Each row represents a significant GO biological process which is colored according to the -log10(p.adjust). |
| Page: 1 2 3 4 5 6 7 8 9 |
| GO ID | Tissue | Disease Stage | Description | Gene Ratio | Bg Ratio | pvalue | p.adjust | Count |
| GO:003432924 | Thyroid | ATC | cell junction assembly | 187/6293 | 420/18723 | 1.71e-06 | 2.08e-05 | 187 |
| GO:007189723 | Thyroid | ATC | DNA biosynthetic process | 91/6293 | 180/18723 | 1.84e-06 | 2.24e-05 | 91 |
| GO:015011723 | Thyroid | ATC | positive regulation of cell-substrate junction organization | 24/6293 | 33/18723 | 4.98e-06 | 5.40e-05 | 24 |
| GO:0001954111 | Thyroid | ATC | positive regulation of cell-matrix adhesion | 36/6293 | 58/18723 | 8.43e-06 | 8.50e-05 | 36 |
| GO:004308719 | Thyroid | ATC | regulation of GTPase activity | 153/6293 | 348/18723 | 3.24e-05 | 2.68e-04 | 153 |
| GO:005189416 | Thyroid | ATC | positive regulation of focal adhesion assembly | 20/6293 | 28/18723 | 4.82e-05 | 3.85e-04 | 20 |
| GO:190188818 | Thyroid | ATC | regulation of cell junction assembly | 94/6293 | 204/18723 | 1.38e-04 | 9.65e-04 | 94 |
| GO:003246511 | Thyroid | ATC | regulation of cytokinesis | 47/6293 | 92/18723 | 3.95e-04 | 2.39e-03 | 47 |
| GO:001050713 | Thyroid | ATC | negative regulation of autophagy | 44/6293 | 85/18723 | 4.13e-04 | 2.49e-03 | 44 |
| GO:00513027 | Thyroid | ATC | regulation of cell division | 80/6293 | 177/18723 | 8.54e-04 | 4.68e-03 | 80 |
| GO:003300214 | Thyroid | ATC | muscle cell proliferation | 107/6293 | 248/18723 | 1.03e-03 | 5.47e-03 | 107 |
| GO:007058413 | Thyroid | ATC | mitochondrion morphogenesis | 14/6293 | 21/18723 | 1.99e-03 | 9.54e-03 | 14 |
| GO:004865916 | Thyroid | ATC | smooth muscle cell proliferation | 81/6293 | 184/18723 | 2.02e-03 | 9.60e-03 | 81 |
| GO:001624212 | Thyroid | ATC | negative regulation of macroautophagy | 20/6293 | 34/18723 | 2.22e-03 | 1.04e-02 | 20 |
| GO:000630111 | Thyroid | ATC | postreplication repair | 18/6293 | 31/18723 | 4.45e-03 | 1.84e-02 | 18 |
| GO:004354715 | Thyroid | ATC | positive regulation of GTPase activity | 106/6293 | 255/18723 | 4.58e-03 | 1.89e-02 | 106 |
| GO:19044241 | Thyroid | ATC | regulation of GTP binding | 10/6293 | 15/18723 | 9.05e-03 | 3.39e-02 | 10 |
| GO:0051781 | Thyroid | ATC | positive regulation of cell division | 41/6293 | 89/18723 | 9.71e-03 | 3.56e-02 | 41 |
| Page: 1 2 3 4 5 6 7 8 9 10 11 12 13 14 15 16 17 18 19 20 21 22 23 24 25 26 |
| Pathway ID | Tissue | Disease Stage | Description | Gene Ratio | Bg Ratio | pvalue | p.adjust | qvalue | Count |
| Page: 1 |
Top |
Cell-cell communication analysis |
| Identification of potential cell-cell interactions between two cell types and their ligand-receptor pairs for different disease states |
| Ligand | Receptor | LRpair | Pathway | Tissue | Disease Stage |
| Page: 1 |
Top |
Single-cell gene regulatory network inference analysis |
| Find out the significant the regulons (TFs) and the target genes of each regulon across cell types for different disease states |
| TF | Cell Type | Tissue | Disease Stage | Target Gene | RSS | Regulon Activity |
| ∗The dot plots of a searched regulon are shown for all cell subpopulations in each disease state of each tissue based on the regulon specific score inferred using pySCENIC and by calculating the average expression. |
| Page: 1 |
Top |
Somatic mutation of malignant transformation related genes |
| Annotation of somatic variants for genes involved in malignant transformation |
| Hugo Symbol | Variant Class | Variant Classification | dbSNP RS | HGVSc | HGVSp | HGVSp Short | SWISSPROT | BIOTYPE | SIFT | PolyPhen | Tumor Sample Barcode | Tissue | Histology | Sex | Age | Stage | Therapy Types | Drugs | Outcome |
| POLDIP2 | SNV | Missense_Mutation | novel | c.326C>A | p.Ser109Tyr | p.S109Y | Q9Y2S7 | protein_coding | tolerated(0.23) | benign(0.112) | TCGA-AA-A010-01 | Colorectum | colon adenocarcinoma | Female | <65 | I/II | Chemotherapy | folinic | CR |
| POLDIP2 | SNV | Missense_Mutation | novel | c.596N>T | p.Arg199Ile | p.R199I | Q9Y2S7 | protein_coding | deleterious(0) | benign(0.306) | TCGA-AZ-4315-01 | Colorectum | colon adenocarcinoma | Male | <65 | I/II | Unknown | Unknown | SD |
| POLDIP2 | SNV | Missense_Mutation | novel | c.359N>A | p.Gly120Asp | p.G120D | Q9Y2S7 | protein_coding | tolerated(0.31) | benign(0.035) | TCGA-AG-A002-01 | Colorectum | rectum adenocarcinoma | Male | <65 | I/II | Unknown | Unknown | SD |
| POLDIP2 | SNV | Missense_Mutation | novel | c.1013N>T | p.Arg338Ile | p.R338I | Q9Y2S7 | protein_coding | deleterious(0) | probably_damaging(0.909) | TCGA-AJ-A5DW-01 | Endometrium | uterine corpus endometrioid carcinoma | Female | <65 | I/II | Unknown | Unknown | SD |
| POLDIP2 | SNV | Missense_Mutation | novel | c.601N>A | p.Leu201Ile | p.L201I | Q9Y2S7 | protein_coding | deleterious(0.04) | probably_damaging(0.934) | TCGA-AX-A05Z-01 | Endometrium | uterine corpus endometrioid carcinoma | Female | <65 | III/IV | Chemotherapy | adriamycin | SD |
| POLDIP2 | SNV | Missense_Mutation | novel | c.262N>G | p.Phe88Val | p.F88V | Q9Y2S7 | protein_coding | deleterious(0) | possibly_damaging(0.521) | TCGA-AX-A0J0-01 | Endometrium | uterine corpus endometrioid carcinoma | Female | <65 | I/II | Unknown | Unknown | SD |
| POLDIP2 | SNV | Missense_Mutation | rs782542378 | c.844N>T | p.Arg282Trp | p.R282W | Q9Y2S7 | protein_coding | deleterious(0.01) | probably_damaging(0.913) | TCGA-AX-A1C5-01 | Endometrium | uterine corpus endometrioid carcinoma | Female | <65 | III/IV | Unspecific | Carboplatin | SD |
| POLDIP2 | SNV | Missense_Mutation | novel | c.455N>T | p.Thr152Ile | p.T152I | Q9Y2S7 | protein_coding | deleterious(0.01) | benign(0.084) | TCGA-AX-A1CE-01 | Endometrium | uterine corpus endometrioid carcinoma | Female | <65 | I/II | Unspecific | Paclitaxel | SD |
| POLDIP2 | SNV | Missense_Mutation | novel | c.1033G>C | p.Asp345His | p.D345H | Q9Y2S7 | protein_coding | deleterious(0) | possibly_damaging(0.718) | TCGA-B5-A11R-01 | Endometrium | uterine corpus endometrioid carcinoma | Female | <65 | I/II | Chemotherapy | paclitaxel | SD |
| POLDIP2 | SNV | Missense_Mutation | novel | c.1057C>A | p.Leu353Met | p.L353M | Q9Y2S7 | protein_coding | deleterious(0) | probably_damaging(0.996) | TCGA-B5-A1MX-01 | Endometrium | uterine corpus endometrioid carcinoma | Female | <65 | I/II | Hormone Therapy | megace | SD |
| Page: 1 2 3 |
Top |
Related drugs of malignant transformation related genes |
| Identification of chemicals and drugs interact with genes involved in malignant transfromation |
| (DGIdb 4.0) |
| Entrez ID | Symbol | Category | Interaction Types | Drug Claim Name | Drug Name | PMIDs |
| Page: 1 |

Copyright 2023-Present -The University of Texas Health Science Center at Houston |