| Tissue | Expression Dynamics | Abbreviation |
| Colorectum (GSE201348) |  | FAP: Familial adenomatous polyposis |
| CRC: Colorectal cancer |
| Colorectum (HTA11) |  | AD: Adenomas |
| SER: Sessile serrated lesions |
| MSI-H: Microsatellite-high colorectal cancer |
| MSS: Microsatellite stable colorectal cancer |
| Esophagus | 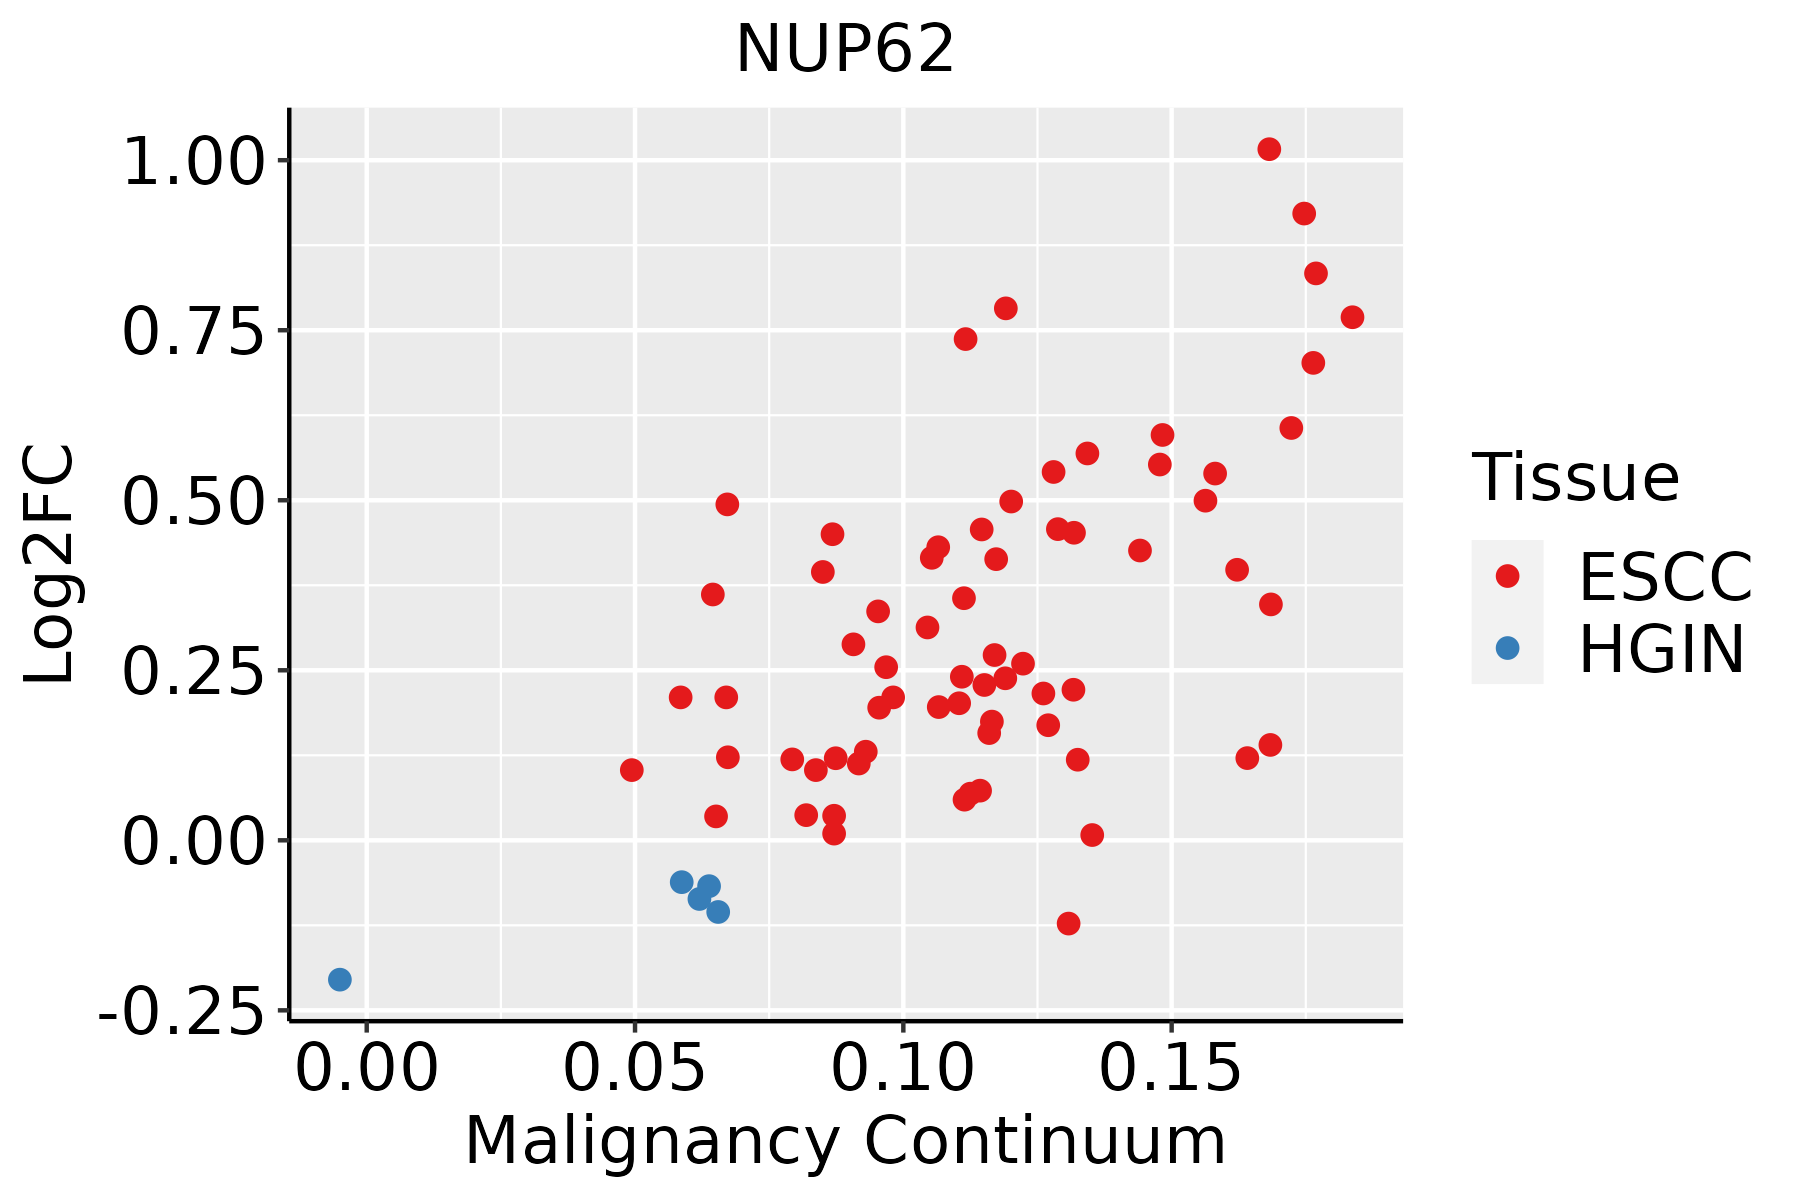 | ESCC: Esophageal squamous cell carcinoma |
| HGIN: High-grade intraepithelial neoplasias |
| LGIN: Low-grade intraepithelial neoplasias |
| Liver |  | HCC: Hepatocellular carcinoma |
| NAFLD: Non-alcoholic fatty liver disease |
| Oral Cavity | 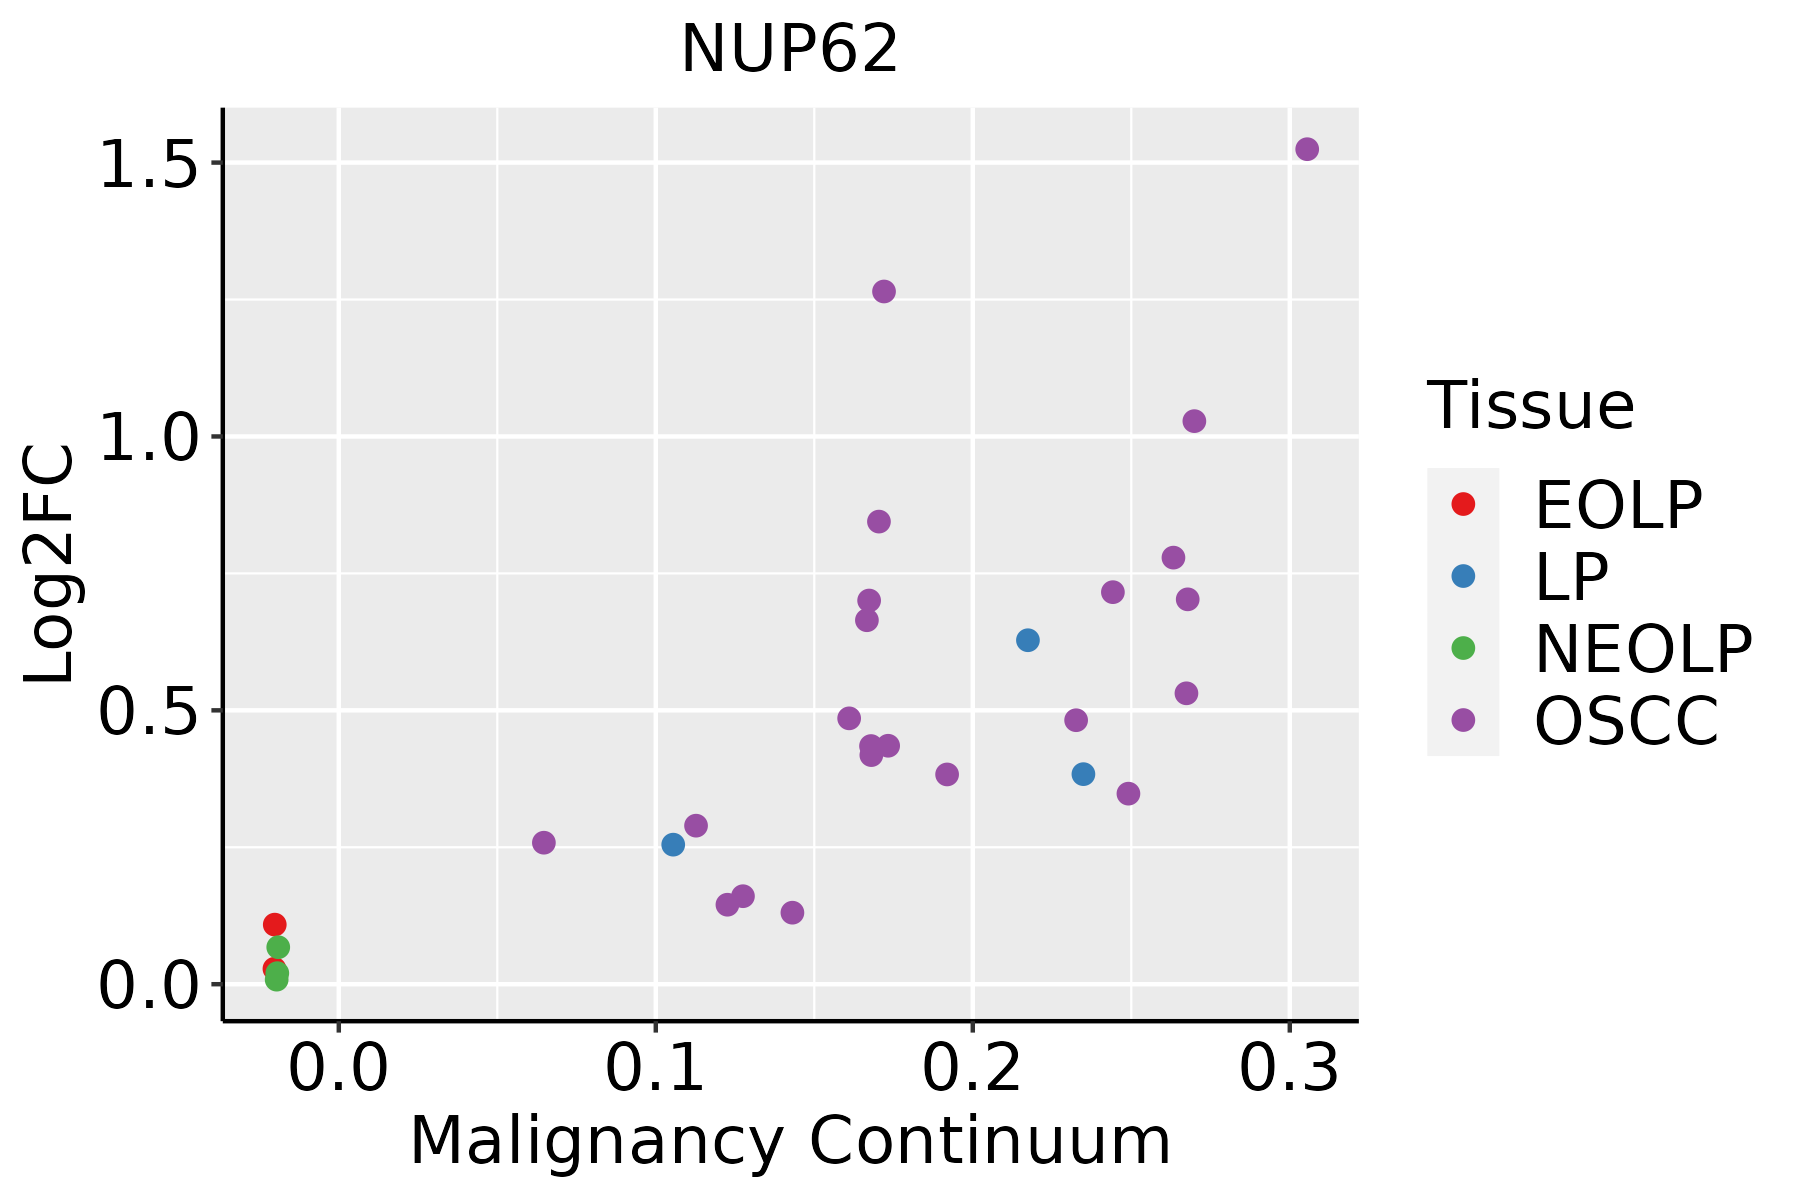 | EOLP: Erosive Oral lichen planus |
| LP: leukoplakia |
| NEOLP: Non-erosive oral lichen planus |
| OSCC: Oral squamous cell carcinoma |
| Skin | 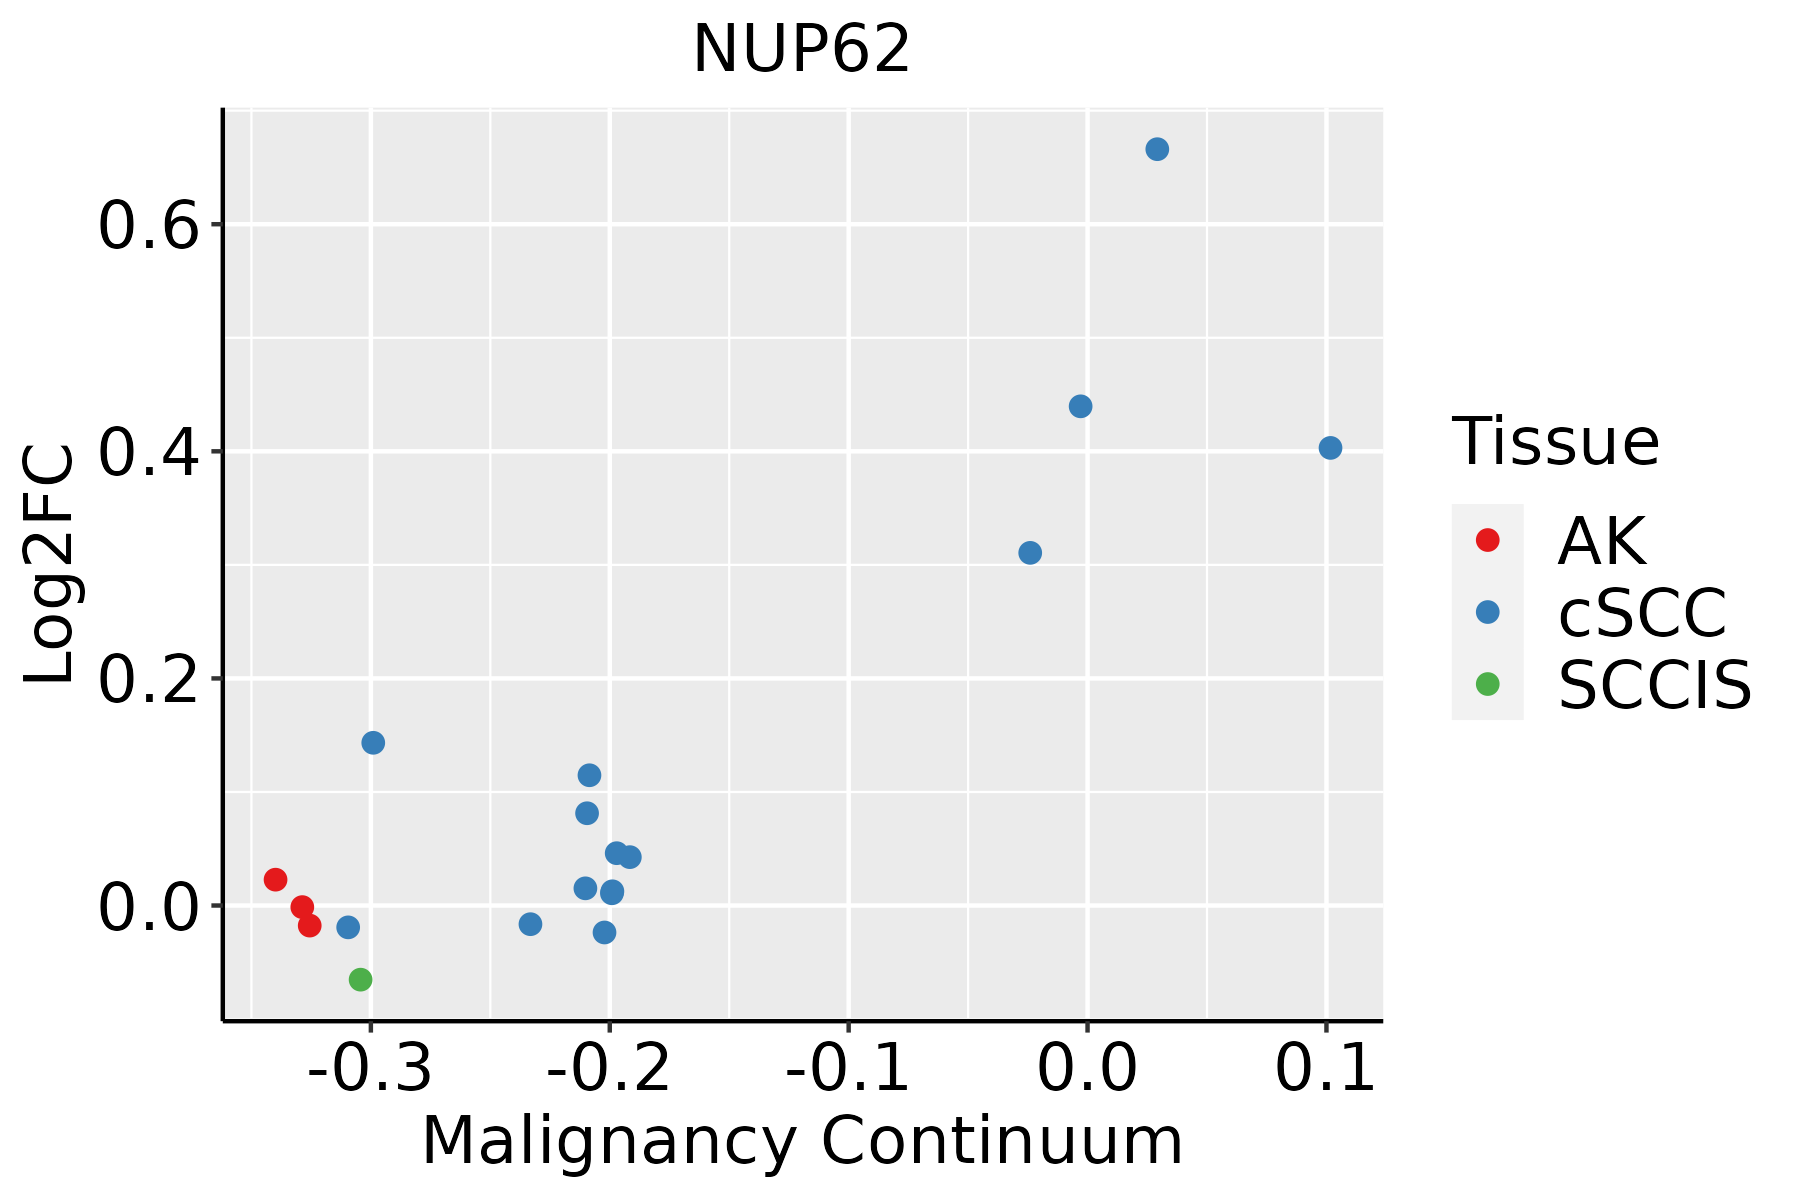 | AK: Actinic keratosis |
| cSCC: Cutaneous squamous cell carcinoma |
| SCCIS:squamous cell carcinoma in situ |
| Thyroid |  | ATC: Anaplastic thyroid cancer |
| HT: Hashimoto's thyroiditis |
| PTC: Papillary thyroid cancer |
| GO ID | Tissue | Disease Stage | Description | Gene Ratio | Bg Ratio | pvalue | p.adjust | Count |
| GO:190241013 | Oral cavity | LP | mitotic cytokinetic process | 15/4623 | 23/18723 | 4.61e-05 | 6.51e-04 | 15 |
| GO:000646919 | Oral cavity | LP | negative regulation of protein kinase activity | 78/4623 | 212/18723 | 5.45e-05 | 7.55e-04 | 78 |
| GO:004230613 | Oral cavity | LP | regulation of protein import into nucleus | 29/4623 | 60/18723 | 6.10e-05 | 8.28e-04 | 29 |
| GO:005149519 | Oral cavity | LP | positive regulation of cytoskeleton organization | 82/4623 | 226/18723 | 6.26e-05 | 8.46e-04 | 82 |
| GO:00070591 | Oral cavity | LP | chromosome segregation | 117/4623 | 346/18723 | 7.61e-05 | 9.91e-04 | 117 |
| GO:009022412 | Oral cavity | LP | regulation of spindle organization | 21/4623 | 39/18723 | 8.80e-05 | 1.11e-03 | 21 |
| GO:004340918 | Oral cavity | LP | negative regulation of MAPK cascade | 67/4623 | 180/18723 | 1.18e-04 | 1.40e-03 | 67 |
| GO:007190015 | Oral cavity | LP | regulation of protein serine/threonine kinase activity | 119/4623 | 359/18723 | 1.70e-04 | 1.90e-03 | 119 |
| GO:00434071 | Oral cavity | LP | negative regulation of MAP kinase activity | 27/4623 | 59/18723 | 3.38e-04 | 3.37e-03 | 27 |
| GO:000726515 | Oral cavity | LP | Ras protein signal transduction | 109/4623 | 337/18723 | 8.44e-04 | 7.36e-03 | 109 |
| GO:000028114 | Oral cavity | LP | mitotic cytokinesis | 30/4623 | 71/18723 | 8.59e-04 | 7.47e-03 | 30 |
| GO:000081911 | Oral cavity | LP | sister chromatid segregation | 70/4623 | 202/18723 | 9.20e-04 | 7.82e-03 | 70 |
| GO:004340512 | Oral cavity | LP | regulation of MAP kinase activity | 62/4623 | 177/18723 | 1.29e-03 | 1.04e-02 | 62 |
| GO:007050715 | Oral cavity | LP | regulation of microtubule cytoskeleton organization | 53/4623 | 148/18723 | 1.60e-03 | 1.23e-02 | 53 |
| GO:004205914 | Oral cavity | LP | negative regulation of epidermal growth factor receptor signaling pathway | 14/4623 | 28/18723 | 3.32e-03 | 2.23e-02 | 14 |
| GO:006164014 | Oral cavity | LP | cytoskeleton-dependent cytokinesis | 37/4623 | 100/18723 | 4.08e-03 | 2.63e-02 | 37 |
| GO:190118513 | Oral cavity | LP | negative regulation of ERBB signaling pathway | 15/4623 | 32/18723 | 5.23e-03 | 3.19e-02 | 15 |
| GO:000756914 | Oral cavity | LP | cell aging | 46/4623 | 132/18723 | 5.64e-03 | 3.40e-02 | 46 |
| GO:190118412 | Oral cavity | LP | regulation of ERBB signaling pathway | 30/4623 | 79/18723 | 5.97e-03 | 3.54e-02 | 30 |
| GO:004828511 | Oral cavity | LP | organelle fission | 145/4623 | 488/18723 | 6.02e-03 | 3.57e-02 | 145 |
| Pathway ID | Tissue | Disease Stage | Description | Gene Ratio | Bg Ratio | pvalue | p.adjust | qvalue | Count |
| hsa05014 | Colorectum | AD | Amyotrophic lateral sclerosis | 164/2092 | 364/8465 | 4.28e-18 | 1.27e-16 | 8.09e-17 | 164 |
| hsa050141 | Colorectum | AD | Amyotrophic lateral sclerosis | 164/2092 | 364/8465 | 4.28e-18 | 1.27e-16 | 8.09e-17 | 164 |
| hsa050142 | Colorectum | SER | Amyotrophic lateral sclerosis | 138/1580 | 364/8465 | 9.89e-19 | 2.99e-17 | 2.17e-17 | 138 |
| hsa050143 | Colorectum | SER | Amyotrophic lateral sclerosis | 138/1580 | 364/8465 | 9.89e-19 | 2.99e-17 | 2.17e-17 | 138 |
| hsa050144 | Colorectum | MSS | Amyotrophic lateral sclerosis | 156/1875 | 364/8465 | 1.43e-19 | 4.62e-18 | 2.83e-18 | 156 |
| hsa050145 | Colorectum | MSS | Amyotrophic lateral sclerosis | 156/1875 | 364/8465 | 1.43e-19 | 4.62e-18 | 2.83e-18 | 156 |
| hsa050146 | Colorectum | MSI-H | Amyotrophic lateral sclerosis | 95/797 | 364/8465 | 2.31e-21 | 1.50e-19 | 1.26e-19 | 95 |
| hsa050147 | Colorectum | MSI-H | Amyotrophic lateral sclerosis | 95/797 | 364/8465 | 2.31e-21 | 1.50e-19 | 1.26e-19 | 95 |
| hsa05014210 | Esophagus | ESCC | Amyotrophic lateral sclerosis | 266/4205 | 364/8465 | 1.31e-20 | 2.20e-18 | 1.13e-18 | 266 |
| hsa0301321 | Esophagus | ESCC | Nucleocytoplasmic transport | 89/4205 | 108/8465 | 1.20e-12 | 2.37e-11 | 1.21e-11 | 89 |
| hsa0501438 | Esophagus | ESCC | Amyotrophic lateral sclerosis | 266/4205 | 364/8465 | 1.31e-20 | 2.20e-18 | 1.13e-18 | 266 |
| hsa0301331 | Esophagus | ESCC | Nucleocytoplasmic transport | 89/4205 | 108/8465 | 1.20e-12 | 2.37e-11 | 1.21e-11 | 89 |
| hsa0501422 | Liver | HCC | Amyotrophic lateral sclerosis | 252/4020 | 364/8465 | 8.85e-18 | 7.41e-16 | 4.12e-16 | 252 |
| hsa03013 | Liver | HCC | Nucleocytoplasmic transport | 81/4020 | 108/8465 | 4.28e-09 | 6.83e-08 | 3.80e-08 | 81 |
| hsa0501432 | Liver | HCC | Amyotrophic lateral sclerosis | 252/4020 | 364/8465 | 8.85e-18 | 7.41e-16 | 4.12e-16 | 252 |
| hsa030131 | Liver | HCC | Nucleocytoplasmic transport | 81/4020 | 108/8465 | 4.28e-09 | 6.83e-08 | 3.80e-08 | 81 |
| hsa0501428 | Oral cavity | OSCC | Amyotrophic lateral sclerosis | 246/3704 | 364/8465 | 6.65e-21 | 1.11e-18 | 5.67e-19 | 246 |
| hsa030136 | Oral cavity | OSCC | Nucleocytoplasmic transport | 82/3704 | 108/8465 | 7.93e-12 | 1.33e-10 | 6.77e-11 | 82 |
| hsa05014112 | Oral cavity | OSCC | Amyotrophic lateral sclerosis | 246/3704 | 364/8465 | 6.65e-21 | 1.11e-18 | 5.67e-19 | 246 |
| hsa0301311 | Oral cavity | OSCC | Nucleocytoplasmic transport | 82/3704 | 108/8465 | 7.93e-12 | 1.33e-10 | 6.77e-11 | 82 |
| Hugo Symbol | Variant Class | Variant Classification | dbSNP RS | HGVSc | HGVSp | HGVSp Short | SWISSPROT | BIOTYPE | SIFT | PolyPhen | Tumor Sample Barcode | Tissue | Histology | Sex | Age | Stage | Therapy Types | Drugs | Outcome |
| NUP62 | SNV | Missense_Mutation | | c.280N>T | p.Ala94Ser | p.A94S | P37198 | protein_coding | tolerated(0.12) | benign(0.001) | TCGA-A1-A0SJ-01 | Breast | breast invasive carcinoma | Female | <65 | III/IV | Unknown | Unknown | SD |
| NUP62 | SNV | Missense_Mutation | | c.1564G>C | p.Asp522His | p.D522H | P37198 | protein_coding | deleterious(0) | possibly_damaging(0.824) | TCGA-A2-A0YM-01 | Breast | breast invasive carcinoma | Female | >=65 | I/II | Unknown | Unknown | SD |
| NUP62 | SNV | Missense_Mutation | novel | c.731N>T | p.Thr244Ile | p.T244I | P37198 | protein_coding | deleterious(0) | possibly_damaging(0.708) | TCGA-AC-A3W5-01 | Breast | breast invasive carcinoma | Female | >=65 | I/II | Chemotherapy | docetaxel | CR |
| NUP62 | insertion | Frame_Shift_Ins | novel | c.254_255insG | p.Thr86AsnfsTer38 | p.T86Nfs*38 | P37198 | protein_coding | | | TCGA-BH-A18G-01 | Breast | breast invasive carcinoma | Female | >=65 | I/II | Unknown | Unknown | SD |
| NUP62 | SNV | Missense_Mutation | novel | c.137N>A | p.Ala46Asp | p.A46D | P37198 | protein_coding | deleterious(0) | benign(0.027) | TCGA-2W-A8YY-01 | Cervix | cervical & endocervical cancer | Female | <65 | I/II | Chemotherapy | cisplatin | CR |
| NUP62 | SNV | Missense_Mutation | | c.1312N>A | p.Glu438Lys | p.E438K | P37198 | protein_coding | deleterious(0) | benign(0.168) | TCGA-C5-A1MK-01 | Cervix | cervical & endocervical cancer | Female | >=65 | III/IV | Chemotherapy | carboplatin | PD |
| NUP62 | SNV | Missense_Mutation | novel | c.1543C>T | p.Arg515Cys | p.R515C | P37198 | protein_coding | tolerated(0.05) | probably_damaging(0.948) | TCGA-EA-A3HS-01 | Cervix | cervical & endocervical cancer | Female | <65 | I/II | Unknown | Unknown | SD |
| NUP62 | SNV | Missense_Mutation | | c.98N>A | p.Ser33Tyr | p.S33Y | P37198 | protein_coding | deleterious(0) | probably_damaging(0.99) | TCGA-FU-A3HZ-01 | Cervix | cervical & endocervical cancer | Female | <65 | I/II | Chemotherapy | cisplatin | CR |
| NUP62 | SNV | Missense_Mutation | | c.1042G>A | p.Glu348Lys | p.E348K | P37198 | protein_coding | deleterious(0) | possibly_damaging(0.85) | TCGA-Q1-A73O-01 | Cervix | cervical & endocervical cancer | Female | <65 | I/II | Chemotherapy | cisplatin | CR |
| NUP62 | SNV | Missense_Mutation | rs769926725 | c.104N>T | p.Ser35Phe | p.S35F | P37198 | protein_coding | deleterious(0.01) | probably_damaging(0.99) | TCGA-A6-6653-01 | Colorectum | colon adenocarcinoma | Male | >=65 | I/II | Unknown | Unknown | SD |


