| Tissue | Expression Dynamics | Abbreviation |
| Esophagus | 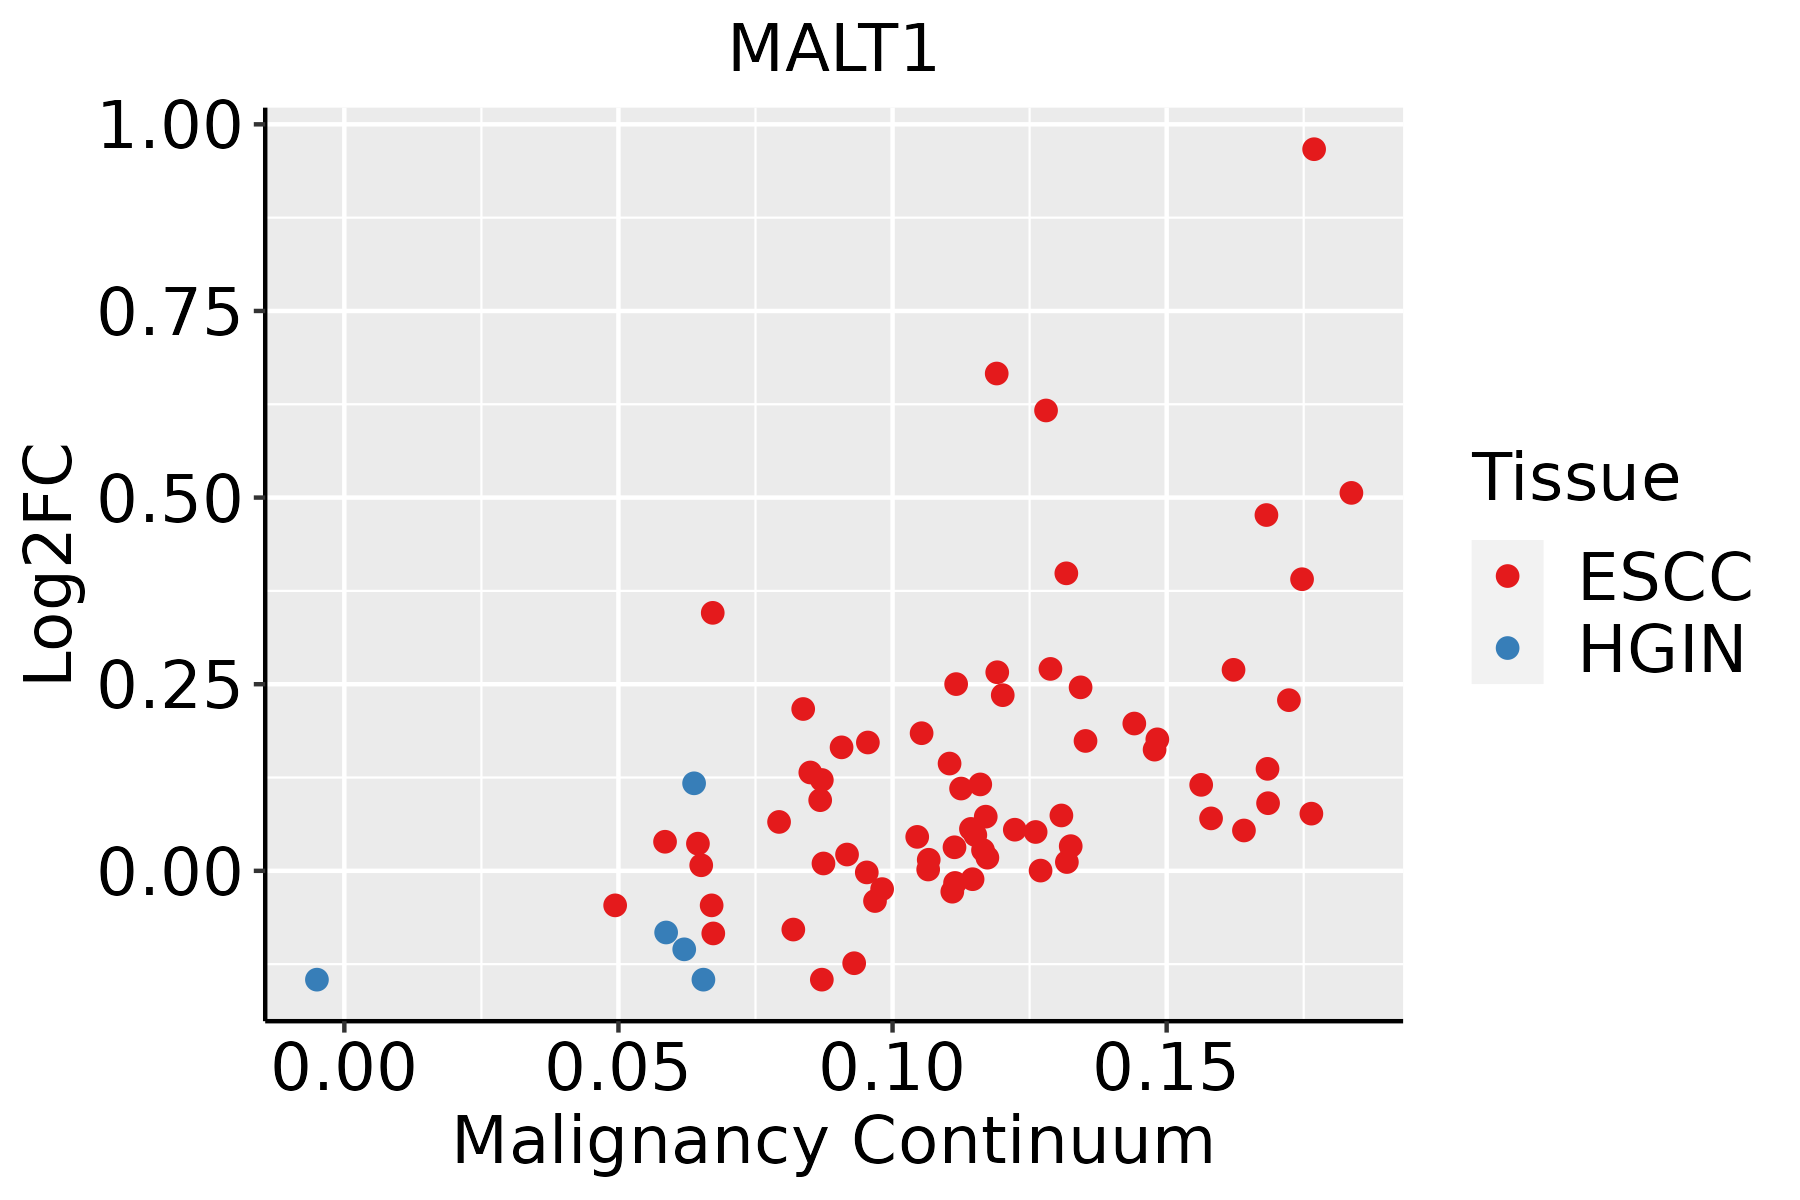 | ESCC: Esophageal squamous cell carcinoma |
| HGIN: High-grade intraepithelial neoplasias |
| LGIN: Low-grade intraepithelial neoplasias |
| Liver | 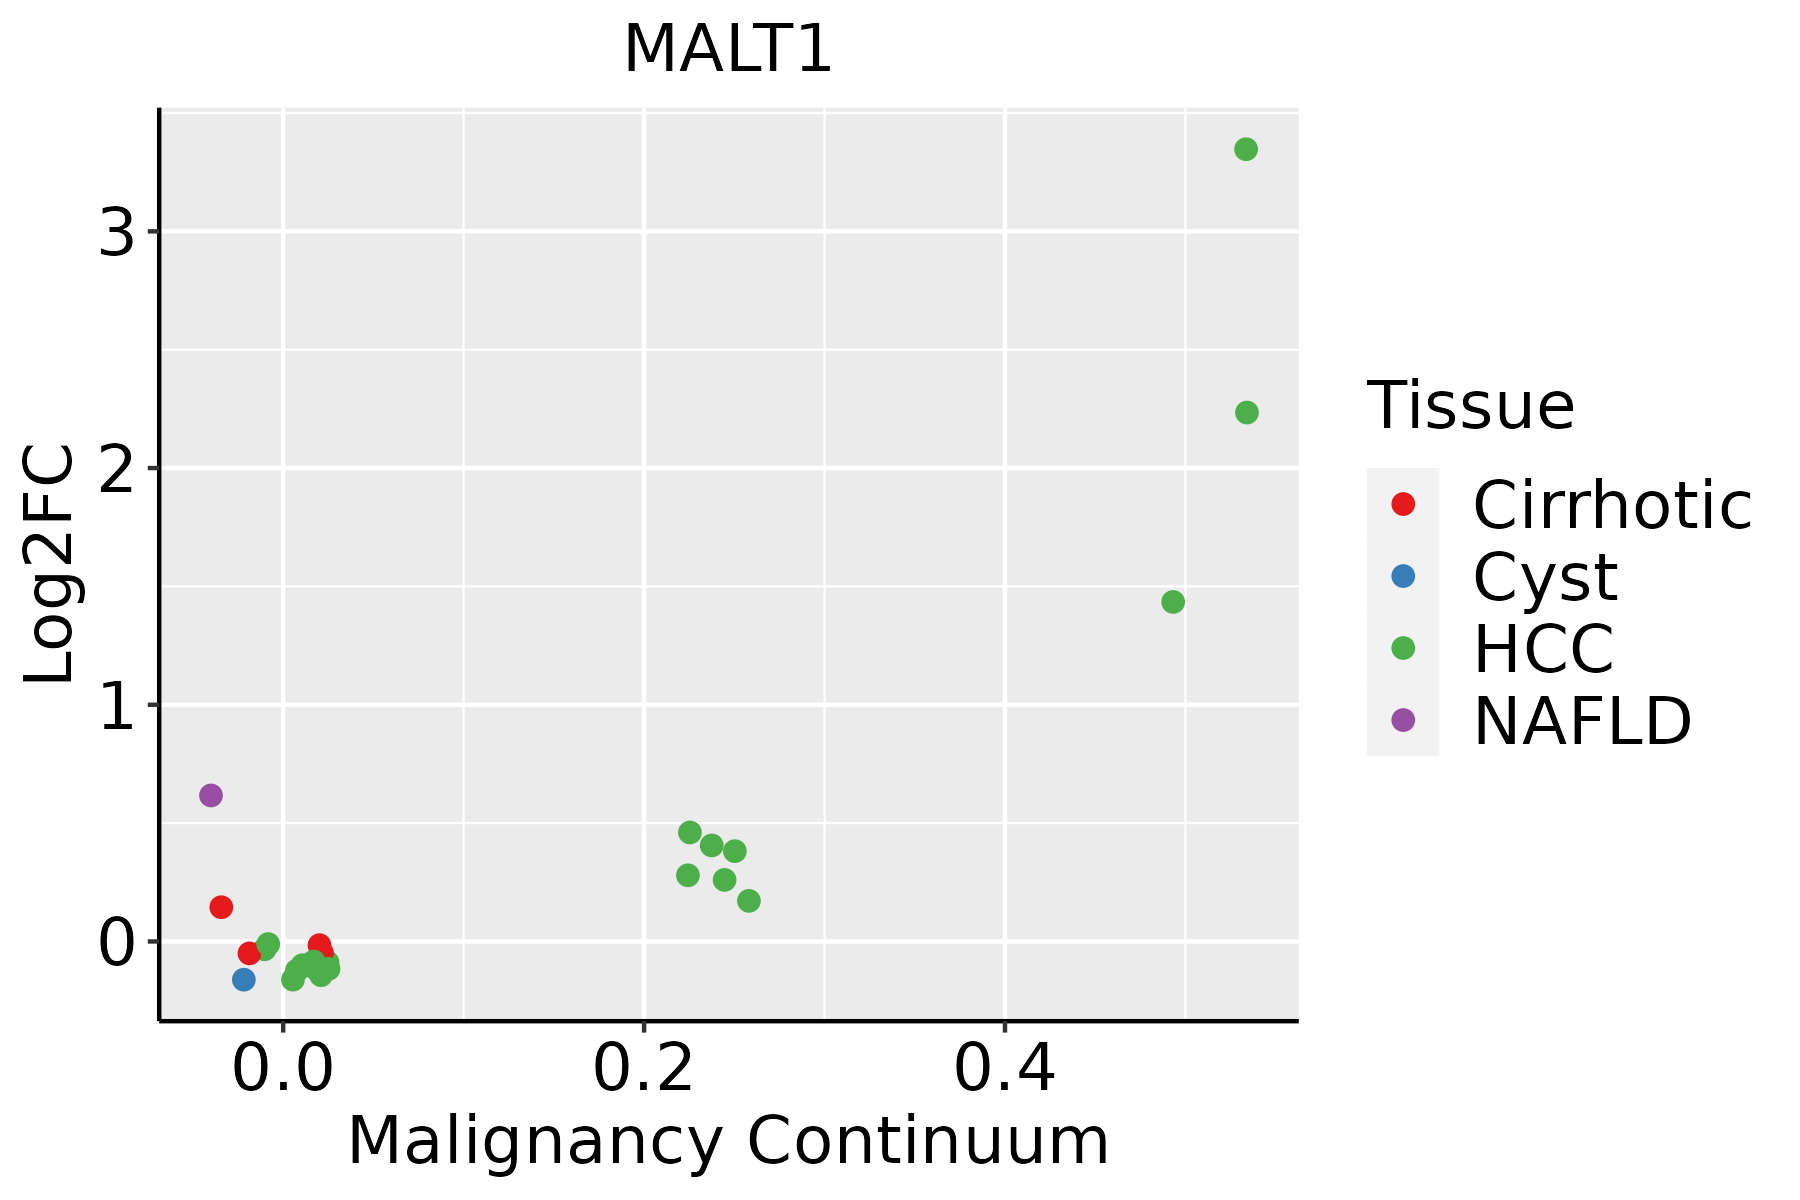 | HCC: Hepatocellular carcinoma |
| NAFLD: Non-alcoholic fatty liver disease |
| Lung | 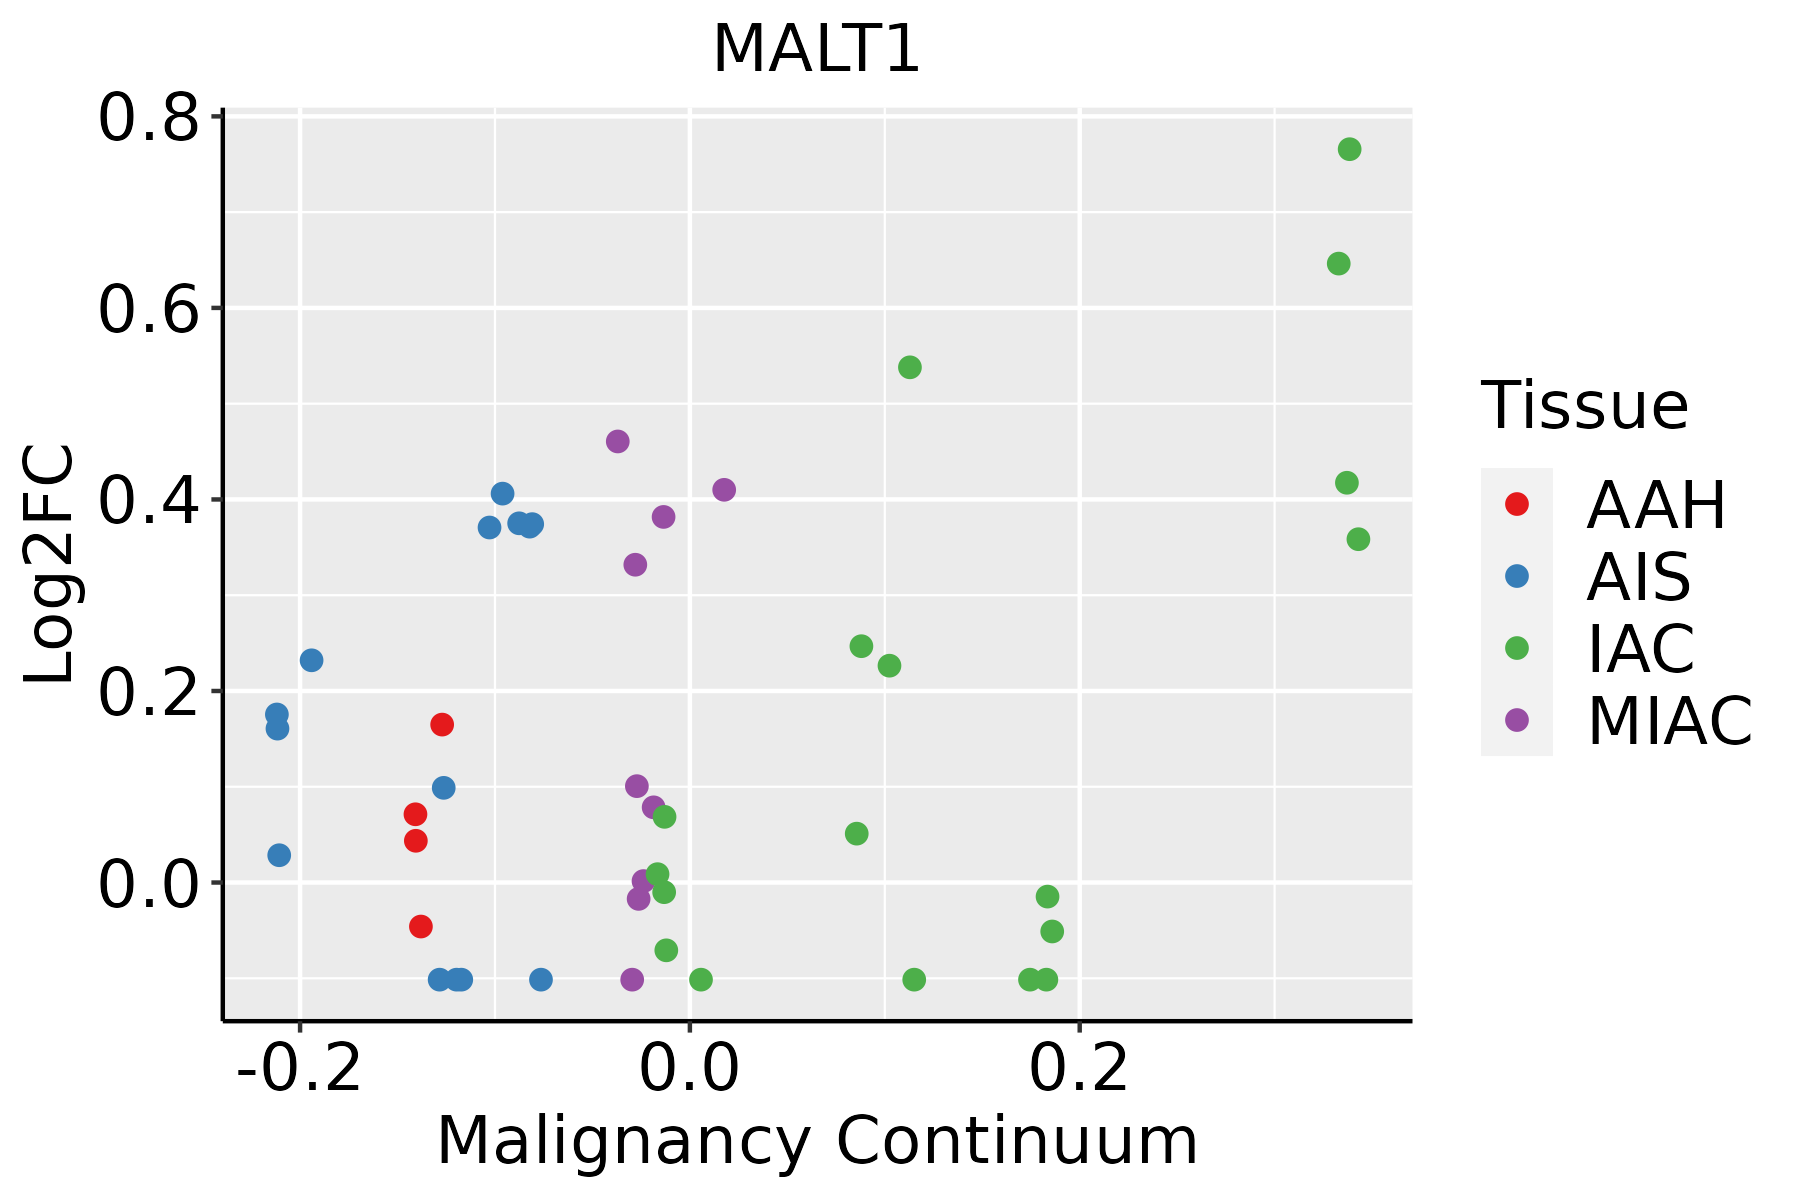 | AAH: Atypical adenomatous hyperplasia |
| AIS: Adenocarcinoma in situ |
| IAC: Invasive lung adenocarcinoma |
| MIA: Minimally invasive adenocarcinoma |
| Oral Cavity | 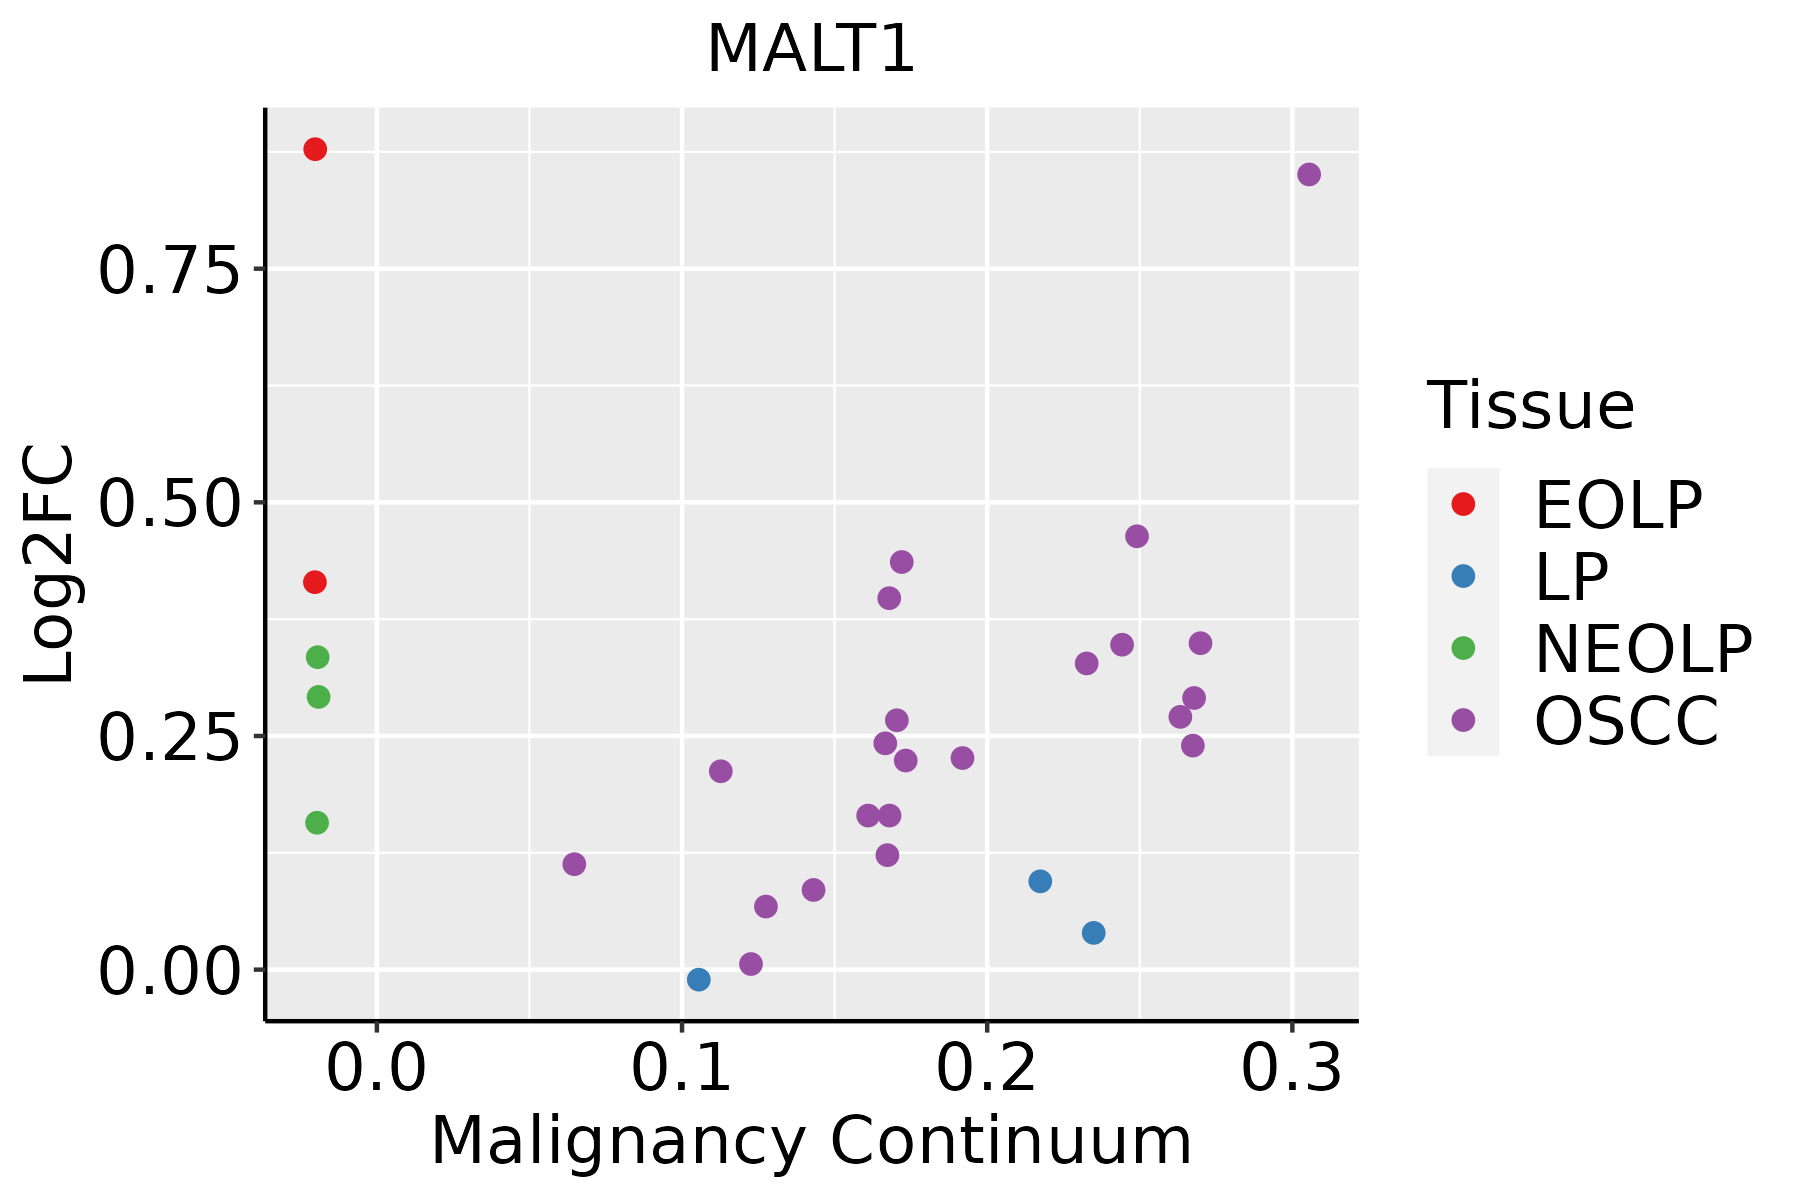 | EOLP: Erosive Oral lichen planus |
| LP: leukoplakia |
| NEOLP: Non-erosive oral lichen planus |
| OSCC: Oral squamous cell carcinoma |
| Prostate |  | BPH: Benign Prostatic Hyperplasia |
| Skin | 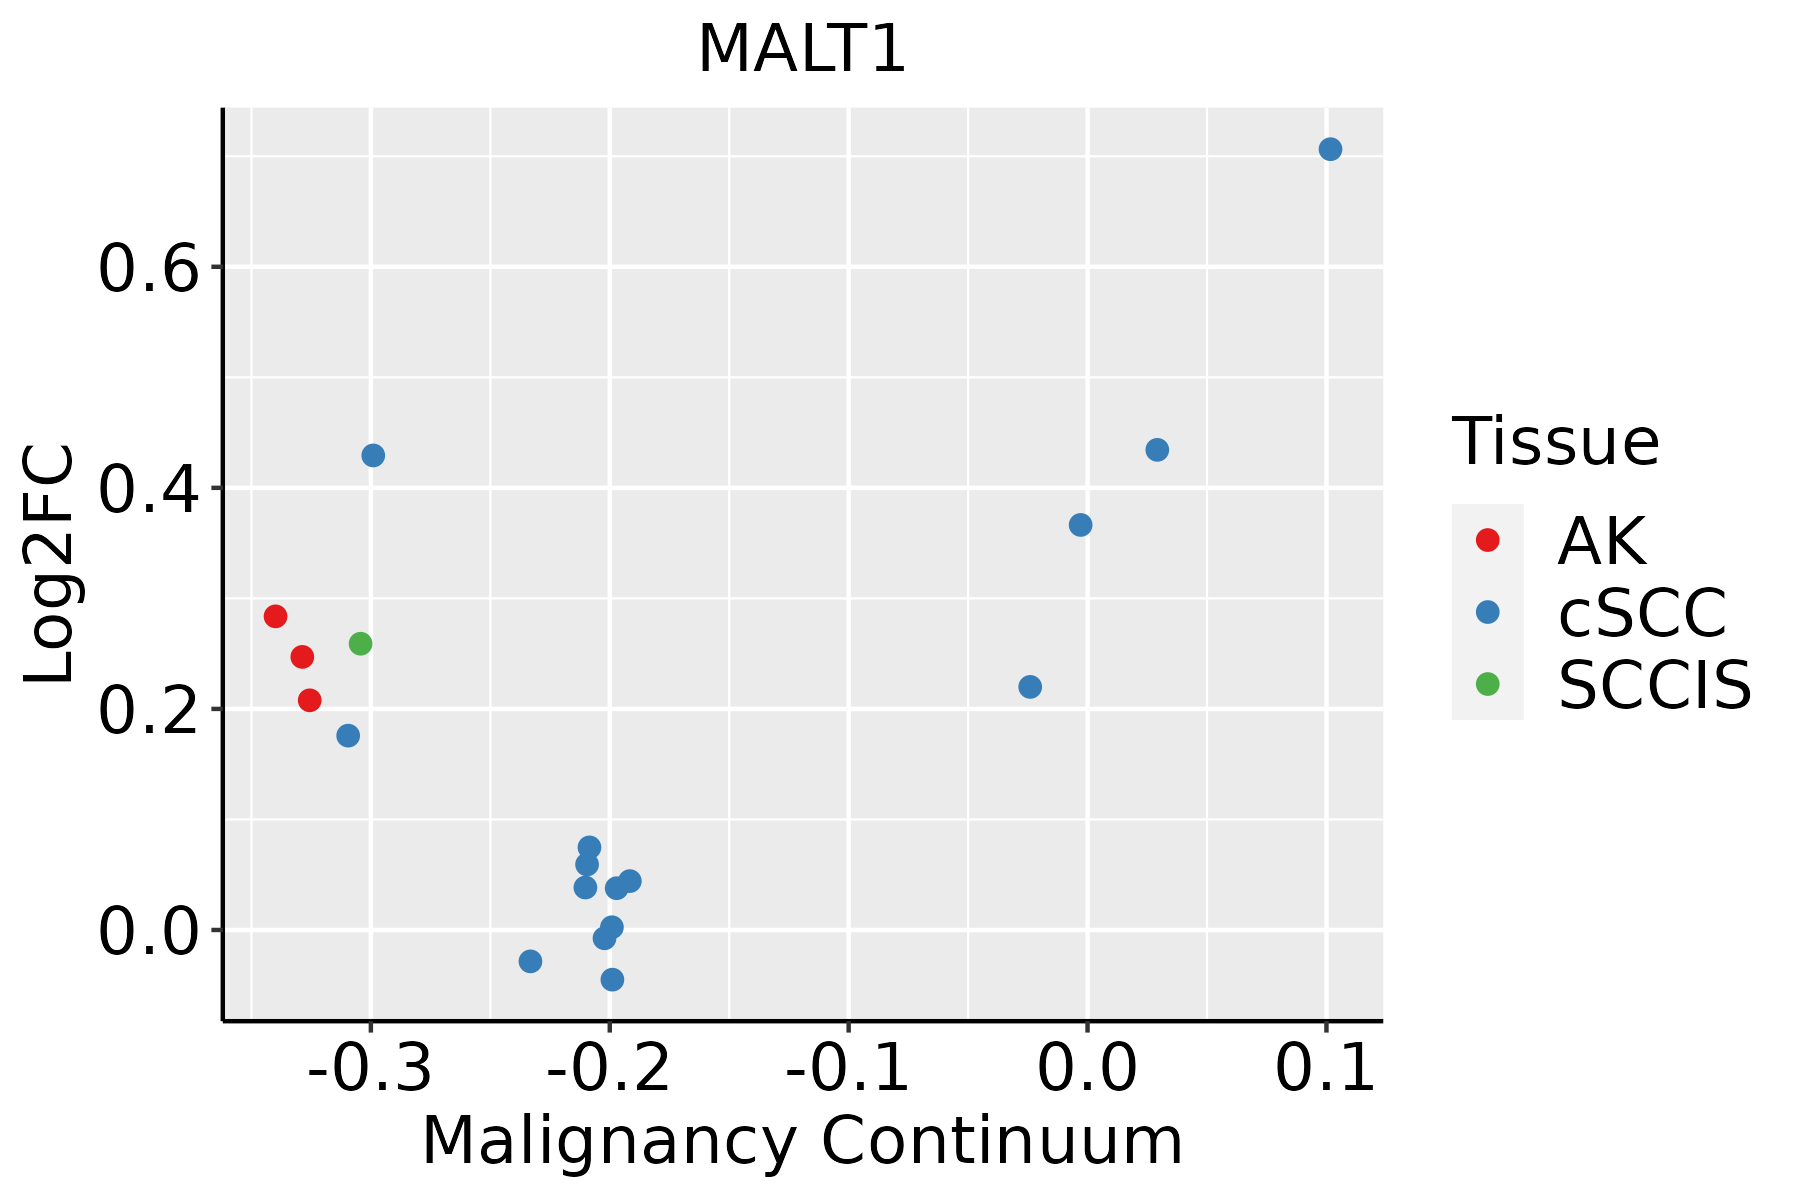 | AK: Actinic keratosis |
| cSCC: Cutaneous squamous cell carcinoma |
| SCCIS:squamous cell carcinoma in situ |
| GO ID | Tissue | Disease Stage | Description | Gene Ratio | Bg Ratio | pvalue | p.adjust | Count |
| GO:19033229 | Skin | AK | positive regulation of protein modification by small protein conjugation or removal | 25/1910 | 138/18723 | 3.18e-03 | 1.95e-02 | 25 |
| GO:00027647 | Skin | AK | immune response-regulating signaling pathway | 66/1910 | 468/18723 | 4.18e-03 | 2.45e-02 | 66 |
| GO:004312319 | Skin | AK | positive regulation of I-kappaB kinase/NF-kappaB signaling | 31/1910 | 186/18723 | 4.21e-03 | 2.46e-02 | 31 |
| GO:00510919 | Skin | AK | positive regulation of DNA-binding transcription factor activity | 40/1910 | 260/18723 | 5.49e-03 | 3.03e-02 | 40 |
| GO:004328024 | Skin | AK | positive regulation of cysteine-type endopeptidase activity involved in apoptotic process | 23/1910 | 129/18723 | 5.54e-03 | 3.05e-02 | 23 |
| GO:00022535 | Skin | AK | activation of immune response | 54/1910 | 375/18723 | 5.90e-03 | 3.20e-02 | 54 |
| GO:00508566 | Skin | AK | regulation of T cell receptor signaling pathway | 10/1910 | 41/18723 | 6.95e-03 | 3.63e-02 | 10 |
| GO:00313988 | Skin | AK | positive regulation of protein ubiquitination | 21/1910 | 119/18723 | 8.77e-03 | 4.32e-02 | 21 |
| GO:000691324 | Skin | cSCC | nucleocytoplasmic transport | 162/4864 | 301/18723 | 4.20e-25 | 1.10e-22 | 162 |
| GO:005116924 | Skin | cSCC | nuclear transport | 162/4864 | 301/18723 | 4.20e-25 | 1.10e-22 | 162 |
| GO:0051168111 | Skin | cSCC | nuclear export | 91/4864 | 154/18723 | 3.33e-18 | 4.18e-16 | 91 |
| GO:190332029 | Skin | cSCC | regulation of protein modification by small protein conjugation or removal | 125/4864 | 242/18723 | 9.50e-18 | 1.05e-15 | 125 |
| GO:004586229 | Skin | cSCC | positive regulation of proteolysis | 169/4864 | 372/18723 | 2.43e-16 | 2.21e-14 | 169 |
| GO:003139629 | Skin | cSCC | regulation of protein ubiquitination | 107/4864 | 210/18723 | 7.17e-15 | 5.35e-13 | 107 |
| GO:005254728 | Skin | cSCC | regulation of peptidase activity | 177/4864 | 461/18723 | 2.21e-09 | 8.02e-08 | 177 |
| GO:0043123110 | Skin | cSCC | positive regulation of I-kappaB kinase/NF-kappaB signaling | 84/4864 | 186/18723 | 1.09e-08 | 3.40e-07 | 84 |
| GO:005254828 | Skin | cSCC | regulation of endopeptidase activity | 165/4864 | 432/18723 | 1.18e-08 | 3.63e-07 | 165 |
| GO:000724925 | Skin | cSCC | I-kappaB kinase/NF-kappaB signaling | 116/4864 | 281/18723 | 1.33e-08 | 4.08e-07 | 116 |
| GO:004312225 | Skin | cSCC | regulation of I-kappaB kinase/NF-kappaB signaling | 105/4864 | 249/18723 | 1.70e-08 | 5.09e-07 | 105 |
| GO:001095227 | Skin | cSCC | positive regulation of peptidase activity | 85/4864 | 197/18723 | 1.14e-07 | 2.69e-06 | 85 |
| Pathway ID | Tissue | Disease Stage | Description | Gene Ratio | Bg Ratio | pvalue | p.adjust | qvalue | Count |
| hsa05131211 | Esophagus | ESCC | Shigellosis | 176/4205 | 247/8465 | 2.27e-12 | 4.01e-11 | 2.05e-11 | 176 |
| hsa046259 | Esophagus | ESCC | C-type lectin receptor signaling pathway | 73/4205 | 104/8465 | 1.57e-05 | 7.98e-05 | 4.09e-05 | 73 |
| hsa051527 | Esophagus | ESCC | Tuberculosis | 111/4205 | 180/8465 | 7.14e-04 | 2.32e-03 | 1.19e-03 | 111 |
| hsa040645 | Esophagus | ESCC | NF-kappa B signaling pathway | 67/4205 | 104/8465 | 1.62e-03 | 4.89e-03 | 2.50e-03 | 67 |
| hsa046607 | Esophagus | ESCC | T cell receptor signaling pathway | 63/4205 | 104/8465 | 1.60e-02 | 3.60e-02 | 1.84e-02 | 63 |
| hsa05131310 | Esophagus | ESCC | Shigellosis | 176/4205 | 247/8465 | 2.27e-12 | 4.01e-11 | 2.05e-11 | 176 |
| hsa0462513 | Esophagus | ESCC | C-type lectin receptor signaling pathway | 73/4205 | 104/8465 | 1.57e-05 | 7.98e-05 | 4.09e-05 | 73 |
| hsa0515212 | Esophagus | ESCC | Tuberculosis | 111/4205 | 180/8465 | 7.14e-04 | 2.32e-03 | 1.19e-03 | 111 |
| hsa0406412 | Esophagus | ESCC | NF-kappa B signaling pathway | 67/4205 | 104/8465 | 1.62e-03 | 4.89e-03 | 2.50e-03 | 67 |
| hsa0466013 | Esophagus | ESCC | T cell receptor signaling pathway | 63/4205 | 104/8465 | 1.60e-02 | 3.60e-02 | 1.84e-02 | 63 |
| hsa0513114 | Liver | NAFLD | Shigellosis | 48/1043 | 247/8465 | 7.82e-04 | 1.17e-02 | 9.39e-03 | 48 |
| hsa0513115 | Liver | NAFLD | Shigellosis | 48/1043 | 247/8465 | 7.82e-04 | 1.17e-02 | 9.39e-03 | 48 |
| hsa0513142 | Liver | HCC | Shigellosis | 150/4020 | 247/8465 | 1.53e-05 | 1.04e-04 | 5.81e-05 | 150 |
| hsa0513152 | Liver | HCC | Shigellosis | 150/4020 | 247/8465 | 1.53e-05 | 1.04e-04 | 5.81e-05 | 150 |
| hsa0513116 | Lung | IAC | Shigellosis | 58/1053 | 247/8465 | 8.21e-07 | 3.81e-05 | 2.53e-05 | 58 |
| hsa04625 | Lung | IAC | C-type lectin receptor signaling pathway | 26/1053 | 104/8465 | 3.15e-04 | 3.11e-03 | 2.06e-03 | 26 |
| hsa04660 | Lung | IAC | T cell receptor signaling pathway | 23/1053 | 104/8465 | 3.88e-03 | 1.88e-02 | 1.25e-02 | 23 |
| hsa0513117 | Lung | IAC | Shigellosis | 58/1053 | 247/8465 | 8.21e-07 | 3.81e-05 | 2.53e-05 | 58 |
| hsa046251 | Lung | IAC | C-type lectin receptor signaling pathway | 26/1053 | 104/8465 | 3.15e-04 | 3.11e-03 | 2.06e-03 | 26 |
| hsa046601 | Lung | IAC | T cell receptor signaling pathway | 23/1053 | 104/8465 | 3.88e-03 | 1.88e-02 | 1.25e-02 | 23 |
| Hugo Symbol | Variant Class | Variant Classification | dbSNP RS | HGVSc | HGVSp | HGVSp Short | SWISSPROT | BIOTYPE | SIFT | PolyPhen | Tumor Sample Barcode | Tissue | Histology | Sex | Age | Stage | Therapy Types | Drugs | Outcome |
| MALT1 | SNV | Missense_Mutation | novel | c.1924G>A | p.Asp642Asn | p.D642N | Q9UDY8 | protein_coding | deleterious(0.02) | probably_damaging(0.911) | TCGA-A2-A0EY-01 | Breast | breast invasive carcinoma | Female | <65 | I/II | Chemotherapy | adriamycin | SD |
| MALT1 | SNV | Missense_Mutation | novel | c.894N>A | p.Ser298Arg | p.S298R | Q9UDY8 | protein_coding | tolerated(0.54) | benign(0.015) | TCGA-A7-A3IZ-01 | Breast | breast invasive carcinoma | Female | <65 | I/II | Chemotherapy | cytoxan | SD |
| MALT1 | SNV | Missense_Mutation | | c.1364G>C | p.Gly455Ala | p.G455A | Q9UDY8 | protein_coding | tolerated(0.12) | probably_damaging(0.989) | TCGA-AC-A23H-01 | Breast | breast invasive carcinoma | Female | >=65 | I/II | Unknown | Unknown | PD |
| MALT1 | SNV | Missense_Mutation | novel | c.1913N>G | p.Asp638Gly | p.D638G | Q9UDY8 | protein_coding | tolerated(0.1) | benign(0.145) | TCGA-OL-A6VQ-01 | Breast | breast invasive carcinoma | Female | <65 | I/II | Unknown | Unknown | SD |
| MALT1 | insertion | Frame_Shift_Ins | novel | c.2285_2286insCAGAATTGAGAATTCCTATTATAACCATAGATTGTTGTTTTCATTG | p.Ser763ArgfsTer20 | p.S763Rfs*20 | Q9UDY8 | protein_coding | | | TCGA-AR-A0TY-01 | Breast | breast invasive carcinoma | Female | <65 | I/II | Unspecific | Paclitaxel | PD |
| MALT1 | insertion | In_Frame_Ins | novel | c.2471_2472insTACTTGGTATCAAAGGATCTTCCCAAGCATTGCCTCTAT | p.Lys824delinsAsnThrTrpTyrGlnArgIlePheProSerIleAlaSerIle | p.K824delinsNTWYQRIFPSIASI | Q9UDY8 | protein_coding | | | TCGA-B6-A0I6-01 | Breast | breast invasive carcinoma | Female | <65 | I/II | Unknown | Unknown | PD |
| MALT1 | insertion | Nonsense_Mutation | novel | c.1324_1325insGAAGTTCAGACTGA | p.Val442GlyfsTer5 | p.V442Gfs*5 | Q9UDY8 | protein_coding | | | TCGA-B6-A0RE-01 | Breast | breast invasive carcinoma | Female | <65 | I/II | Unknown | Unknown | SD |
| MALT1 | insertion | Frame_Shift_Ins | novel | c.1326_1327insTTTTTGTTGTTTTTTACAGC | p.Gln443PhefsTer11 | p.Q443Ffs*11 | Q9UDY8 | protein_coding | | | TCGA-B6-A0RE-01 | Breast | breast invasive carcinoma | Female | <65 | I/II | Unknown | Unknown | SD |
| MALT1 | SNV | Missense_Mutation | rs780898848 | c.1175N>A | p.Arg392His | p.R392H | Q9UDY8 | protein_coding | tolerated(0.17) | benign(0.031) | TCGA-2W-A8YY-01 | Cervix | cervical & endocervical cancer | Female | <65 | I/II | Chemotherapy | cisplatin | CR |
| MALT1 | SNV | Missense_Mutation | | c.1423C>G | p.Pro475Ala | p.P475A | Q9UDY8 | protein_coding | tolerated(0.23) | benign(0.217) | TCGA-LP-A4AV-01 | Cervix | cervical & endocervical cancer | Female | <65 | I/II | Unknown | Unknown | SD |


