
|
|||||
|
 | |
| |
| |
| |
| |
| |
|
Gene: CNOT2 |
Gene summary for CNOT2 |
| Gene information | Species | Human | Gene symbol | CNOT2 | Gene ID | 4848 |
| Gene name | CCR4-NOT transcription complex subunit 2 | |
| Gene Alias | CDC36 | |
| Cytomap | 12q15 | |
| Gene Type | protein-coding | GO ID | GO:0000122 | UniProtAcc | A0A024RBD8 |
Top |
Malignant transformation analysis |
| Identification of the aberrant gene expression in precancerous and cancerous lesions by comparing the gene expression of stem-like cells in diseased tissues with normal stem cells |
| Entrez ID | Symbol | Replicates | Species | Organ | Tissue | Adj P-value | Log2FC | Malignancy |
| 4848 | CNOT2 | CA_HPV_1 | Human | Cervix | CC | 1.60e-02 | -2.75e-02 | 0.0264 |
| 4848 | CNOT2 | CCI_1 | Human | Cervix | CC | 4.67e-06 | 9.34e-01 | 0.528 |
| 4848 | CNOT2 | CCI_2 | Human | Cervix | CC | 1.09e-07 | 7.06e-01 | 0.5249 |
| 4848 | CNOT2 | CCI_3 | Human | Cervix | CC | 4.86e-05 | 1.07e+00 | 0.516 |
| 4848 | CNOT2 | sample3 | Human | Cervix | CC | 1.10e-04 | 2.74e-01 | 0.1387 |
| 4848 | CNOT2 | T3 | Human | Cervix | CC | 2.68e-05 | 2.88e-01 | 0.1389 |
| 4848 | CNOT2 | HTA11_3410_2000001011 | Human | Colorectum | AD | 1.10e-15 | -5.74e-01 | 0.0155 |
| 4848 | CNOT2 | HTA11_3361_2000001011 | Human | Colorectum | AD | 5.03e-05 | -5.09e-01 | -0.1207 |
| 4848 | CNOT2 | HTA11_696_2000001011 | Human | Colorectum | AD | 9.06e-09 | -4.77e-01 | -0.1464 |
| 4848 | CNOT2 | HTA11_866_2000001011 | Human | Colorectum | AD | 4.88e-03 | -3.37e-01 | -0.1001 |
| 4848 | CNOT2 | HTA11_866_3004761011 | Human | Colorectum | AD | 2.38e-03 | -3.90e-01 | 0.096 |
| 4848 | CNOT2 | HTA11_10623_2000001011 | Human | Colorectum | AD | 9.84e-03 | -6.23e-01 | -0.0177 |
| 4848 | CNOT2 | HTA11_10711_2000001011 | Human | Colorectum | AD | 1.60e-06 | -4.61e-01 | 0.0338 |
| 4848 | CNOT2 | HTA11_7696_3000711011 | Human | Colorectum | AD | 9.29e-10 | -4.38e-01 | 0.0674 |
| 4848 | CNOT2 | HTA11_99999973899_84307 | Human | Colorectum | MSS | 2.55e-03 | -5.80e-01 | 0.2585 |
| 4848 | CNOT2 | HTA11_99999974143_84620 | Human | Colorectum | MSS | 3.98e-21 | -6.12e-01 | 0.3005 |
| 4848 | CNOT2 | A015-C-203 | Human | Colorectum | FAP | 1.74e-29 | -4.36e-01 | -0.1294 |
| 4848 | CNOT2 | A015-C-204 | Human | Colorectum | FAP | 1.31e-04 | -2.50e-01 | -0.0228 |
| 4848 | CNOT2 | A014-C-040 | Human | Colorectum | FAP | 5.42e-05 | -4.32e-01 | -0.1184 |
| 4848 | CNOT2 | A002-C-201 | Human | Colorectum | FAP | 5.39e-13 | -3.28e-01 | 0.0324 |
| Page: 1 2 3 4 5 6 7 8 9 10 |
| Tissue | Expression Dynamics | Abbreviation |
| Cervix | 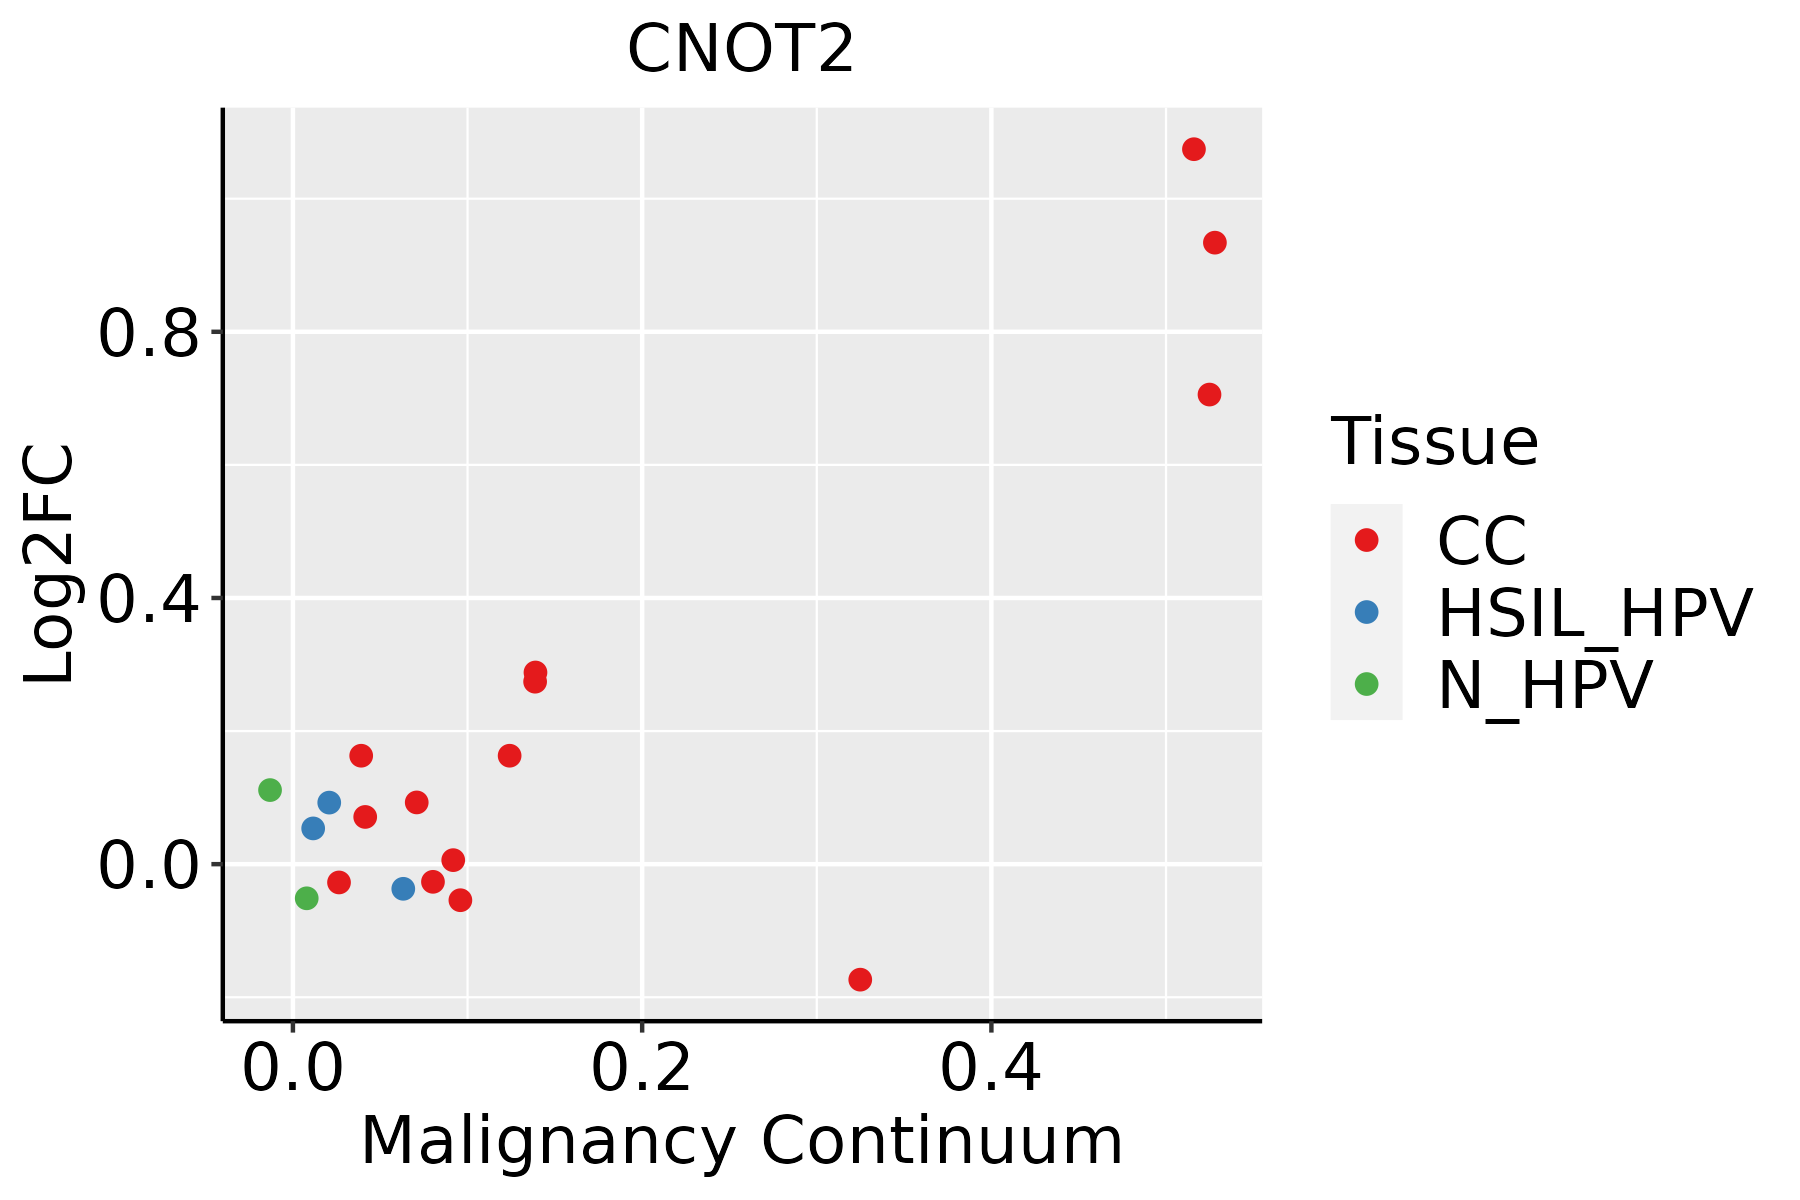 | CC: Cervix cancer |
| HSIL_HPV: HPV-infected high-grade squamous intraepithelial lesions | ||
| N_HPV: HPV-infected normal cervix | ||
| Colorectum (GSE201348) |  | FAP: Familial adenomatous polyposis |
| CRC: Colorectal cancer | ||
| Colorectum (HTA11) |  | AD: Adenomas |
| SER: Sessile serrated lesions | ||
| MSI-H: Microsatellite-high colorectal cancer | ||
| MSS: Microsatellite stable colorectal cancer | ||
| Esophagus | 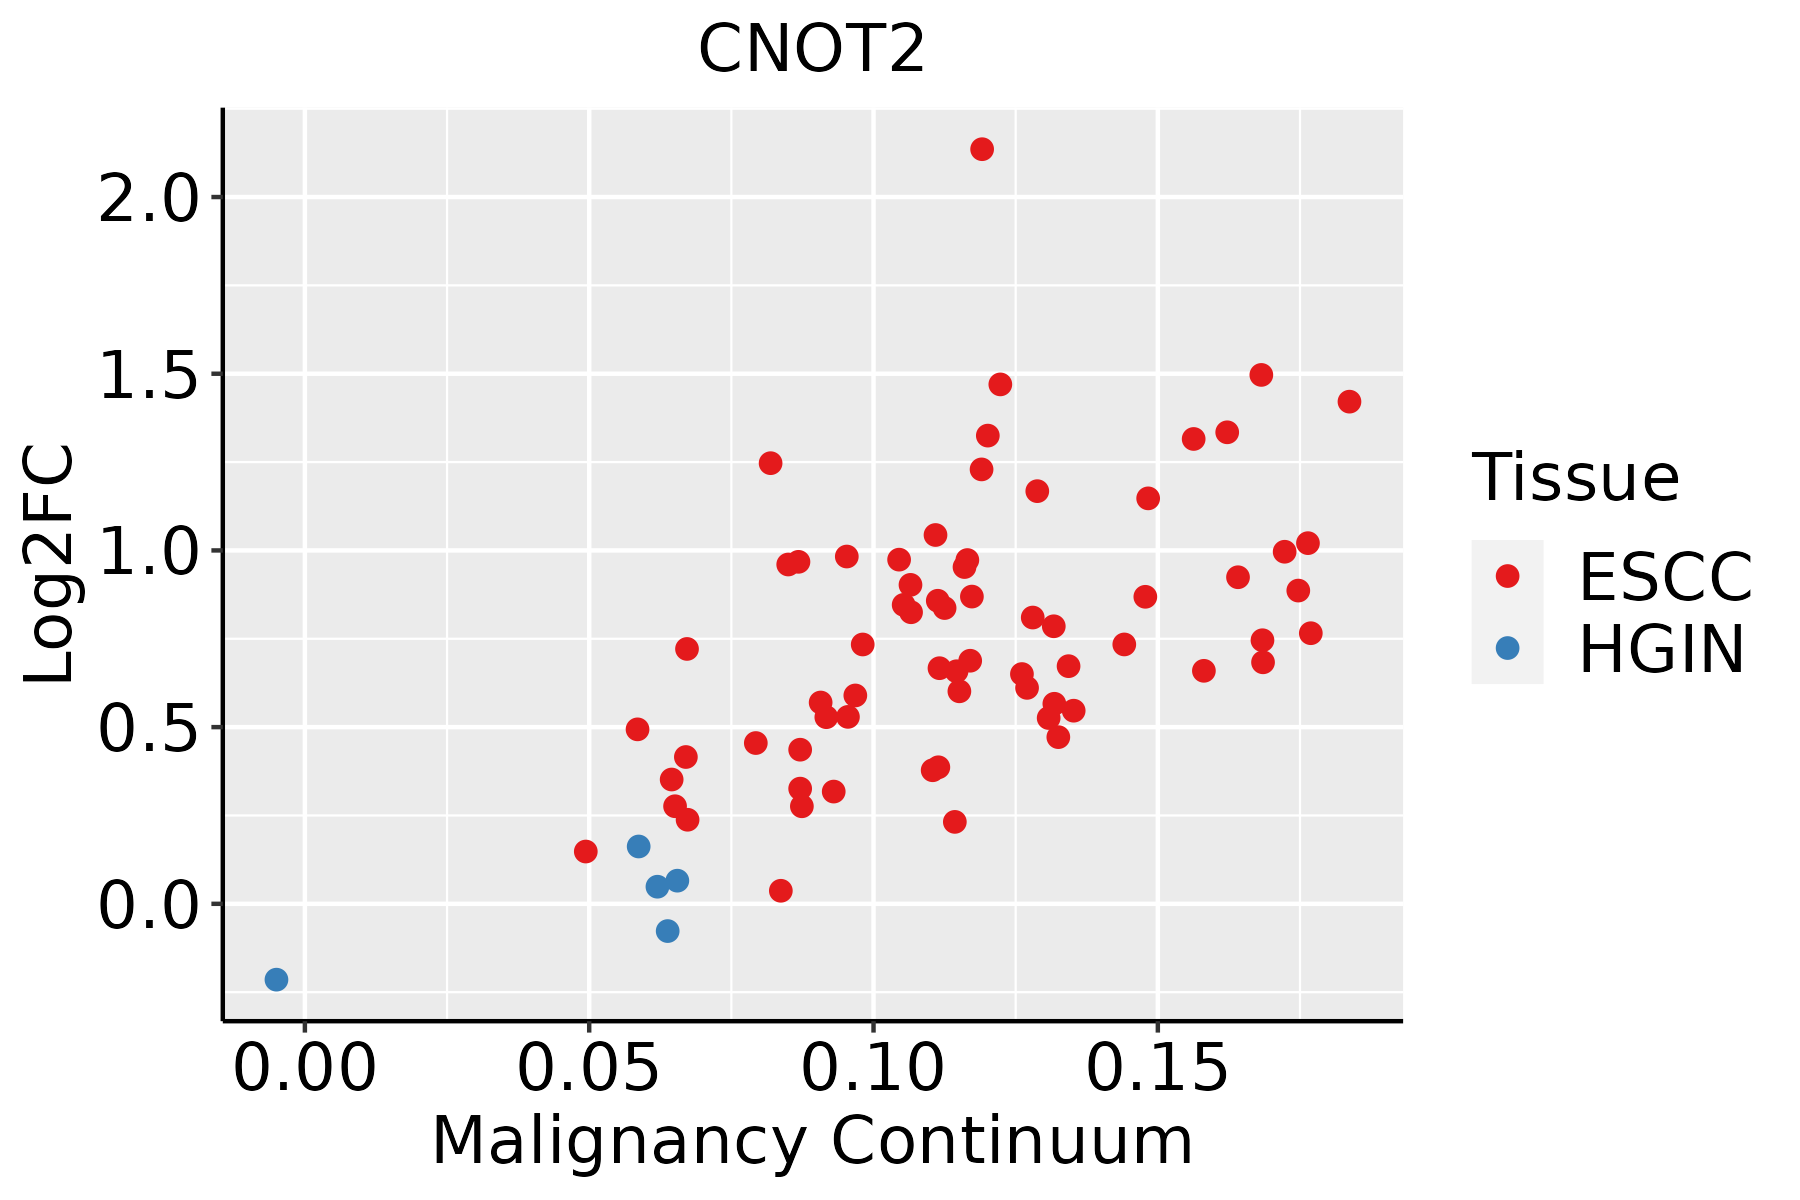 | ESCC: Esophageal squamous cell carcinoma |
| HGIN: High-grade intraepithelial neoplasias | ||
| LGIN: Low-grade intraepithelial neoplasias | ||
| Liver | 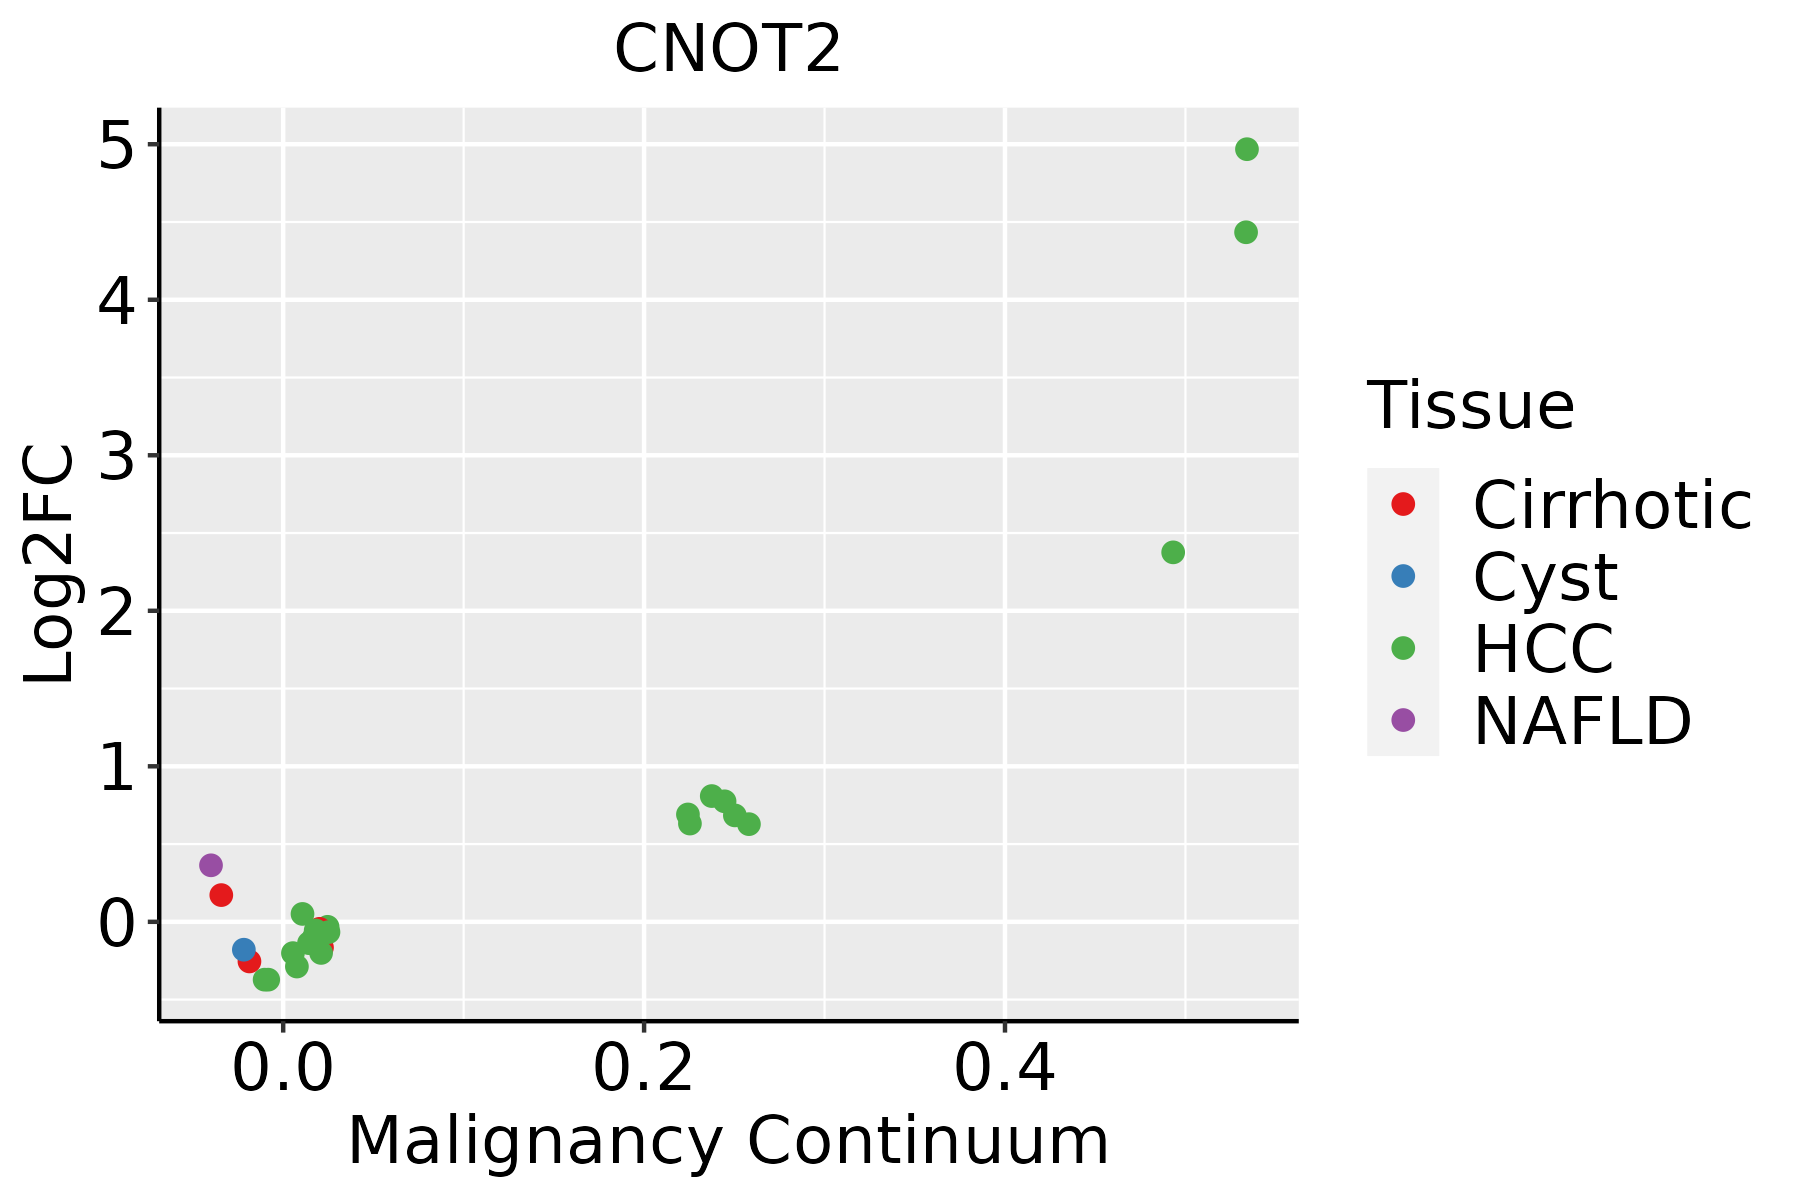 | HCC: Hepatocellular carcinoma |
| NAFLD: Non-alcoholic fatty liver disease | ||
| Lung | 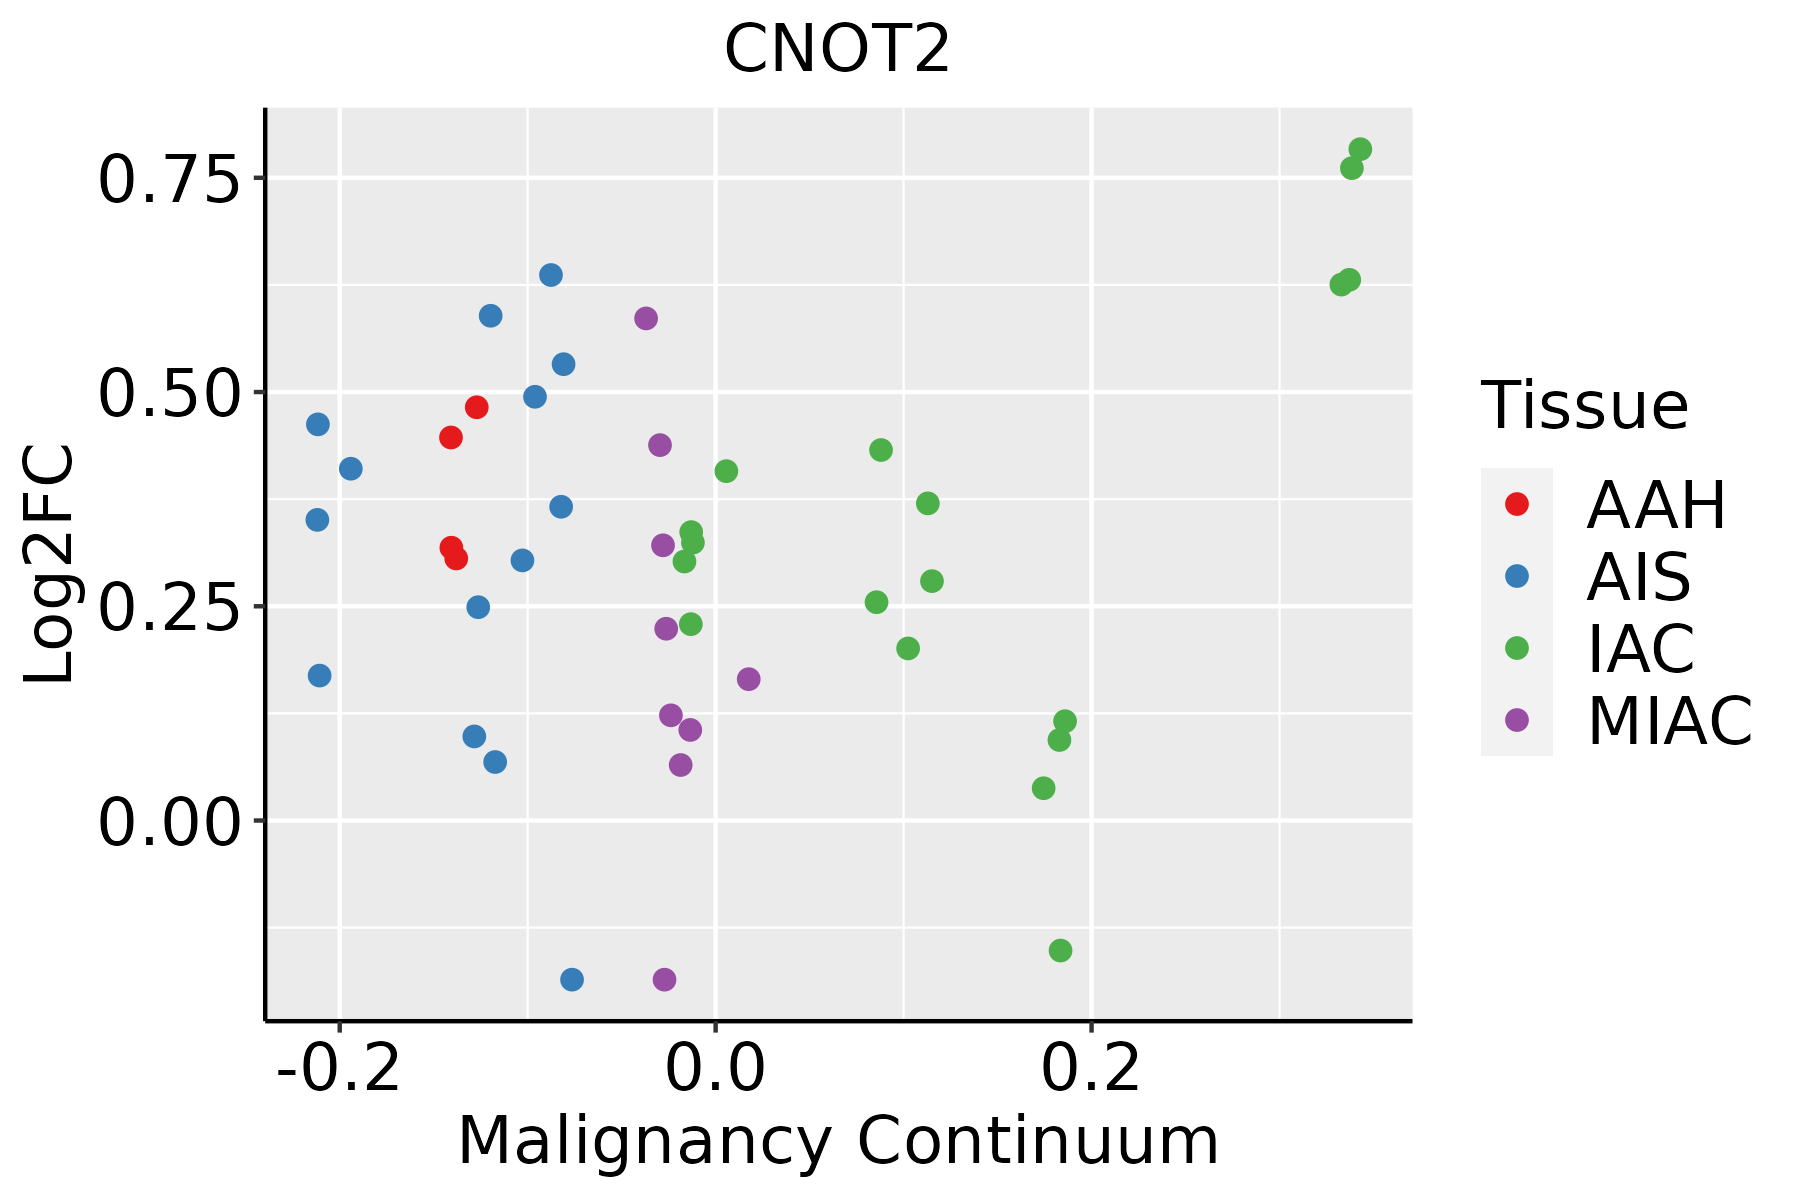 | AAH: Atypical adenomatous hyperplasia |
| AIS: Adenocarcinoma in situ | ||
| IAC: Invasive lung adenocarcinoma | ||
| MIA: Minimally invasive adenocarcinoma | ||
| Oral Cavity |  | EOLP: Erosive Oral lichen planus |
| LP: leukoplakia | ||
| NEOLP: Non-erosive oral lichen planus | ||
| OSCC: Oral squamous cell carcinoma | ||
| Prostate | 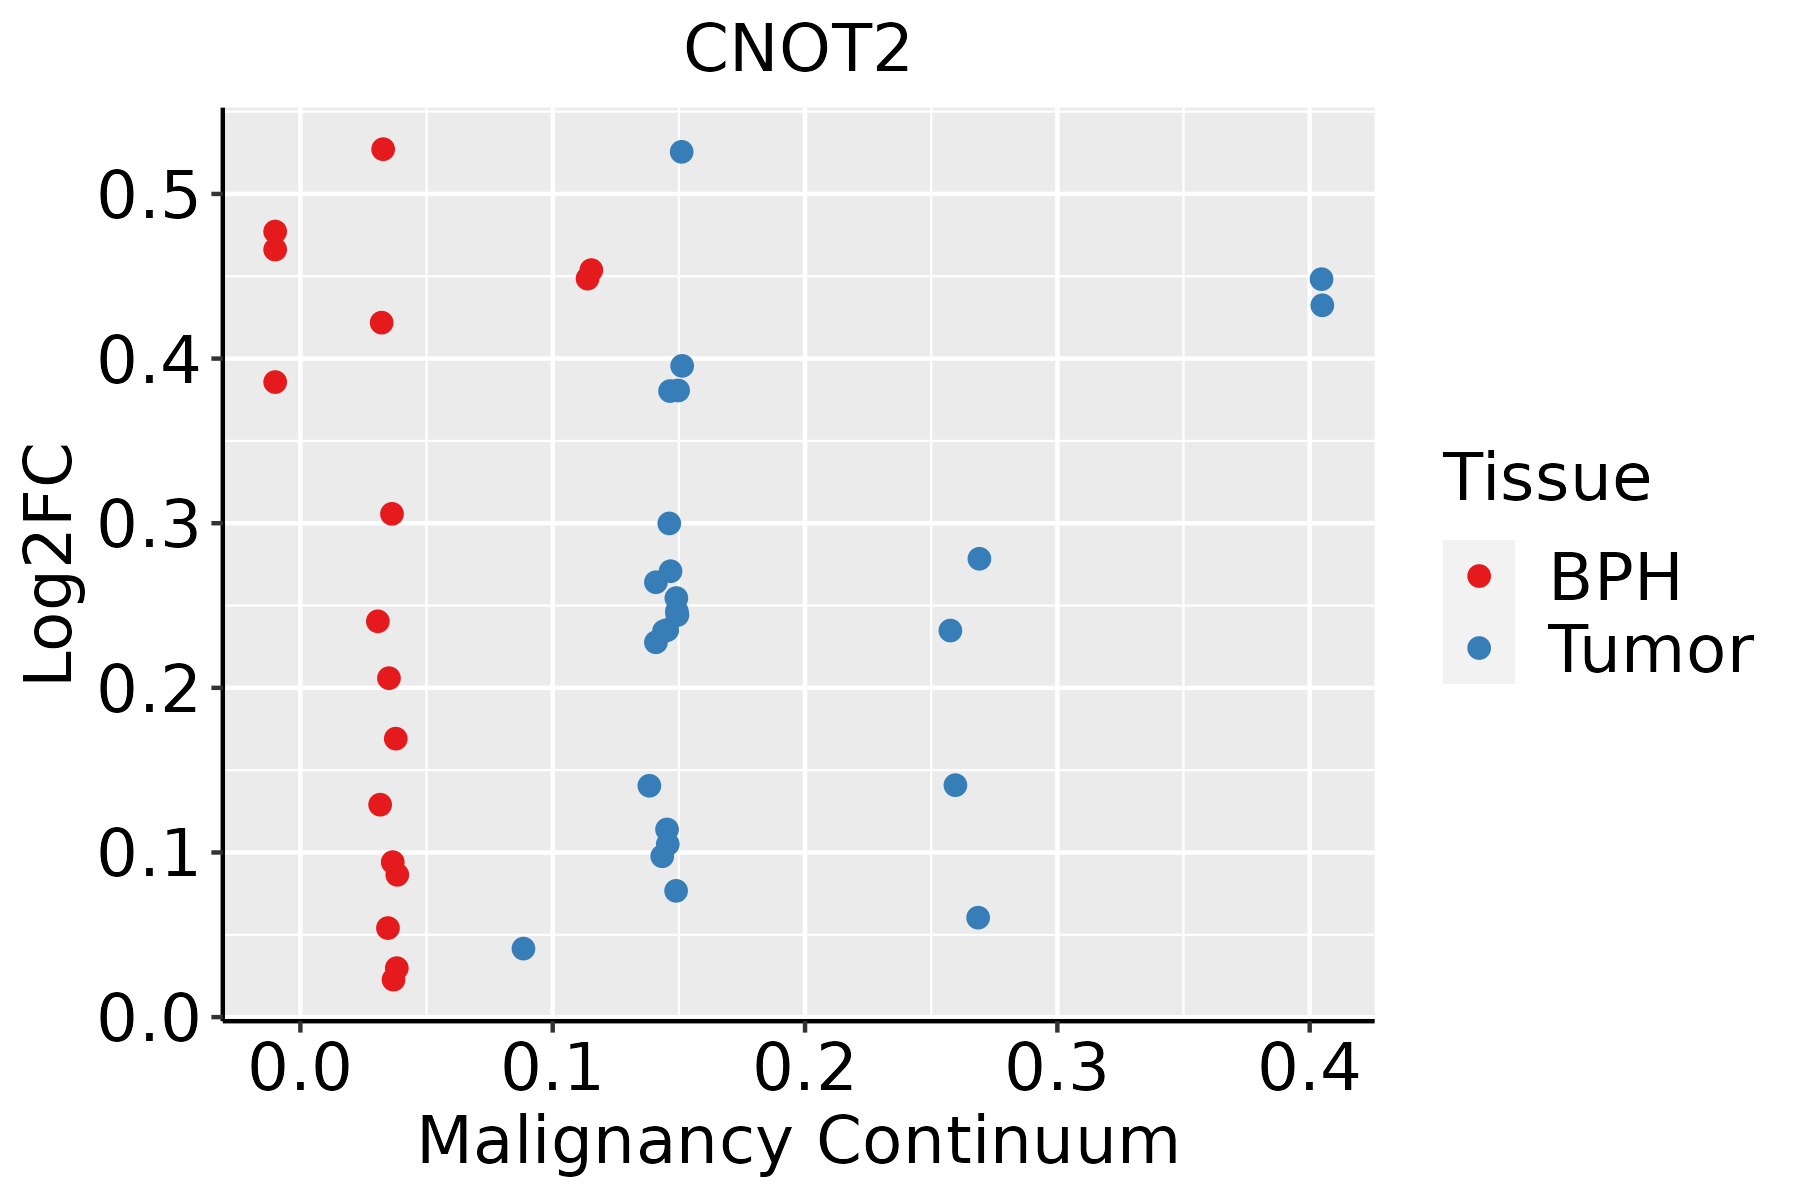 | BPH: Benign Prostatic Hyperplasia |
| Skin | 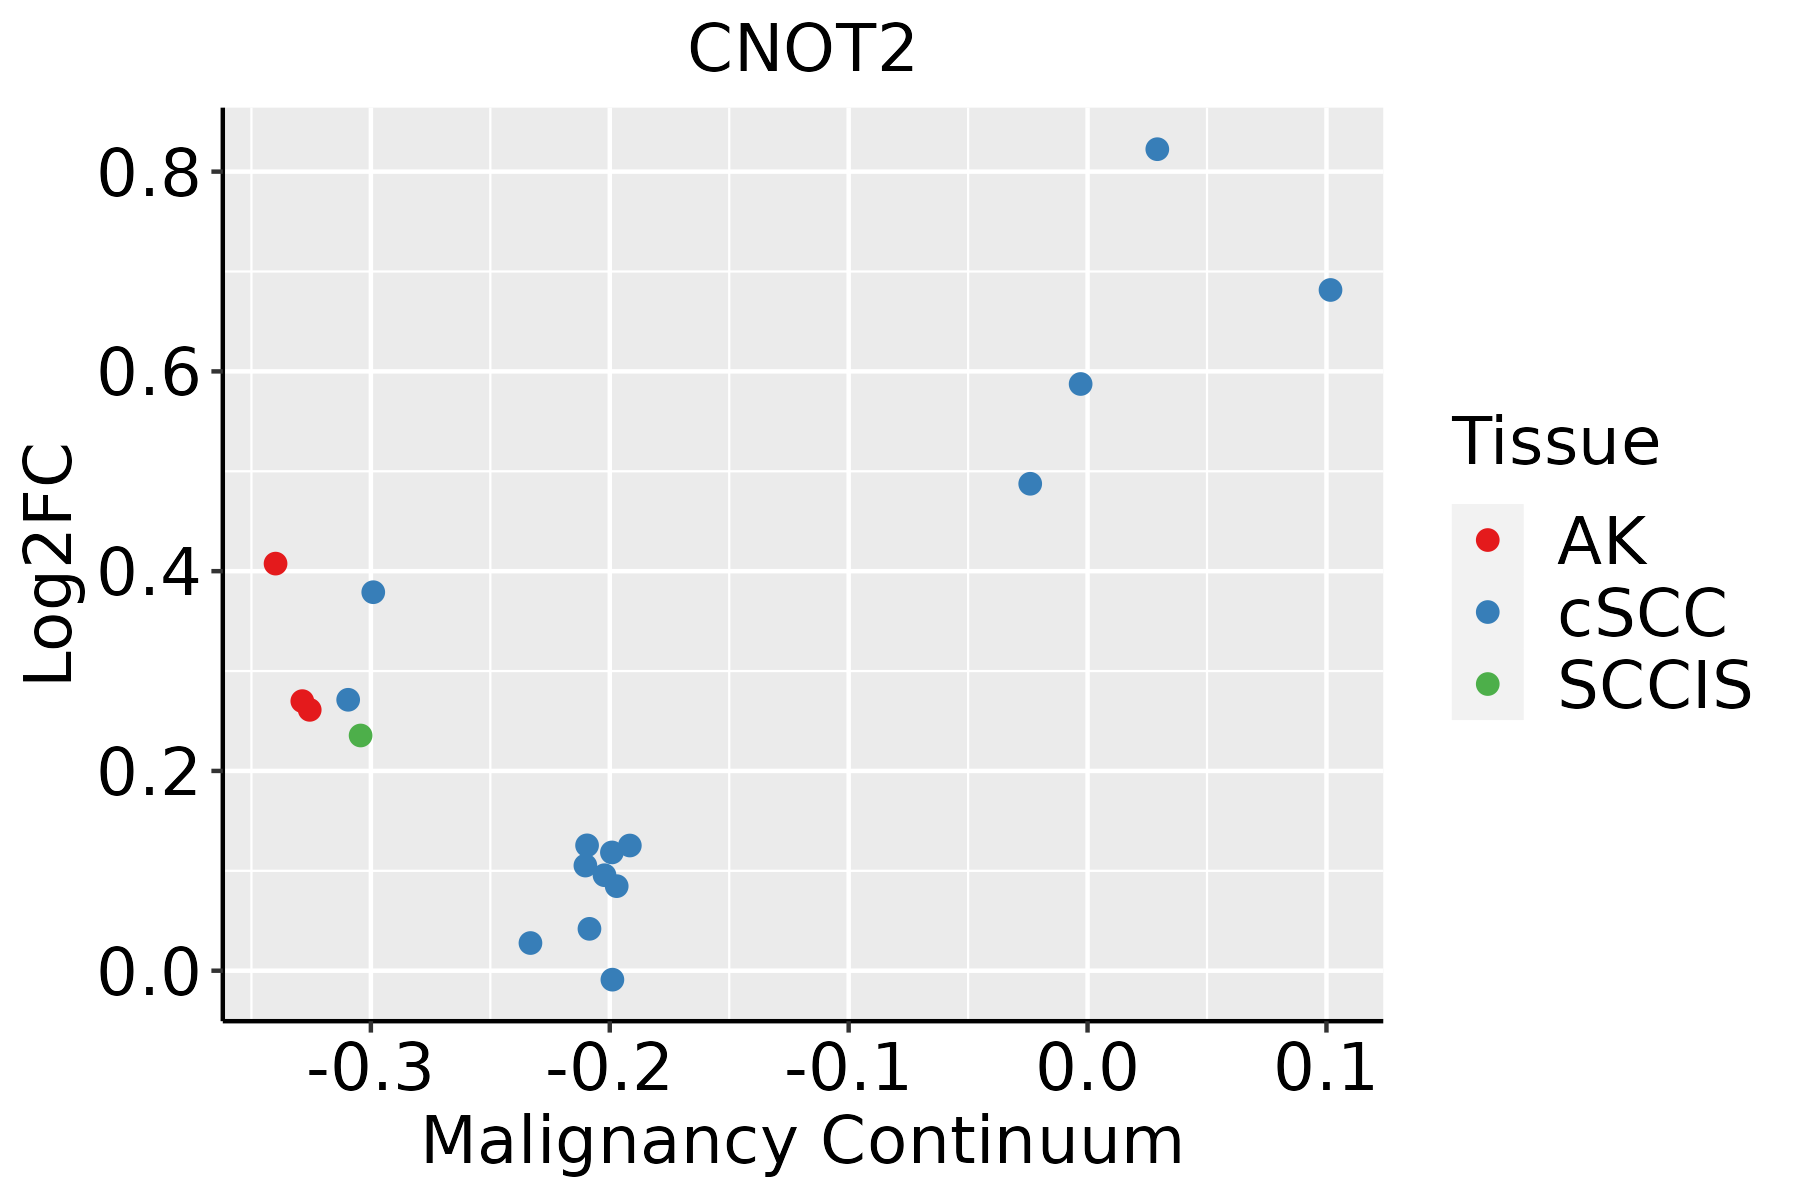 | AK: Actinic keratosis |
| cSCC: Cutaneous squamous cell carcinoma | ||
| SCCIS:squamous cell carcinoma in situ | ||
| Thyroid |  | ATC: Anaplastic thyroid cancer |
| HT: Hashimoto's thyroiditis | ||
| PTC: Papillary thyroid cancer |
| ∗log2FC in expression of this searched gene in stem-like cells from each diseased tissue sample relative to stem-like cells in normal samples in each tissue plotted against the malignancy continuum. Samples are colored based on if they are from different disease stage. |
Top |
Malignant transformation related pathway analysis |
| Find out the enriched GO biological processes and KEGG pathways involved in transition from healthy to precancer to cancer |
| Tissue | Disease Stage | Enriched GO biological Processes |
| Colorectum | AD |  |
| Colorectum | SER |  |
| Colorectum | MSS |  |
| Colorectum | MSI-H |  |
| Colorectum | FAP |  |
| ∗Top 15 enriched GO BP terms are showed in the bar plot of each disease state in each tissue. Each row represents a significant GO biological process which is colored according to the -log10(p.adjust). |
| Page: 1 2 3 4 5 6 7 8 9 |
| GO ID | Tissue | Disease Stage | Description | Gene Ratio | Bg Ratio | pvalue | p.adjust | Count |
| GO:190331331 | Oral cavity | NEOLP | positive regulation of mRNA metabolic process | 35/2005 | 118/18723 | 1.25e-08 | 5.94e-07 | 35 |
| GO:004348832 | Oral cavity | NEOLP | regulation of mRNA stability | 40/2005 | 158/18723 | 1.54e-07 | 5.28e-06 | 40 |
| GO:001982721 | Oral cavity | NEOLP | stem cell population maintenance | 34/2005 | 131/18723 | 6.89e-07 | 1.93e-05 | 34 |
| GO:004348732 | Oral cavity | NEOLP | regulation of RNA stability | 40/2005 | 170/18723 | 1.20e-06 | 3.12e-05 | 40 |
| GO:009872721 | Oral cavity | NEOLP | maintenance of cell number | 34/2005 | 134/18723 | 1.21e-06 | 3.13e-05 | 34 |
| GO:004854532 | Oral cavity | NEOLP | response to steroid hormone | 64/2005 | 339/18723 | 4.45e-06 | 9.55e-05 | 64 |
| GO:003465531 | Oral cavity | NEOLP | nucleobase-containing compound catabolic process | 73/2005 | 407/18723 | 6.69e-06 | 1.34e-04 | 73 |
| GO:007138331 | Oral cavity | NEOLP | cellular response to steroid hormone stimulus | 42/2005 | 204/18723 | 2.34e-05 | 3.73e-04 | 42 |
| GO:006101431 | Oral cavity | NEOLP | positive regulation of mRNA catabolic process | 23/2005 | 87/18723 | 3.05e-05 | 4.63e-04 | 23 |
| GO:004670031 | Oral cavity | NEOLP | heterocycle catabolic process | 75/2005 | 445/18723 | 4.61e-05 | 6.38e-04 | 75 |
| GO:003051831 | Oral cavity | NEOLP | intracellular steroid hormone receptor signaling pathway | 27/2005 | 116/18723 | 7.54e-05 | 9.71e-04 | 27 |
| GO:003424922 | Oral cavity | NEOLP | negative regulation of cellular amide metabolic process | 50/2005 | 273/18723 | 1.05e-04 | 1.27e-03 | 50 |
| GO:000095631 | Oral cavity | NEOLP | nuclear-transcribed mRNA catabolic process | 26/2005 | 112/18723 | 1.06e-04 | 1.28e-03 | 26 |
| GO:004427031 | Oral cavity | NEOLP | cellular nitrogen compound catabolic process | 74/2005 | 451/18723 | 1.24e-04 | 1.47e-03 | 74 |
| GO:006115723 | Oral cavity | NEOLP | mRNA destabilization | 21/2005 | 84/18723 | 1.58e-04 | 1.77e-03 | 21 |
| GO:001714822 | Oral cavity | NEOLP | negative regulation of translation | 45/2005 | 245/18723 | 2.13e-04 | 2.26e-03 | 45 |
| GO:004340131 | Oral cavity | NEOLP | steroid hormone mediated signaling pathway | 29/2005 | 136/18723 | 2.17e-04 | 2.29e-03 | 29 |
| GO:001943931 | Oral cavity | NEOLP | aromatic compound catabolic process | 75/2005 | 467/18723 | 2.22e-04 | 2.34e-03 | 75 |
| GO:005077923 | Oral cavity | NEOLP | RNA destabilization | 21/2005 | 88/18723 | 3.17e-04 | 3.11e-03 | 21 |
| GO:190136131 | Oral cavity | NEOLP | organic cyclic compound catabolic process | 77/2005 | 495/18723 | 4.96e-04 | 4.40e-03 | 77 |
| Page: 1 2 3 4 5 6 7 8 9 10 11 12 13 14 15 16 17 18 19 20 21 22 23 24 25 26 27 28 29 30 31 32 33 34 35 36 37 38 39 |
| Pathway ID | Tissue | Disease Stage | Description | Gene Ratio | Bg Ratio | pvalue | p.adjust | qvalue | Count |
| hsa0301824 | Esophagus | ESCC | RNA degradation | 62/4205 | 79/8465 | 1.18e-07 | 9.39e-07 | 4.81e-07 | 62 |
| hsa0301834 | Esophagus | ESCC | RNA degradation | 62/4205 | 79/8465 | 1.18e-07 | 9.39e-07 | 4.81e-07 | 62 |
| hsa03018 | Liver | Cirrhotic | RNA degradation | 44/2530 | 79/8465 | 1.43e-06 | 1.65e-05 | 1.02e-05 | 44 |
| hsa030181 | Liver | Cirrhotic | RNA degradation | 44/2530 | 79/8465 | 1.43e-06 | 1.65e-05 | 1.02e-05 | 44 |
| hsa030182 | Liver | HCC | RNA degradation | 58/4020 | 79/8465 | 2.29e-06 | 2.19e-05 | 1.22e-05 | 58 |
| hsa030183 | Liver | HCC | RNA degradation | 58/4020 | 79/8465 | 2.29e-06 | 2.19e-05 | 1.22e-05 | 58 |
| hsa030189 | Oral cavity | OSCC | RNA degradation | 59/3704 | 79/8465 | 2.05e-08 | 1.91e-07 | 9.70e-08 | 59 |
| hsa0301814 | Oral cavity | OSCC | RNA degradation | 59/3704 | 79/8465 | 2.05e-08 | 1.91e-07 | 9.70e-08 | 59 |
| hsa0301823 | Oral cavity | LP | RNA degradation | 39/2418 | 79/8465 | 6.98e-05 | 4.38e-04 | 2.83e-04 | 39 |
| hsa0301833 | Oral cavity | LP | RNA degradation | 39/2418 | 79/8465 | 6.98e-05 | 4.38e-04 | 2.83e-04 | 39 |
| hsa0301841 | Oral cavity | EOLP | RNA degradation | 22/1218 | 79/8465 | 1.33e-03 | 4.80e-03 | 2.83e-03 | 22 |
| hsa0301851 | Oral cavity | EOLP | RNA degradation | 22/1218 | 79/8465 | 1.33e-03 | 4.80e-03 | 2.83e-03 | 22 |
| hsa0301861 | Oral cavity | NEOLP | RNA degradation | 18/1112 | 79/8465 | 1.25e-02 | 4.06e-02 | 2.56e-02 | 18 |
| hsa0301871 | Oral cavity | NEOLP | RNA degradation | 18/1112 | 79/8465 | 1.25e-02 | 4.06e-02 | 2.56e-02 | 18 |
| hsa030188 | Prostate | BPH | RNA degradation | 29/1718 | 79/8465 | 5.17e-04 | 2.67e-03 | 1.65e-03 | 29 |
| hsa0301813 | Prostate | BPH | RNA degradation | 29/1718 | 79/8465 | 5.17e-04 | 2.67e-03 | 1.65e-03 | 29 |
| hsa0301822 | Prostate | Tumor | RNA degradation | 30/1791 | 79/8465 | 4.48e-04 | 2.35e-03 | 1.46e-03 | 30 |
| hsa0301832 | Prostate | Tumor | RNA degradation | 30/1791 | 79/8465 | 4.48e-04 | 2.35e-03 | 1.46e-03 | 30 |
| Page: 1 |
Top |
Cell-cell communication analysis |
| Identification of potential cell-cell interactions between two cell types and their ligand-receptor pairs for different disease states |
| Ligand | Receptor | LRpair | Pathway | Tissue | Disease Stage |
| Page: 1 |
Top |
Single-cell gene regulatory network inference analysis |
| Find out the significant the regulons (TFs) and the target genes of each regulon across cell types for different disease states |
| TF | Cell Type | Tissue | Disease Stage | Target Gene | RSS | Regulon Activity |
| ∗The dot plots of a searched regulon are shown for all cell subpopulations in each disease state of each tissue based on the regulon specific score inferred using pySCENIC and by calculating the average expression. |
| Page: 1 |
Top |
Somatic mutation of malignant transformation related genes |
| Annotation of somatic variants for genes involved in malignant transformation |
| Hugo Symbol | Variant Class | Variant Classification | dbSNP RS | HGVSc | HGVSp | HGVSp Short | SWISSPROT | BIOTYPE | SIFT | PolyPhen | Tumor Sample Barcode | Tissue | Histology | Sex | Age | Stage | Therapy Types | Drugs | Outcome |
| CNOT2 | SNV | Missense_Mutation | c.420N>T | p.Met140Ile | p.M140I | Q9NZN8 | protein_coding | tolerated(0.38) | benign(0.003) | TCGA-A2-A0SW-01 | Breast | breast invasive carcinoma | Female | >=65 | III/IV | Hormone Therapy | arimidex | PD | |
| CNOT2 | SNV | Missense_Mutation | c.77N>T | p.Arg26Ile | p.R26I | Q9NZN8 | protein_coding | deleterious_low_confidence(0) | probably_damaging(0.979) | TCGA-AC-A23H-01 | Breast | breast invasive carcinoma | Female | >=65 | I/II | Unknown | Unknown | PD | |
| CNOT2 | SNV | Missense_Mutation | novel | c.1620N>G | p.Phe540Leu | p.F540L | Q9NZN8 | protein_coding | deleterious_low_confidence(0) | possibly_damaging(0.899) | TCGA-AC-A23H-01 | Breast | breast invasive carcinoma | Female | >=65 | I/II | Unknown | Unknown | PD |
| CNOT2 | SNV | Missense_Mutation | novel | c.118N>A | p.Glu40Lys | p.E40K | Q9NZN8 | protein_coding | deleterious_low_confidence(0.04) | benign(0.079) | TCGA-AN-A046-01 | Breast | breast invasive carcinoma | Female | >=65 | I/II | Unknown | Unknown | SD |
| CNOT2 | SNV | Missense_Mutation | novel | c.608N>A | p.Gly203Glu | p.G203E | Q9NZN8 | protein_coding | deleterious(0.03) | benign(0.081) | TCGA-AR-A24H-01 | Breast | breast invasive carcinoma | Female | >=65 | I/II | Hormone Therapy | tamoxiphen | SD |
| CNOT2 | SNV | Missense_Mutation | rs756678475 | c.1055C>T | p.Thr352Met | p.T352M | Q9NZN8 | protein_coding | tolerated(0.06) | possibly_damaging(0.891) | TCGA-C8-A135-01 | Breast | breast invasive carcinoma | Female | <65 | I/II | Chemotherapy | 5-fluorouracil | CR |
| CNOT2 | SNV | Missense_Mutation | novel | c.683N>T | p.Ser228Leu | p.S228L | Q9NZN8 | protein_coding | deleterious(0) | benign(0.305) | TCGA-E2-A2P6-01 | Breast | breast invasive carcinoma | Female | >=65 | I/II | Hormone Therapy | anastrozole | SD |
| CNOT2 | SNV | Missense_Mutation | novel | c.746T>G | p.Ile249Arg | p.I249R | Q9NZN8 | protein_coding | tolerated(0.35) | benign(0.013) | TCGA-EA-A3HU-01 | Cervix | cervical & endocervical cancer | Female | <65 | I/II | Unknown | Unknown | SD |
| CNOT2 | SNV | Missense_Mutation | c.766N>T | p.Ala256Ser | p.A256S | Q9NZN8 | protein_coding | tolerated(0.24) | benign(0.005) | TCGA-EA-A5ZD-01 | Cervix | cervical & endocervical cancer | Female | <65 | I/II | Unknown | Unknown | SD | |
| CNOT2 | SNV | Missense_Mutation | rs750913052 | c.368C>T | p.Thr123Met | p.T123M | Q9NZN8 | protein_coding | tolerated_low_confidence(0.15) | possibly_damaging(0.459) | TCGA-VS-A94Z-01 | Cervix | cervical & endocervical cancer | Female | <65 | I/II | Chemotherapy | cisplatin | CR |
| Page: 1 2 3 4 5 6 7 8 |
Top |
Related drugs of malignant transformation related genes |
| Identification of chemicals and drugs interact with genes involved in malignant transfromation |
| (DGIdb 4.0) |
| Entrez ID | Symbol | Category | Interaction Types | Drug Claim Name | Drug Name | PMIDs |
| Page: 1 |

Copyright 2023-Present -The University of Texas Health Science Center at Houston |