
|
|||||
|
 | |
| |
| |
| |
| |
| |
|
Gene: ATF3 |
Gene summary for ATF3 |
| Gene information | Species | Human | Gene symbol | ATF3 | Gene ID | 467 |
| Gene name | activating transcription factor 3 | |
| Gene Alias | ATF3 | |
| Cytomap | 1q32.3 | |
| Gene Type | protein-coding | GO ID | GO:0000122 | UniProtAcc | P18847 |
Top |
Malignant transformation analysis |
| Identification of the aberrant gene expression in precancerous and cancerous lesions by comparing the gene expression of stem-like cells in diseased tissues with normal stem cells |
| Entrez ID | Symbol | Replicates | Species | Organ | Tissue | Adj P-value | Log2FC | Malignancy |
| 467 | ATF3 | GSM4909286 | Human | Breast | IDC | 1.49e-24 | -7.65e-01 | 0.1081 |
| 467 | ATF3 | GSM4909290 | Human | Breast | IDC | 2.98e-23 | -8.38e-01 | 0.2096 |
| 467 | ATF3 | GSM4909291 | Human | Breast | IDC | 1.97e-02 | 3.39e-01 | 0.1753 |
| 467 | ATF3 | GSM4909294 | Human | Breast | IDC | 3.37e-12 | -5.57e-01 | 0.2022 |
| 467 | ATF3 | GSM4909296 | Human | Breast | IDC | 6.67e-04 | -3.38e-01 | 0.1524 |
| 467 | ATF3 | GSM4909297 | Human | Breast | IDC | 1.36e-07 | -3.22e-01 | 0.1517 |
| 467 | ATF3 | GSM4909298 | Human | Breast | IDC | 2.00e-12 | -6.42e-01 | 0.1551 |
| 467 | ATF3 | GSM4909299 | Human | Breast | IDC | 2.53e-15 | 5.34e-01 | 0.035 |
| 467 | ATF3 | GSM4909300 | Human | Breast | IDC | 8.60e-15 | 6.96e-01 | 0.0334 |
| 467 | ATF3 | GSM4909304 | Human | Breast | IDC | 1.61e-09 | -6.29e-01 | 0.1636 |
| 467 | ATF3 | GSM4909307 | Human | Breast | IDC | 2.56e-15 | -6.75e-01 | 0.1569 |
| 467 | ATF3 | GSM4909311 | Human | Breast | IDC | 3.52e-22 | -5.71e-01 | 0.1534 |
| 467 | ATF3 | GSM4909312 | Human | Breast | IDC | 1.10e-08 | -5.08e-01 | 0.1552 |
| 467 | ATF3 | GSM4909315 | Human | Breast | IDC | 3.05e-02 | -3.53e-01 | 0.21 |
| 467 | ATF3 | GSM4909316 | Human | Breast | IDC | 3.65e-05 | -7.07e-01 | 0.21 |
| 467 | ATF3 | GSM4909317 | Human | Breast | IDC | 8.47e-06 | 3.95e-01 | 0.1355 |
| 467 | ATF3 | GSM4909319 | Human | Breast | IDC | 1.28e-25 | -1.55e-01 | 0.1563 |
| 467 | ATF3 | GSM4909321 | Human | Breast | IDC | 6.04e-26 | 5.66e-01 | 0.1559 |
| 467 | ATF3 | brca1 | Human | Breast | Precancer | 3.13e-04 | -5.07e-01 | -0.0338 |
| 467 | ATF3 | brca2 | Human | Breast | Precancer | 2.53e-07 | -6.06e-01 | -0.024 |
| Page: 1 2 3 4 5 6 7 8 9 10 11 12 13 |
| Tissue | Expression Dynamics | Abbreviation |
| Breast |  | IDC: Invasive ductal carcinoma |
| DCIS: Ductal carcinoma in situ | ||
| Precancer(BRCA1-mut): Precancerous lesion from BRCA1 mutation carriers | ||
| Cervix |  | CC: Cervix cancer |
| HSIL_HPV: HPV-infected high-grade squamous intraepithelial lesions | ||
| N_HPV: HPV-infected normal cervix | ||
| Endometrium | 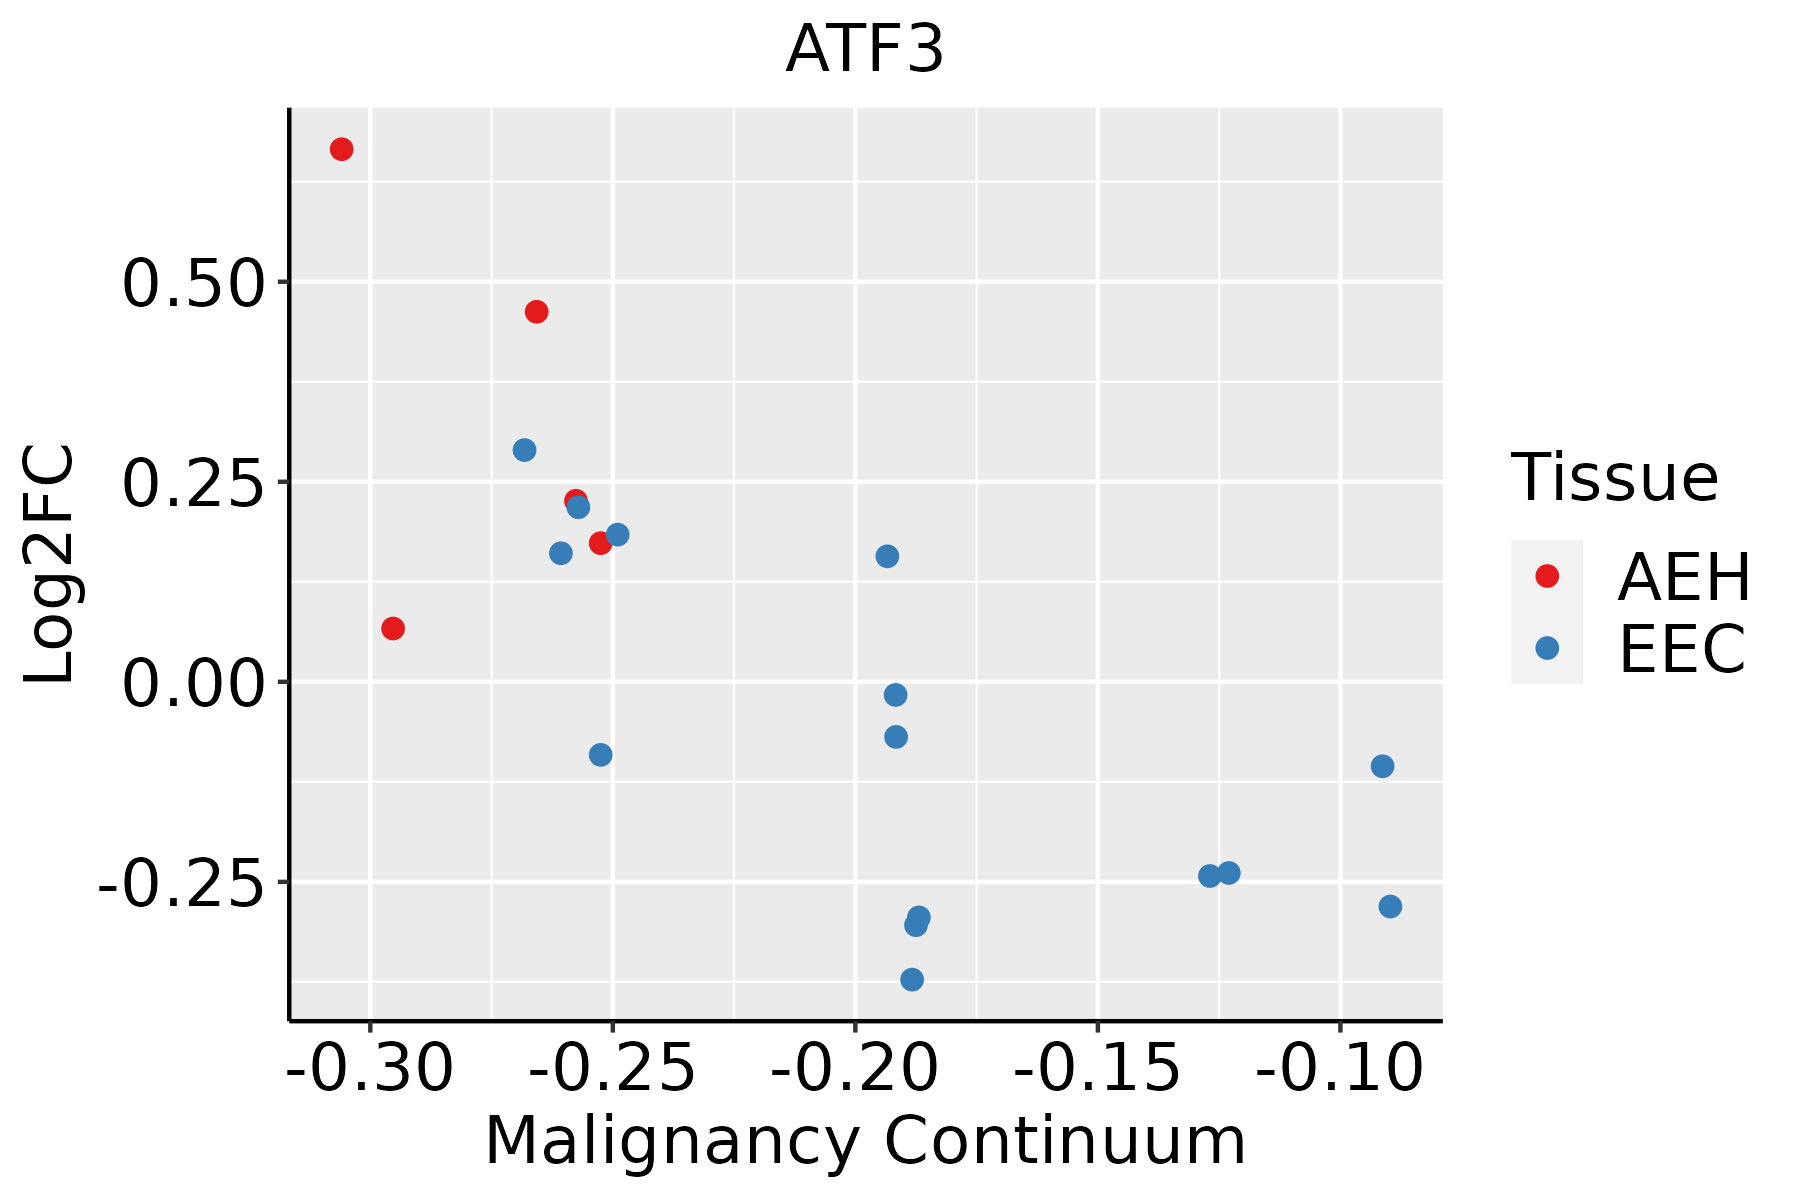 | AEH: Atypical endometrial hyperplasia |
| EEC: Endometrioid Cancer | ||
| Esophagus | 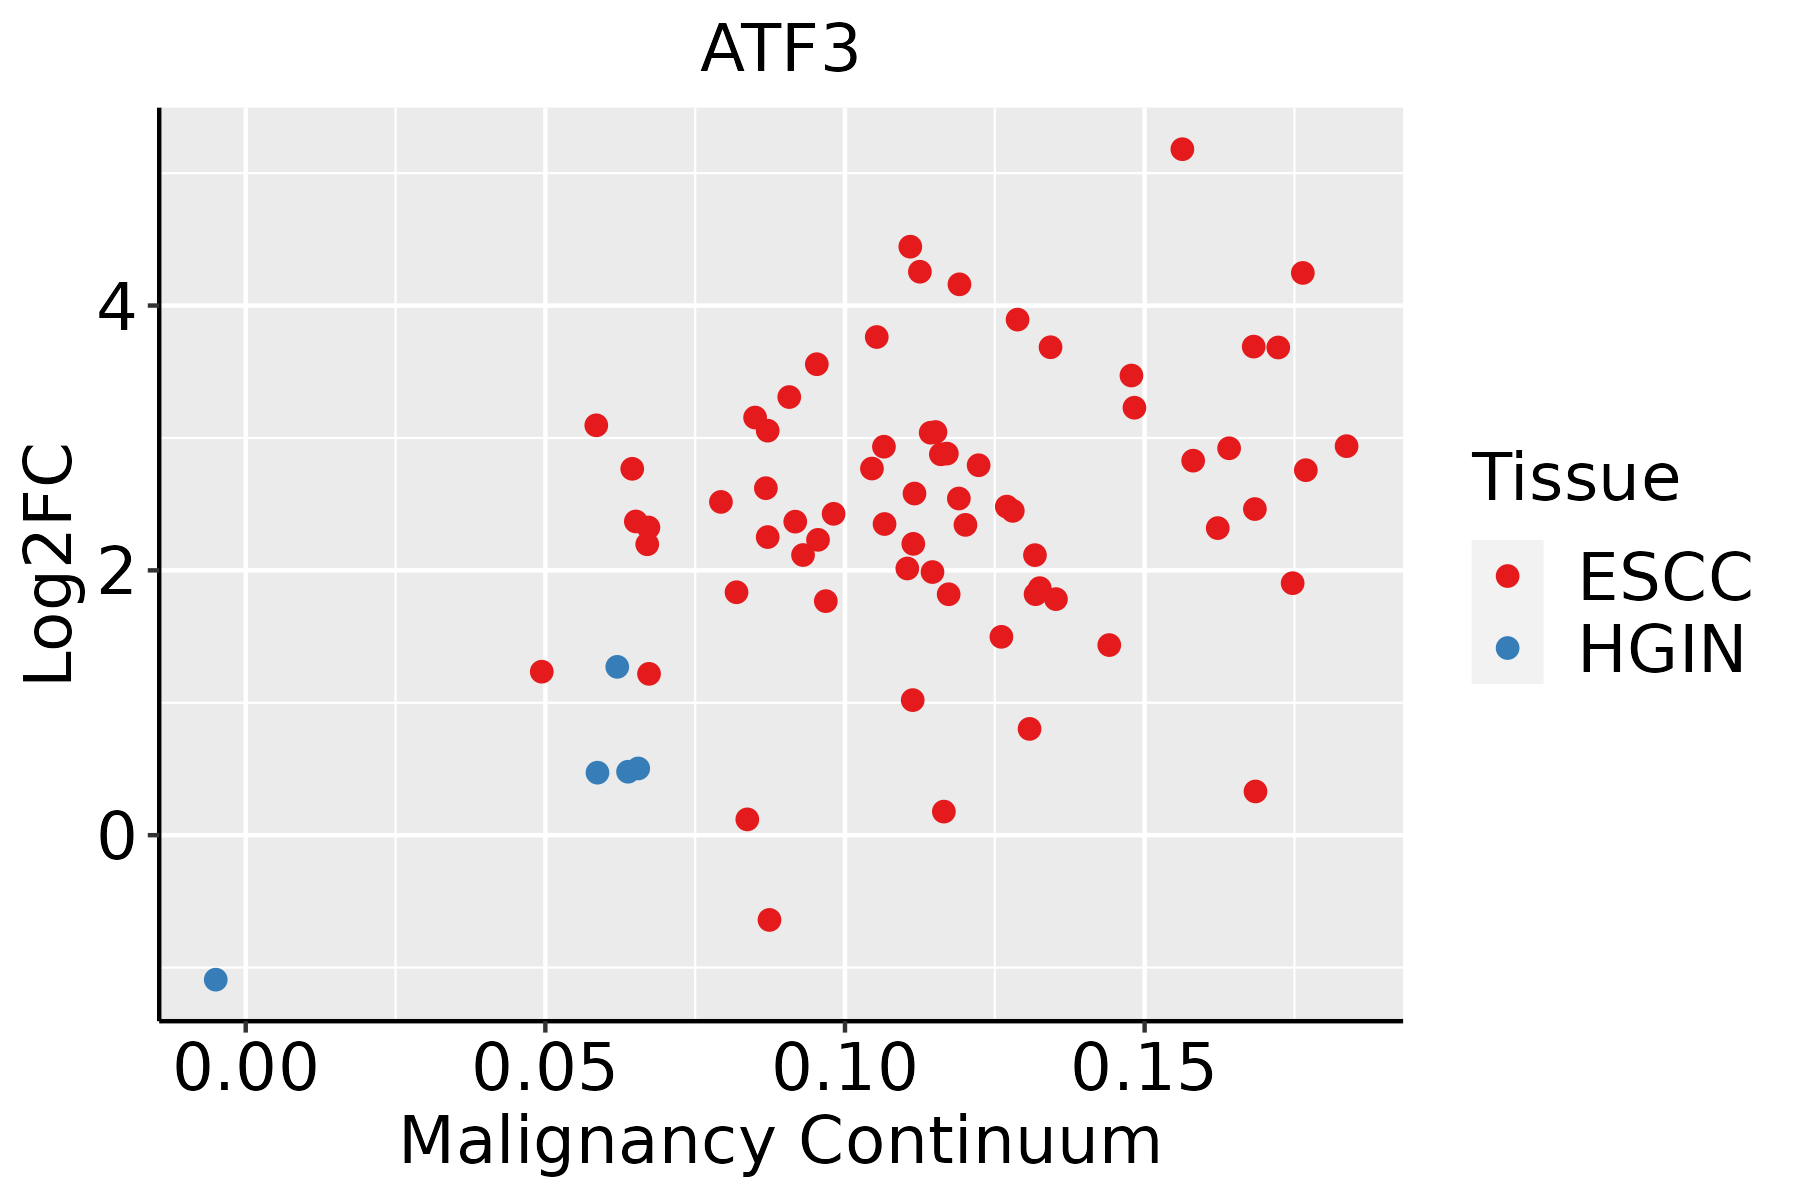 | ESCC: Esophageal squamous cell carcinoma |
| HGIN: High-grade intraepithelial neoplasias | ||
| LGIN: Low-grade intraepithelial neoplasias | ||
| GC |  | CAG: Chronic atrophic gastritis |
| CAG with IM: Chronic atrophic gastritis with intestinal metaplasia | ||
| CSG: Chronic superficial gastritis | ||
| GC: Gastric cancer | ||
| SIM: Severe intestinal metaplasia | ||
| WIM: Wild intestinal metaplasia | ||
| Liver | 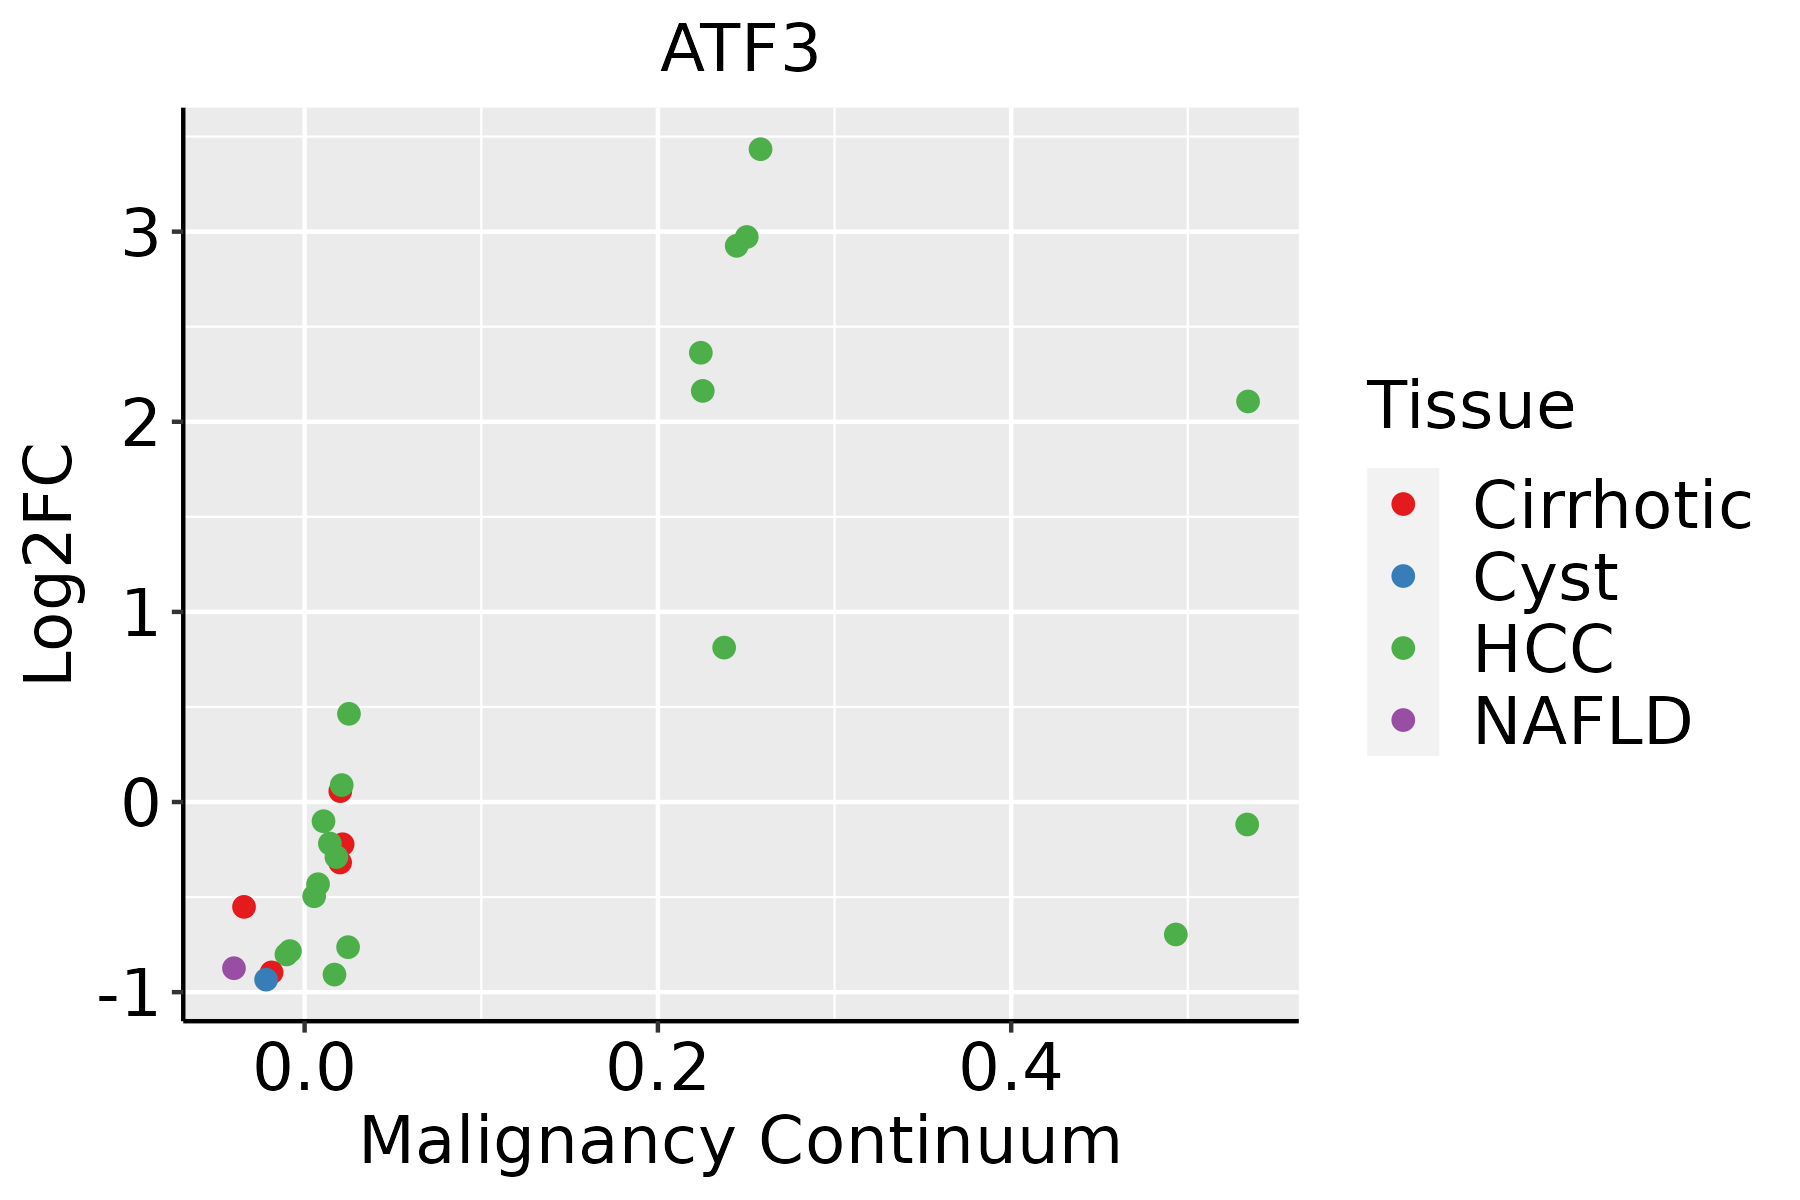 | HCC: Hepatocellular carcinoma |
| NAFLD: Non-alcoholic fatty liver disease | ||
| Lung |  | AAH: Atypical adenomatous hyperplasia |
| AIS: Adenocarcinoma in situ | ||
| IAC: Invasive lung adenocarcinoma | ||
| MIA: Minimally invasive adenocarcinoma | ||
| Oral Cavity | 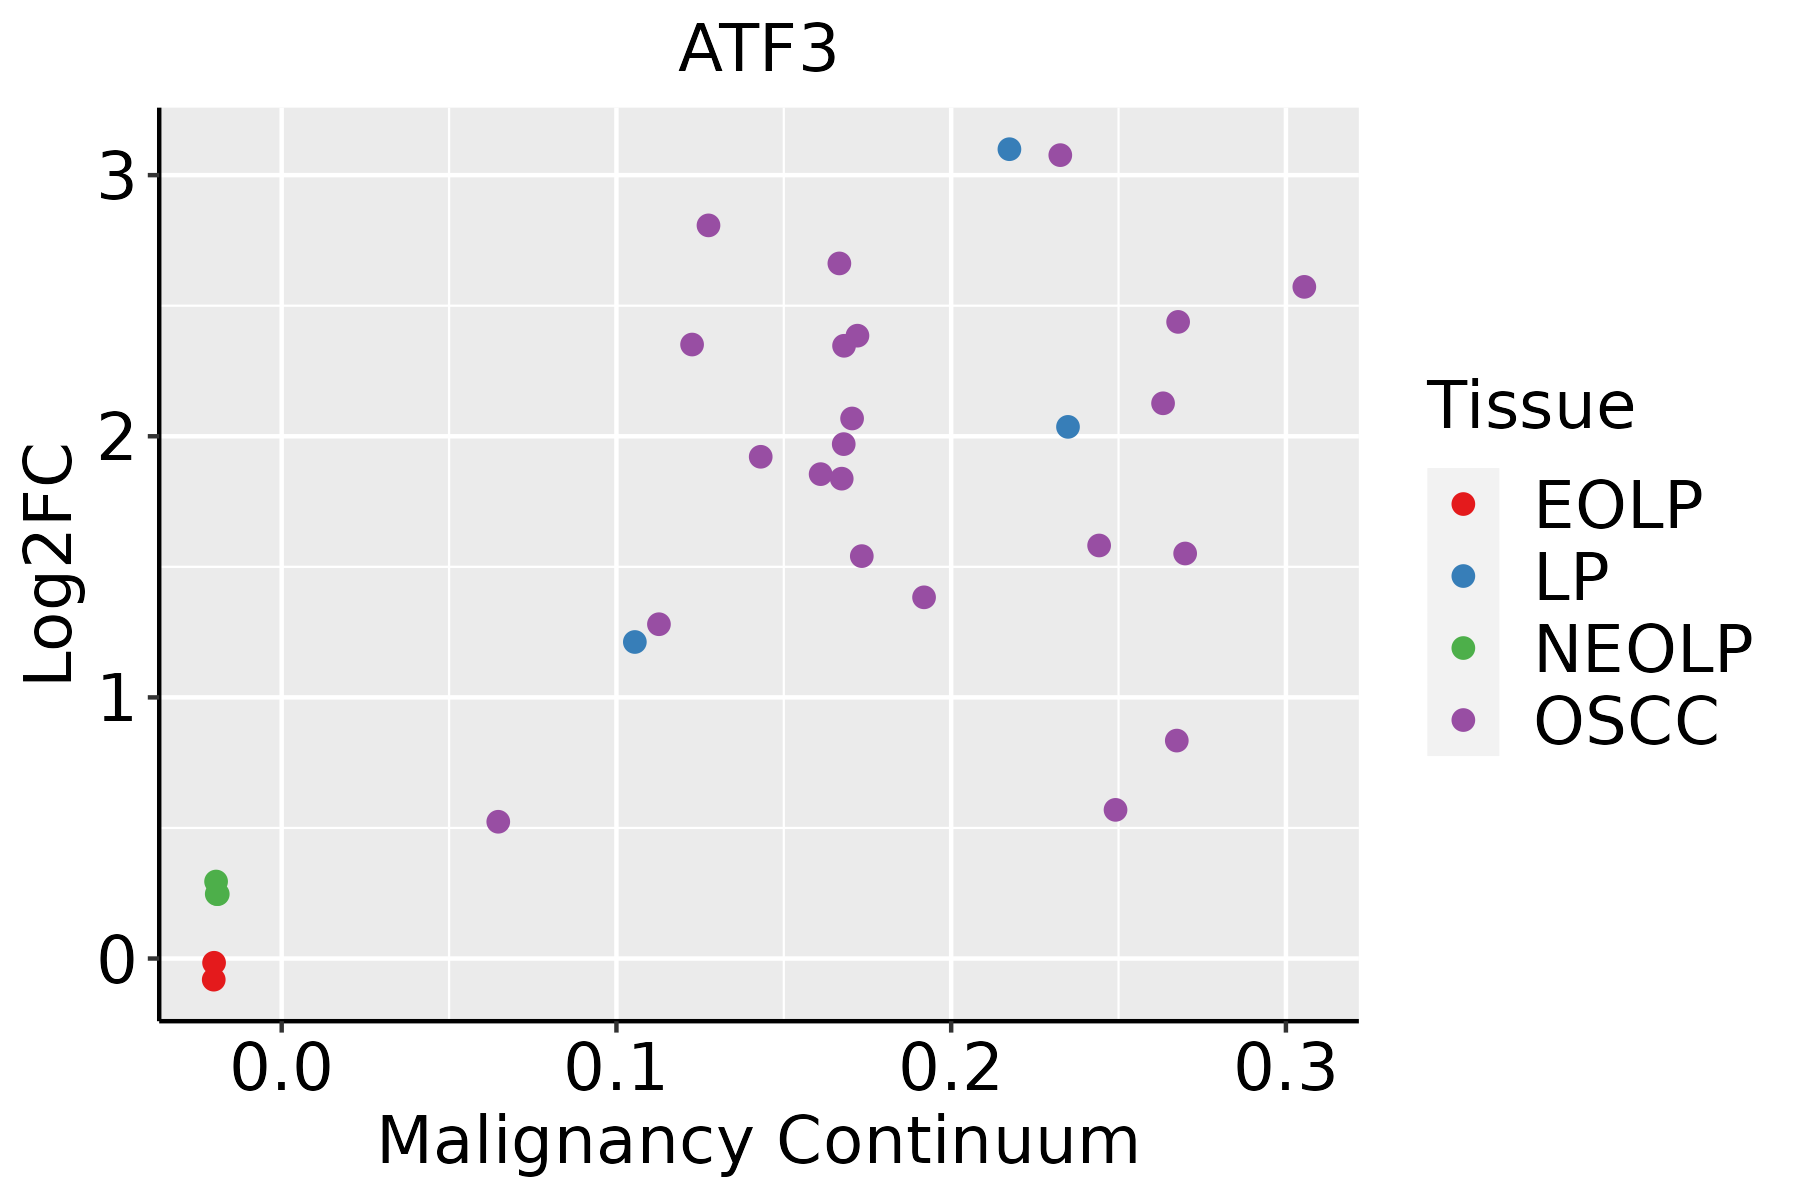 | EOLP: Erosive Oral lichen planus |
| LP: leukoplakia | ||
| NEOLP: Non-erosive oral lichen planus | ||
| OSCC: Oral squamous cell carcinoma | ||
| Prostate |  | BPH: Benign Prostatic Hyperplasia |
| Skin | 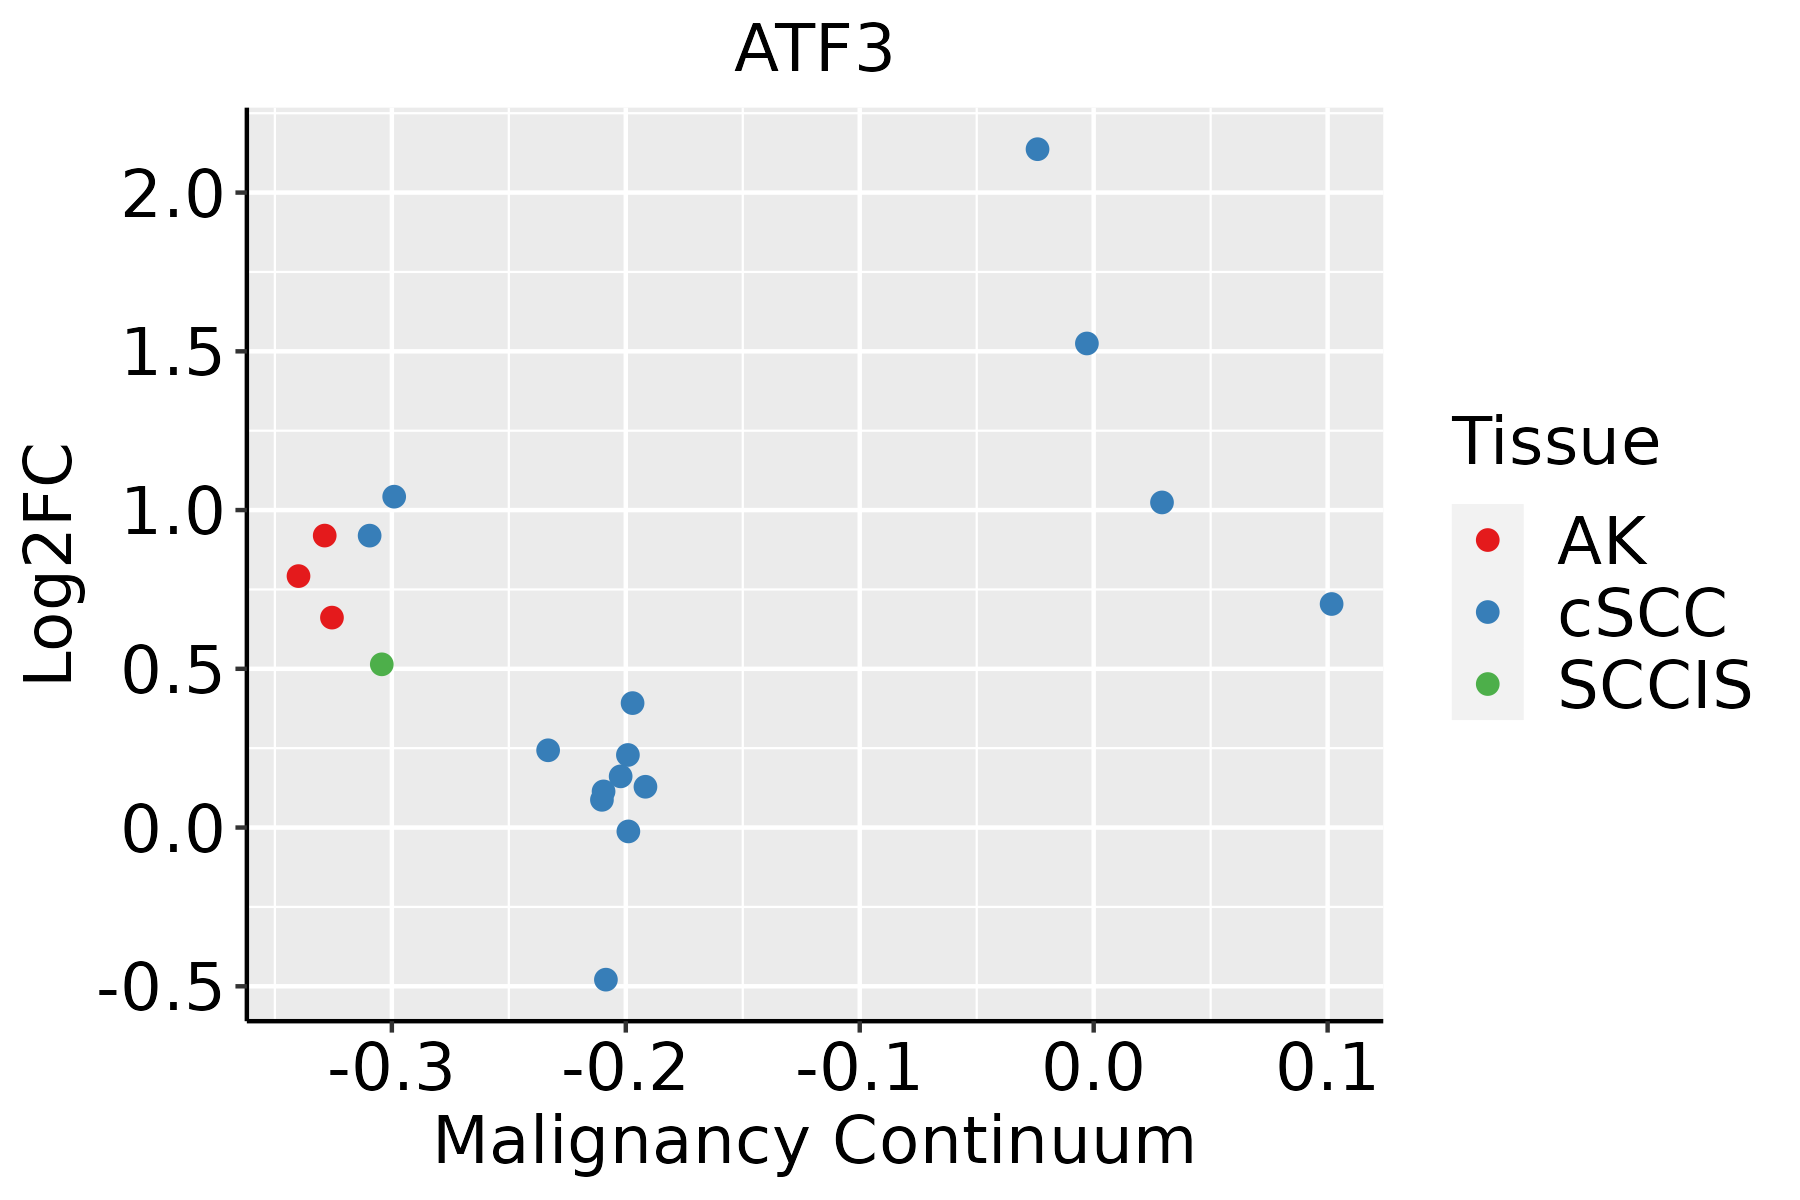 | AK: Actinic keratosis |
| cSCC: Cutaneous squamous cell carcinoma | ||
| SCCIS:squamous cell carcinoma in situ | ||
| Thyroid |  | ATC: Anaplastic thyroid cancer |
| HT: Hashimoto's thyroiditis | ||
| PTC: Papillary thyroid cancer |
| ∗log2FC in expression of this searched gene in stem-like cells from each diseased tissue sample relative to stem-like cells in normal samples in each tissue plotted against the malignancy continuum. Samples are colored based on if they are from different disease stage. |
Top |
Malignant transformation related pathway analysis |
| Find out the enriched GO biological processes and KEGG pathways involved in transition from healthy to precancer to cancer |
| Tissue | Disease Stage | Enriched GO biological Processes |
| Colorectum | AD |  |
| Colorectum | SER |  |
| Colorectum | MSS |  |
| Colorectum | MSI-H |  |
| Colorectum | FAP |  |
| ∗Top 15 enriched GO BP terms are showed in the bar plot of each disease state in each tissue. Each row represents a significant GO biological process which is colored according to the -log10(p.adjust). |
| Page: 1 2 3 4 5 6 7 8 9 |
| GO ID | Tissue | Disease Stage | Description | Gene Ratio | Bg Ratio | pvalue | p.adjust | Count |
| GO:199092812 | Oral cavity | EOLP | response to amino acid starvation | 13/2218 | 49/18723 | 3.75e-03 | 2.10e-02 | 13 |
| GO:007124322 | Oral cavity | EOLP | cellular response to arsenic-containing substance | 7/2218 | 20/18723 | 6.20e-03 | 3.09e-02 | 7 |
| GO:200123334 | Oral cavity | NEOLP | regulation of apoptotic signaling pathway | 94/2005 | 356/18723 | 4.19e-17 | 3.11e-14 | 94 |
| GO:200123632 | Oral cavity | NEOLP | regulation of extrinsic apoptotic signaling pathway | 44/2005 | 151/18723 | 3.30e-10 | 2.97e-08 | 44 |
| GO:009719133 | Oral cavity | NEOLP | extrinsic apoptotic signaling pathway | 55/2005 | 219/18723 | 1.07e-09 | 7.82e-08 | 55 |
| GO:003497632 | Oral cavity | NEOLP | response to endoplasmic reticulum stress | 56/2005 | 256/18723 | 1.39e-07 | 4.84e-06 | 56 |
| GO:200123532 | Oral cavity | NEOLP | positive regulation of apoptotic signaling pathway | 34/2005 | 126/18723 | 2.55e-07 | 8.23e-06 | 34 |
| GO:004362032 | Oral cavity | NEOLP | regulation of DNA-templated transcription in response to stress | 19/2005 | 53/18723 | 1.11e-06 | 2.91e-05 | 19 |
| GO:006053723 | Oral cavity | NEOLP | muscle tissue development | 75/2005 | 403/18723 | 1.22e-06 | 3.15e-05 | 75 |
| GO:190204131 | Oral cavity | NEOLP | regulation of extrinsic apoptotic signaling pathway via death domain receptors | 18/2005 | 49/18723 | 1.40e-06 | 3.56e-05 | 18 |
| GO:003596632 | Oral cavity | NEOLP | response to topologically incorrect protein | 38/2005 | 159/18723 | 1.46e-06 | 3.68e-05 | 38 |
| GO:000698632 | Oral cavity | NEOLP | response to unfolded protein | 34/2005 | 137/18723 | 2.08e-06 | 4.87e-05 | 34 |
| GO:004361831 | Oral cavity | NEOLP | regulation of transcription from RNA polymerase II promoter in response to stress | 17/2005 | 47/18723 | 3.52e-06 | 7.79e-05 | 17 |
| GO:200123831 | Oral cavity | NEOLP | positive regulation of extrinsic apoptotic signaling pathway | 17/2005 | 48/18723 | 4.90e-06 | 1.03e-04 | 17 |
| GO:000862531 | Oral cavity | NEOLP | extrinsic apoptotic signaling pathway via death domain receptors | 23/2005 | 82/18723 | 1.07e-05 | 1.98e-04 | 23 |
| GO:001470621 | Oral cavity | NEOLP | striated muscle tissue development | 69/2005 | 384/18723 | 1.11e-05 | 2.06e-04 | 69 |
| GO:003166831 | Oral cavity | NEOLP | cellular response to extracellular stimulus | 48/2005 | 246/18723 | 2.80e-05 | 4.32e-04 | 48 |
| GO:007149632 | Oral cavity | NEOLP | cellular response to external stimulus | 57/2005 | 320/18723 | 8.00e-05 | 1.01e-03 | 57 |
| GO:003166932 | Oral cavity | NEOLP | cellular response to nutrient levels | 42/2005 | 215/18723 | 8.37e-05 | 1.05e-03 | 42 |
| GO:003600321 | Oral cavity | NEOLP | positive regulation of transcription from RNA polymerase II promoter in response to stress | 10/2005 | 24/18723 | 9.23e-05 | 1.14e-03 | 10 |
| Page: 1 2 3 4 5 6 7 8 9 10 11 12 13 14 15 16 17 18 19 20 21 22 23 24 25 26 27 28 29 30 31 32 33 34 35 36 37 38 39 40 41 42 43 44 45 46 47 |
| Pathway ID | Tissue | Disease Stage | Description | Gene Ratio | Bg Ratio | pvalue | p.adjust | qvalue | Count |
| Page: 1 |
Top |
Cell-cell communication analysis |
| Identification of potential cell-cell interactions between two cell types and their ligand-receptor pairs for different disease states |
| Ligand | Receptor | LRpair | Pathway | Tissue | Disease Stage |
| Page: 1 |
Top |
Single-cell gene regulatory network inference analysis |
| Find out the significant the regulons (TFs) and the target genes of each regulon across cell types for different disease states |
| TF | Cell Type | Tissue | Disease Stage | Target Gene | RSS | Regulon Activity |
| ATF3 | DUCT1 | Pancreas | PanIN | FOSB,PPP1R15A,SERTAD1, etc. | 2.91e-01 |  |
| ∗The dot plots of a searched regulon are shown for all cell subpopulations in each disease state of each tissue based on the regulon specific score inferred using pySCENIC and by calculating the average expression. |
| Page: 1 |
Top |
Somatic mutation of malignant transformation related genes |
| Annotation of somatic variants for genes involved in malignant transformation |
| Hugo Symbol | Variant Class | Variant Classification | dbSNP RS | HGVSc | HGVSp | HGVSp Short | SWISSPROT | BIOTYPE | SIFT | PolyPhen | Tumor Sample Barcode | Tissue | Histology | Sex | Age | Stage | Therapy Types | Drugs | Outcome |
| ATF3 | SNV | Missense_Mutation | c.379G>A | p.Glu127Lys | p.E127K | P18847 | protein_coding | deleterious(0.05) | benign(0.247) | TCGA-A8-A09M-01 | Breast | breast invasive carcinoma | Female | >=65 | III/IV | Chemotherapy | paclitaxel | CR | |
| ATF3 | SNV | Missense_Mutation | c.498N>C | p.Glu166Asp | p.E166D | P18847 | protein_coding | deleterious(0.01) | probably_damaging(0.967) | TCGA-AR-A1AN-01 | Breast | breast invasive carcinoma | Female | <65 | I/II | Chemotherapy | cytoxan | SD | |
| ATF3 | SNV | Missense_Mutation | c.62N>G | p.Pro21Arg | p.P21R | P18847 | protein_coding | deleterious(0) | probably_damaging(0.996) | TCGA-D8-A27G-01 | Breast | breast invasive carcinoma | Female | >=65 | I/II | Unknown | Unknown | SD | |
| ATF3 | SNV | Missense_Mutation | novel | c.278G>A | p.Arg93Gln | p.R93Q | P18847 | protein_coding | tolerated(0.08) | possibly_damaging(0.634) | TCGA-2W-A8YY-01 | Cervix | cervical & endocervical cancer | Female | <65 | I/II | Chemotherapy | cisplatin | CR |
| ATF3 | SNV | Missense_Mutation | novel | c.455C>T | p.Thr152Met | p.T152M | P18847 | protein_coding | deleterious(0.02) | probably_damaging(0.996) | TCGA-2W-A8YY-01 | Cervix | cervical & endocervical cancer | Female | <65 | I/II | Chemotherapy | cisplatin | CR |
| ATF3 | SNV | Missense_Mutation | c.377C>T | p.Ala126Val | p.A126V | P18847 | protein_coding | tolerated(0.13) | benign(0.175) | TCGA-AA-3710-01 | Colorectum | colon adenocarcinoma | Female | >=65 | I/II | Unknown | Unknown | SD | |
| ATF3 | SNV | Missense_Mutation | novel | c.278G>A | p.Arg93Gln | p.R93Q | P18847 | protein_coding | tolerated(0.08) | possibly_damaging(0.634) | TCGA-AA-A00N-01 | Colorectum | colon adenocarcinoma | Male | >=65 | I/II | Unknown | Unknown | PD |
| ATF3 | SNV | Missense_Mutation | novel | c.284G>T | p.Arg95Ile | p.R95I | P18847 | protein_coding | deleterious(0) | possibly_damaging(0.848) | TCGA-F5-6814-01 | Colorectum | rectum adenocarcinoma | Male | <65 | I/II | Unknown | Unknown | SD |
| ATF3 | SNV | Missense_Mutation | novel | c.540N>T | p.Gln180His | p.Q180H | P18847 | protein_coding | deleterious_low_confidence(0.04) | possibly_damaging(0.867) | TCGA-A5-A0G2-01 | Endometrium | uterine corpus endometrioid carcinoma | Female | <65 | III/IV | Unknown | Unknown | SD |
| ATF3 | SNV | Missense_Mutation | c.505C>A | p.Leu169Ile | p.L169I | P18847 | protein_coding | tolerated(0.32) | probably_damaging(0.987) | TCGA-A5-A0GB-01 | Endometrium | uterine corpus endometrioid carcinoma | Female | >=65 | I/II | Unknown | Unknown | SD |
| Page: 1 2 3 |
Top |
Related drugs of malignant transformation related genes |
| Identification of chemicals and drugs interact with genes involved in malignant transfromation |
| (DGIdb 4.0) |
| Entrez ID | Symbol | Category | Interaction Types | Drug Claim Name | Drug Name | PMIDs |
| 467 | ATF3 | TRANSCRIPTION FACTOR | PROGESTERONE | PROGESTERONE | 15674352 |
| Page: 1 |

Copyright 2023-Present -The University of Texas Health Science Center at Houston |