
|
|||||
|
 | |
| |
| |
| |
| |
| |
|
Gene: ANG |
Gene summary for ANG |
| Gene information | Species | Human | Gene symbol | ANG | Gene ID | 283 |
| Gene name | angiogenin | |
| Gene Alias | ALS9 | |
| Cytomap | 14q11.2 | |
| Gene Type | protein-coding | GO ID | GO:0000003 | UniProtAcc | P03950 |
Top |
Malignant transformation analysis |
| Identification of the aberrant gene expression in precancerous and cancerous lesions by comparing the gene expression of stem-like cells in diseased tissues with normal stem cells |
| Entrez ID | Symbol | Replicates | Species | Organ | Tissue | Adj P-value | Log2FC | Malignancy |
| 283 | ANG | HTA11_3410_2000001011 | Human | Colorectum | AD | 1.41e-07 | 1.84e-01 | 0.0155 |
| 283 | ANG | HTA11_2487_2000001011 | Human | Colorectum | SER | 8.14e-15 | 4.33e-01 | -0.1808 |
| 283 | ANG | HTA11_1938_2000001011 | Human | Colorectum | AD | 3.84e-10 | 3.71e-01 | -0.0811 |
| 283 | ANG | HTA11_78_2000001011 | Human | Colorectum | AD | 2.54e-12 | 3.19e-01 | -0.1088 |
| 283 | ANG | HTA11_347_2000001011 | Human | Colorectum | AD | 1.18e-22 | 4.53e-01 | -0.1954 |
| 283 | ANG | HTA11_411_2000001011 | Human | Colorectum | SER | 3.33e-15 | 1.24e+00 | -0.2602 |
| 283 | ANG | HTA11_2112_2000001011 | Human | Colorectum | SER | 8.76e-08 | 6.35e-01 | -0.2196 |
| 283 | ANG | HTA11_3361_2000001011 | Human | Colorectum | AD | 7.49e-10 | 3.09e-01 | -0.1207 |
| 283 | ANG | HTA11_83_2000001011 | Human | Colorectum | SER | 1.12e-08 | 3.22e-01 | -0.1526 |
| 283 | ANG | HTA11_696_2000001011 | Human | Colorectum | AD | 5.54e-31 | 5.89e-01 | -0.1464 |
| 283 | ANG | HTA11_866_2000001011 | Human | Colorectum | AD | 1.42e-14 | 3.27e-01 | -0.1001 |
| 283 | ANG | HTA11_1391_2000001011 | Human | Colorectum | AD | 5.65e-19 | 4.31e-01 | -0.059 |
| 283 | ANG | HTA11_2992_2000001011 | Human | Colorectum | SER | 1.72e-05 | 3.79e-01 | -0.1706 |
| 283 | ANG | HTA11_5212_2000001011 | Human | Colorectum | AD | 2.47e-14 | 5.15e-01 | -0.2061 |
| 283 | ANG | HTA11_5216_2000001011 | Human | Colorectum | SER | 3.40e-02 | 2.52e-01 | -0.1462 |
| 283 | ANG | HTA11_546_2000001011 | Human | Colorectum | AD | 1.43e-09 | 3.74e-01 | -0.0842 |
| 283 | ANG | HTA11_7862_2000001011 | Human | Colorectum | AD | 3.08e-04 | 1.98e-01 | -0.0179 |
| 283 | ANG | HTA11_866_3004761011 | Human | Colorectum | AD | 3.29e-15 | 2.98e-01 | 0.096 |
| 283 | ANG | HTA11_4255_2000001011 | Human | Colorectum | SER | 2.49e-08 | 4.15e-01 | 0.0446 |
| 283 | ANG | HTA11_8622_2000001021 | Human | Colorectum | SER | 3.19e-02 | 2.05e-01 | 0.0528 |
| Page: 1 2 3 4 |
| Tissue | Expression Dynamics | Abbreviation |
| Colorectum (GSE201348) |  | FAP: Familial adenomatous polyposis |
| CRC: Colorectal cancer | ||
| Colorectum (HTA11) |  | AD: Adenomas |
| SER: Sessile serrated lesions | ||
| MSI-H: Microsatellite-high colorectal cancer | ||
| MSS: Microsatellite stable colorectal cancer | ||
| Esophagus | 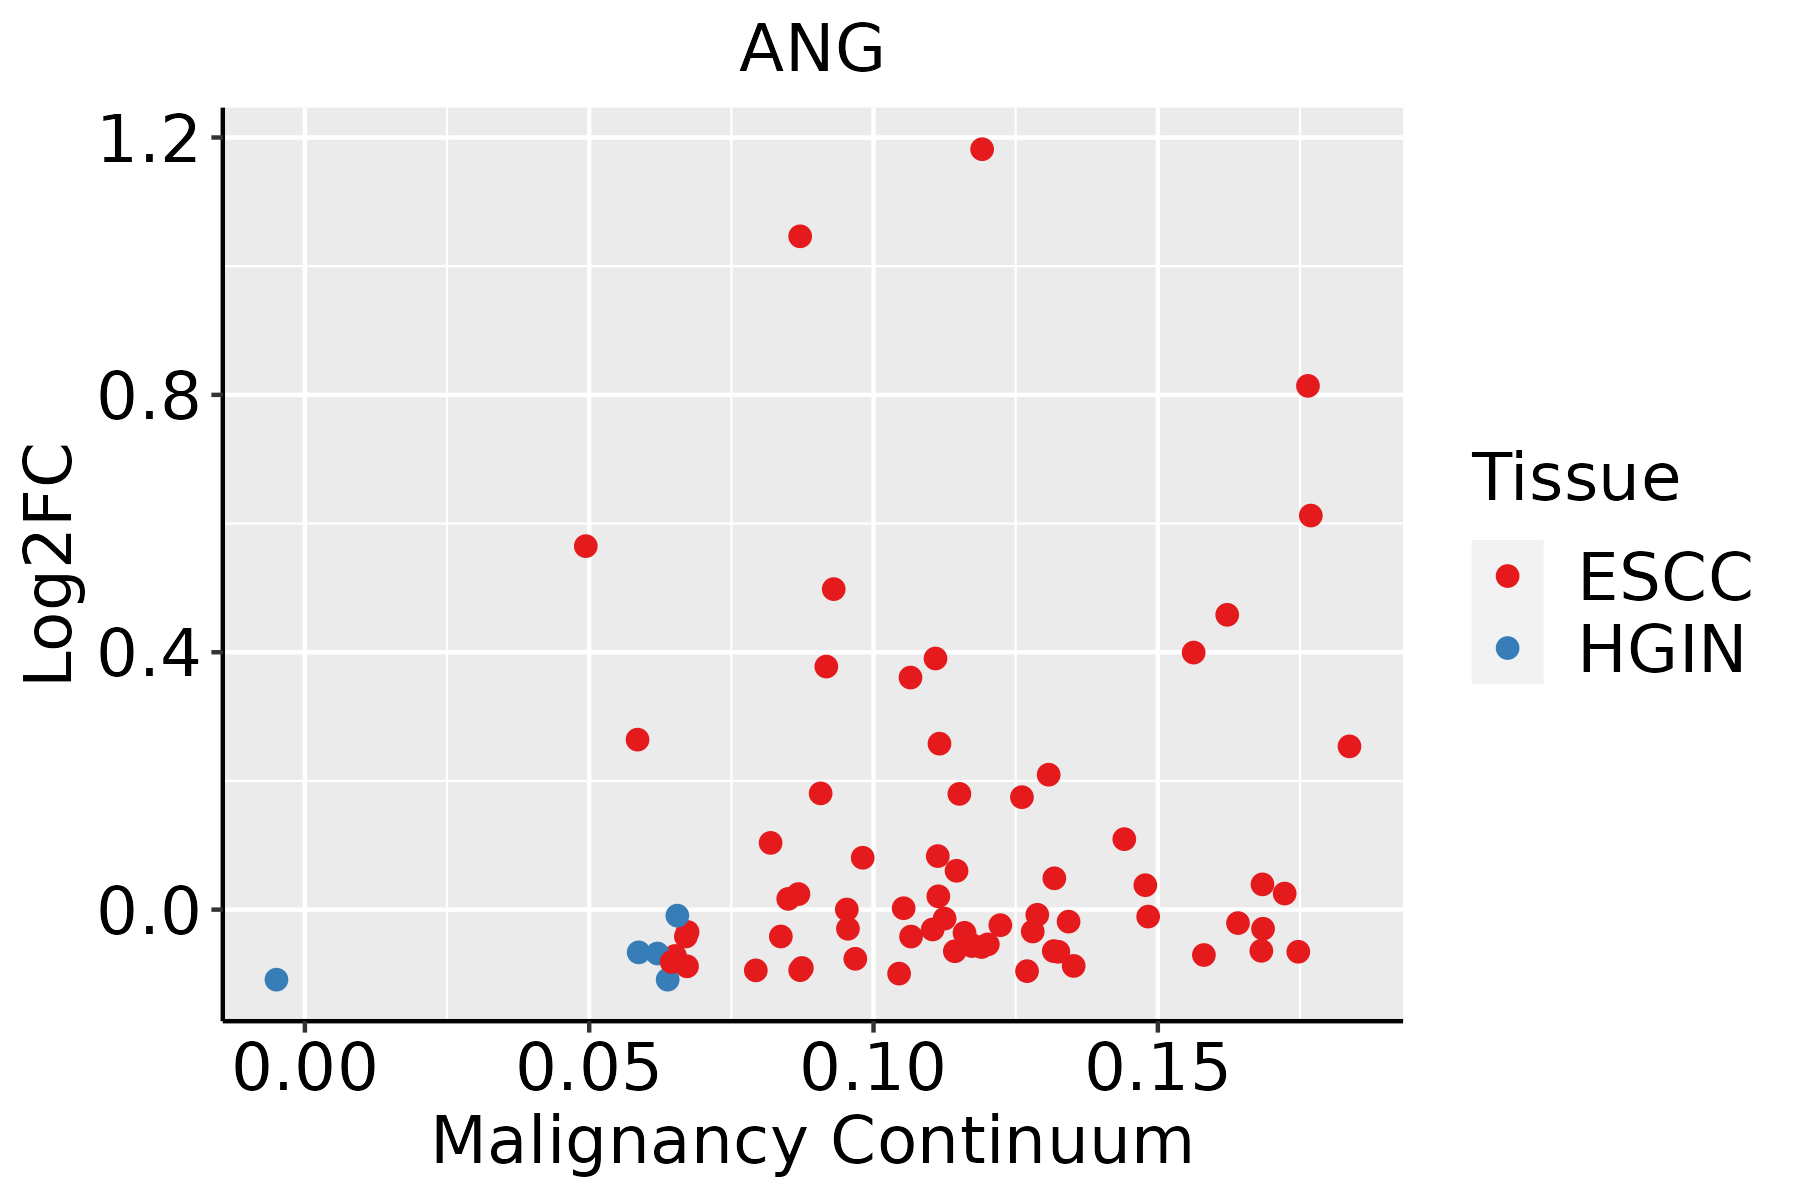 | ESCC: Esophageal squamous cell carcinoma |
| HGIN: High-grade intraepithelial neoplasias | ||
| LGIN: Low-grade intraepithelial neoplasias | ||
| Liver | 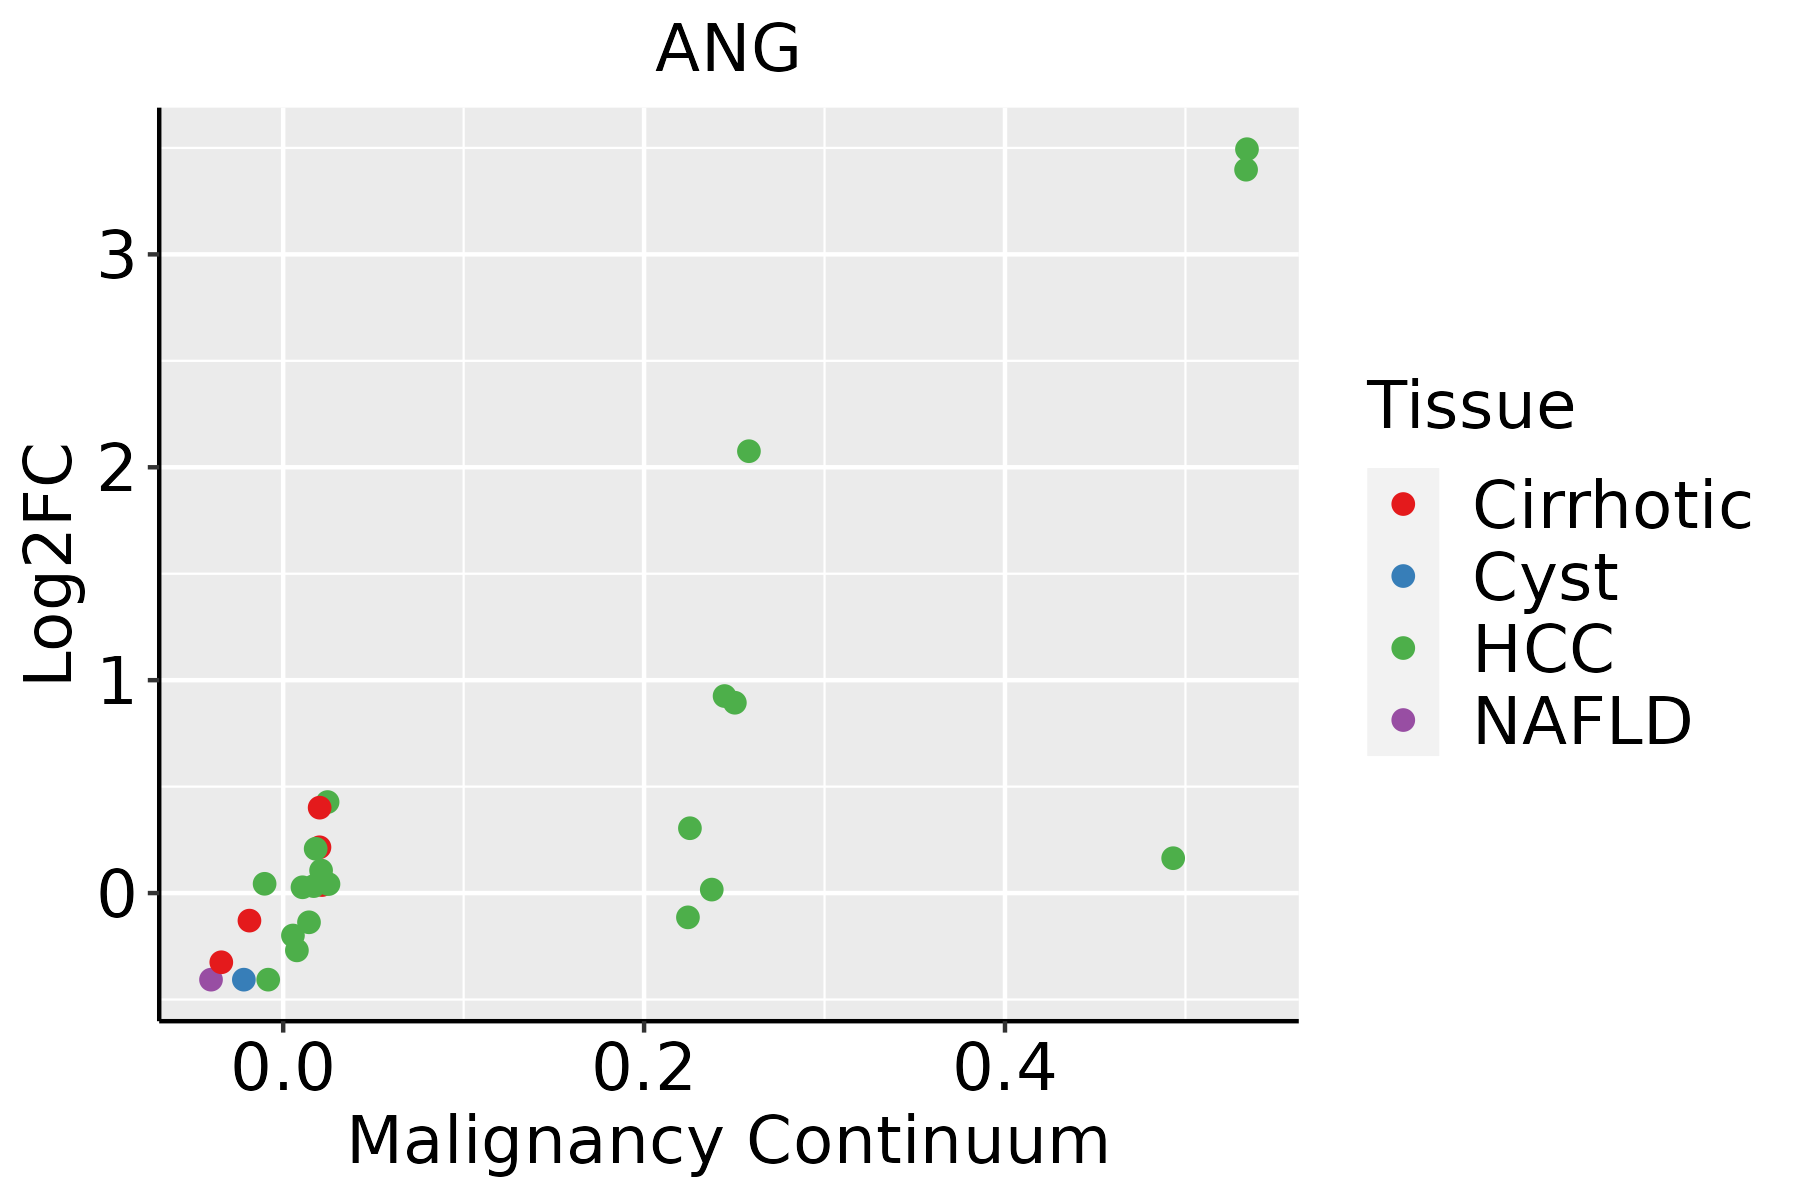 | HCC: Hepatocellular carcinoma |
| NAFLD: Non-alcoholic fatty liver disease |
| ∗log2FC in expression of this searched gene in stem-like cells from each diseased tissue sample relative to stem-like cells in normal samples in each tissue plotted against the malignancy continuum. Samples are colored based on if they are from different disease stage. |
Top |
Malignant transformation related pathway analysis |
| Find out the enriched GO biological processes and KEGG pathways involved in transition from healthy to precancer to cancer |
| Tissue | Disease Stage | Enriched GO biological Processes |
| Colorectum | AD |  |
| Colorectum | SER |  |
| Colorectum | MSS |  |
| Colorectum | MSI-H |  |
| Colorectum | FAP |  |
| ∗Top 15 enriched GO BP terms are showed in the bar plot of each disease state in each tissue. Each row represents a significant GO biological process which is colored according to the -log10(p.adjust). |
| Page: 1 2 3 4 5 6 7 8 9 |
| GO ID | Tissue | Disease Stage | Description | Gene Ratio | Bg Ratio | pvalue | p.adjust | Count |
| GO:00310992 | Liver | HCC | regeneration | 107/7958 | 198/18723 | 6.67e-04 | 4.12e-03 | 107 |
| GO:001714821 | Liver | HCC | negative regulation of translation | 129/7958 | 245/18723 | 8.14e-04 | 4.87e-03 | 129 |
| GO:00323871 | Liver | HCC | negative regulation of intracellular transport | 37/7958 | 58/18723 | 8.64e-04 | 5.13e-03 | 37 |
| GO:000716021 | Liver | HCC | cell-matrix adhesion | 123/7958 | 233/18723 | 9.34e-04 | 5.47e-03 | 123 |
| GO:004586021 | Liver | HCC | positive regulation of protein kinase activity | 194/7958 | 386/18723 | 1.16e-03 | 6.54e-03 | 194 |
| GO:000663911 | Liver | HCC | acylglycerol metabolic process | 72/7958 | 128/18723 | 1.16e-03 | 6.54e-03 | 72 |
| GO:007259511 | Liver | HCC | maintenance of protein localization in organelle | 28/7958 | 42/18723 | 1.35e-03 | 7.26e-03 | 28 |
| GO:00454441 | Liver | HCC | fat cell differentiation | 120/7958 | 229/18723 | 1.52e-03 | 8.05e-03 | 120 |
| GO:000663811 | Liver | HCC | neutral lipid metabolic process | 72/7958 | 129/18723 | 1.54e-03 | 8.14e-03 | 72 |
| GO:190236921 | Liver | HCC | negative regulation of RNA catabolic process | 45/7958 | 75/18723 | 1.67e-03 | 8.73e-03 | 45 |
| GO:003367411 | Liver | HCC | positive regulation of kinase activity | 230/7958 | 467/18723 | 1.72e-03 | 8.95e-03 | 230 |
| GO:00016553 | Liver | HCC | urogenital system development | 170/7958 | 338/18723 | 2.15e-03 | 1.08e-02 | 170 |
| GO:00096124 | Liver | HCC | response to mechanical stimulus | 113/7958 | 216/18723 | 2.20e-03 | 1.10e-02 | 113 |
| GO:00148231 | Liver | HCC | response to activity | 45/7958 | 76/18723 | 2.42e-03 | 1.18e-02 | 45 |
| GO:004578512 | Liver | HCC | positive regulation of cell adhesion | 215/7958 | 437/18723 | 2.53e-03 | 1.22e-02 | 215 |
| GO:19049501 | Liver | HCC | negative regulation of establishment of protein localization | 72/7958 | 131/18723 | 2.65e-03 | 1.27e-02 | 72 |
| GO:00093146 | Liver | HCC | response to radiation | 223/7958 | 456/18723 | 3.08e-03 | 1.43e-02 | 223 |
| GO:00072292 | Liver | HCC | integrin-mediated signaling pathway | 60/7958 | 107/18723 | 3.15e-03 | 1.46e-02 | 60 |
| GO:00018222 | Liver | HCC | kidney development | 148/7958 | 293/18723 | 3.25e-03 | 1.49e-02 | 148 |
| GO:004348921 | Liver | HCC | RNA stabilization | 39/7958 | 65/18723 | 3.31e-03 | 1.51e-02 | 39 |
| Page: 1 2 3 4 5 6 7 8 9 10 11 12 13 14 15 16 17 18 19 20 21 22 23 24 25 26 27 28 29 30 31 32 33 34 35 36 37 38 39 40 41 42 43 44 45 46 47 48 49 50 |
| Pathway ID | Tissue | Disease Stage | Description | Gene Ratio | Bg Ratio | pvalue | p.adjust | qvalue | Count |
| hsa05014 | Colorectum | AD | Amyotrophic lateral sclerosis | 164/2092 | 364/8465 | 4.28e-18 | 1.27e-16 | 8.09e-17 | 164 |
| hsa050141 | Colorectum | AD | Amyotrophic lateral sclerosis | 164/2092 | 364/8465 | 4.28e-18 | 1.27e-16 | 8.09e-17 | 164 |
| hsa050142 | Colorectum | SER | Amyotrophic lateral sclerosis | 138/1580 | 364/8465 | 9.89e-19 | 2.99e-17 | 2.17e-17 | 138 |
| hsa050143 | Colorectum | SER | Amyotrophic lateral sclerosis | 138/1580 | 364/8465 | 9.89e-19 | 2.99e-17 | 2.17e-17 | 138 |
| hsa050144 | Colorectum | MSS | Amyotrophic lateral sclerosis | 156/1875 | 364/8465 | 1.43e-19 | 4.62e-18 | 2.83e-18 | 156 |
| hsa050145 | Colorectum | MSS | Amyotrophic lateral sclerosis | 156/1875 | 364/8465 | 1.43e-19 | 4.62e-18 | 2.83e-18 | 156 |
| hsa050146 | Colorectum | MSI-H | Amyotrophic lateral sclerosis | 95/797 | 364/8465 | 2.31e-21 | 1.50e-19 | 1.26e-19 | 95 |
| hsa050147 | Colorectum | MSI-H | Amyotrophic lateral sclerosis | 95/797 | 364/8465 | 2.31e-21 | 1.50e-19 | 1.26e-19 | 95 |
| hsa05014210 | Esophagus | ESCC | Amyotrophic lateral sclerosis | 266/4205 | 364/8465 | 1.31e-20 | 2.20e-18 | 1.13e-18 | 266 |
| hsa0501438 | Esophagus | ESCC | Amyotrophic lateral sclerosis | 266/4205 | 364/8465 | 1.31e-20 | 2.20e-18 | 1.13e-18 | 266 |
| hsa0501414 | Liver | Cirrhotic | Amyotrophic lateral sclerosis | 187/2530 | 364/8465 | 1.56e-18 | 6.50e-17 | 4.01e-17 | 187 |
| hsa0501415 | Liver | Cirrhotic | Amyotrophic lateral sclerosis | 187/2530 | 364/8465 | 1.56e-18 | 6.50e-17 | 4.01e-17 | 187 |
| hsa0501422 | Liver | HCC | Amyotrophic lateral sclerosis | 252/4020 | 364/8465 | 8.85e-18 | 7.41e-16 | 4.12e-16 | 252 |
| hsa0501432 | Liver | HCC | Amyotrophic lateral sclerosis | 252/4020 | 364/8465 | 8.85e-18 | 7.41e-16 | 4.12e-16 | 252 |
| Page: 1 |
Top |
Cell-cell communication analysis |
| Identification of potential cell-cell interactions between two cell types and their ligand-receptor pairs for different disease states |
| Ligand | Receptor | LRpair | Pathway | Tissue | Disease Stage |
| Page: 1 |
Top |
Single-cell gene regulatory network inference analysis |
| Find out the significant the regulons (TFs) and the target genes of each regulon across cell types for different disease states |
| TF | Cell Type | Tissue | Disease Stage | Target Gene | RSS | Regulon Activity |
| ∗The dot plots of a searched regulon are shown for all cell subpopulations in each disease state of each tissue based on the regulon specific score inferred using pySCENIC and by calculating the average expression. |
| Page: 1 |
Top |
Somatic mutation of malignant transformation related genes |
| Annotation of somatic variants for genes involved in malignant transformation |
| Hugo Symbol | Variant Class | Variant Classification | dbSNP RS | HGVSc | HGVSp | HGVSp Short | SWISSPROT | BIOTYPE | SIFT | PolyPhen | Tumor Sample Barcode | Tissue | Histology | Sex | Age | Stage | Therapy Types | Drugs | Outcome |
| ANG | SNV | Missense_Mutation | c.265C>G | p.His89Asp | p.H89D | P03950 | protein_coding | deleterious(0) | benign(0.003) | TCGA-C5-A8XH-01 | Cervix | cervical & endocervical cancer | Female | <65 | I/II | Unknown | Unknown | SD | |
| ANG | SNV | Missense_Mutation | rs141398857 | c.356N>A | p.Arg119Gln | p.R119Q | P03950 | protein_coding | deleterious(0.01) | possibly_damaging(0.463) | TCGA-AA-3984-01 | Colorectum | colon adenocarcinoma | Female | <65 | I/II | Unknown | Unknown | SD |
| ANG | SNV | Missense_Mutation | rs146485834 | c.224G>A | p.Arg75His | p.R75H | P03950 | protein_coding | tolerated(0.1) | benign(0.015) | TCGA-A5-A2K5-01 | Endometrium | uterine corpus endometrioid carcinoma | Female | >=65 | I/II | Unknown | Unknown | SD |
| ANG | SNV | Missense_Mutation | novel | c.269N>T | p.Arg90Ile | p.R90I | P03950 | protein_coding | tolerated(0.17) | benign(0.078) | TCGA-AP-A059-01 | Endometrium | uterine corpus endometrioid carcinoma | Female | >=65 | I/II | Unknown | Unknown | SD |
| ANG | SNV | Missense_Mutation | novel | c.133N>T | p.Arg45Trp | p.R45W | P03950 | protein_coding | tolerated(0.08) | benign(0.139) | TCGA-AX-A2HD-01 | Endometrium | uterine corpus endometrioid carcinoma | Female | >=65 | III/IV | Unknown | Unknown | SD |
| ANG | SNV | Missense_Mutation | novel | c.103N>G | p.Thr35Ala | p.T35A | P03950 | protein_coding | tolerated(0.75) | benign(0) | TCGA-B5-A1MX-01 | Endometrium | uterine corpus endometrioid carcinoma | Female | <65 | I/II | Hormone Therapy | megace | SD |
| ANG | SNV | Missense_Mutation | c.19G>A | p.Val7Ile | p.V7I | P03950 | protein_coding | tolerated(0.2) | benign(0.011) | TCGA-BS-A0UM-01 | Endometrium | uterine corpus endometrioid carcinoma | Female | <65 | I/II | Chemotherapy | adriamycin | SD | |
| ANG | SNV | Missense_Mutation | novel | c.323N>T | p.His108Leu | p.H108L | P03950 | protein_coding | tolerated(0.55) | benign(0.012) | TCGA-DD-AAE9-01 | Liver | liver hepatocellular carcinoma | Male | >=65 | I/II | Unknown | Unknown | SD |
| ANG | SNV | Missense_Mutation | novel | c.302N>T | p.Gln101Leu | p.Q101L | P03950 | protein_coding | deleterious(0.03) | possibly_damaging(0.645) | TCGA-77-8154-01 | Lung | lung squamous cell carcinoma | Male | >=65 | I/II | Unknown | Unknown | SD |
| Page: 1 |
Top |
Related drugs of malignant transformation related genes |
| Identification of chemicals and drugs interact with genes involved in malignant transfromation |
| (DGIdb 4.0) |
| Entrez ID | Symbol | Category | Interaction Types | Drug Claim Name | Drug Name | PMIDs |
| Page: 1 |

Copyright 2023-Present -The University of Texas Health Science Center at Houston |