
|
|||||
|
 | |
| |
| |
| |
| |
| |
|
Gene: SOS1 |
Gene summary for SOS1 |
| Gene information | Species | Human | Gene symbol | SOS1 | Gene ID | 6654 |
| Gene name | SOS Ras/Rac guanine nucleotide exchange factor 1 | |
| Gene Alias | GF1 | |
| Cytomap | 2p22.1 | |
| Gene Type | protein-coding | GO ID | GO:0000003 | UniProtAcc | Q07889 |
Top |
Malignant transformation analysis |
| Identification of the aberrant gene expression in precancerous and cancerous lesions by comparing the gene expression of stem-like cells in diseased tissues with normal stem cells |
| Entrez ID | Symbol | Replicates | Species | Organ | Tissue | Adj P-value | Log2FC | Malignancy |
| 6654 | SOS1 | CCI_1 | Human | Cervix | CC | 1.84e-05 | 1.14e+00 | 0.528 |
| 6654 | SOS1 | CCI_2 | Human | Cervix | CC | 8.82e-14 | 1.52e+00 | 0.5249 |
| 6654 | SOS1 | CCI_3 | Human | Cervix | CC | 8.21e-15 | 9.67e-01 | 0.516 |
| 6654 | SOS1 | HTA11_3410_2000001011 | Human | Colorectum | AD | 1.20e-24 | -6.35e-01 | 0.0155 |
| 6654 | SOS1 | HTA11_2951_2000001011 | Human | Colorectum | AD | 5.97e-05 | -6.82e-01 | 0.0216 |
| 6654 | SOS1 | HTA11_347_2000001011 | Human | Colorectum | AD | 6.65e-03 | 4.39e-01 | -0.1954 |
| 6654 | SOS1 | HTA11_3361_2000001011 | Human | Colorectum | AD | 3.96e-02 | -4.07e-01 | -0.1207 |
| 6654 | SOS1 | HTA11_9408_2000001011 | Human | Colorectum | AD | 3.04e-02 | -6.04e-01 | 0.0451 |
| 6654 | SOS1 | HTA11_8622_2000001021 | Human | Colorectum | SER | 1.00e-04 | -3.24e-01 | 0.0528 |
| 6654 | SOS1 | HTA11_99999970781_79442 | Human | Colorectum | MSS | 3.22e-02 | -2.04e-01 | 0.294 |
| 6654 | SOS1 | HTA11_99999965062_69753 | Human | Colorectum | MSI-H | 1.48e-03 | 7.77e-01 | 0.3487 |
| 6654 | SOS1 | HTA11_99999974143_84620 | Human | Colorectum | MSS | 2.83e-07 | -3.96e-01 | 0.3005 |
| 6654 | SOS1 | F007 | Human | Colorectum | FAP | 4.05e-02 | -2.61e-01 | 0.1176 |
| 6654 | SOS1 | A001-C-207 | Human | Colorectum | FAP | 4.50e-05 | -2.67e-01 | 0.1278 |
| 6654 | SOS1 | A015-C-203 | Human | Colorectum | FAP | 1.40e-37 | -5.92e-01 | -0.1294 |
| 6654 | SOS1 | A015-C-204 | Human | Colorectum | FAP | 1.12e-11 | -4.84e-01 | -0.0228 |
| 6654 | SOS1 | A014-C-040 | Human | Colorectum | FAP | 1.71e-06 | -4.92e-01 | -0.1184 |
| 6654 | SOS1 | A002-C-201 | Human | Colorectum | FAP | 3.40e-22 | -5.24e-01 | 0.0324 |
| 6654 | SOS1 | A001-C-119 | Human | Colorectum | FAP | 3.30e-18 | -7.46e-01 | -0.1557 |
| 6654 | SOS1 | A001-C-108 | Human | Colorectum | FAP | 1.95e-23 | -4.59e-01 | -0.0272 |
| Page: 1 2 3 4 5 6 7 |
| Tissue | Expression Dynamics | Abbreviation |
| Cervix |  | CC: Cervix cancer |
| HSIL_HPV: HPV-infected high-grade squamous intraepithelial lesions | ||
| N_HPV: HPV-infected normal cervix | ||
| Colorectum (GSE201348) | 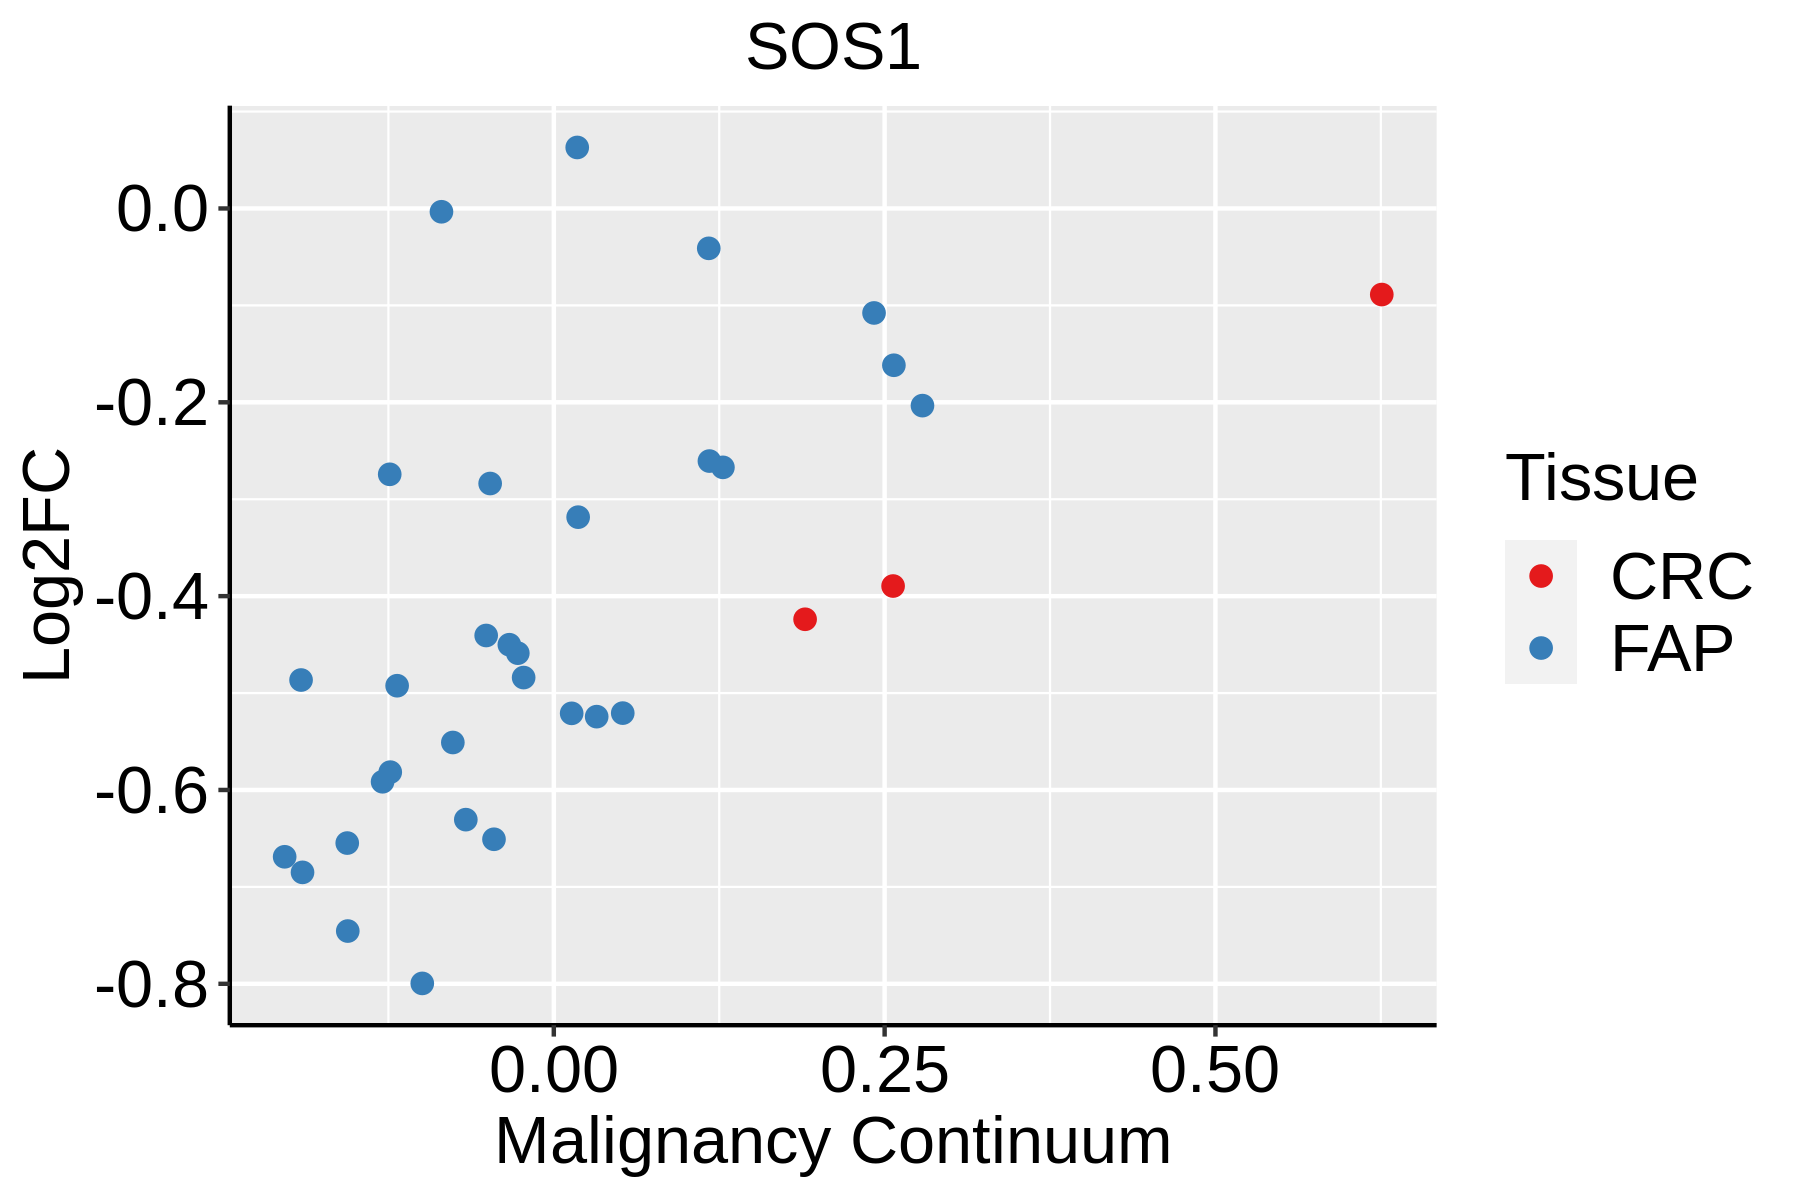 | FAP: Familial adenomatous polyposis |
| CRC: Colorectal cancer | ||
| Colorectum (HTA11) |  | AD: Adenomas |
| SER: Sessile serrated lesions | ||
| MSI-H: Microsatellite-high colorectal cancer | ||
| MSS: Microsatellite stable colorectal cancer | ||
| Endometrium | 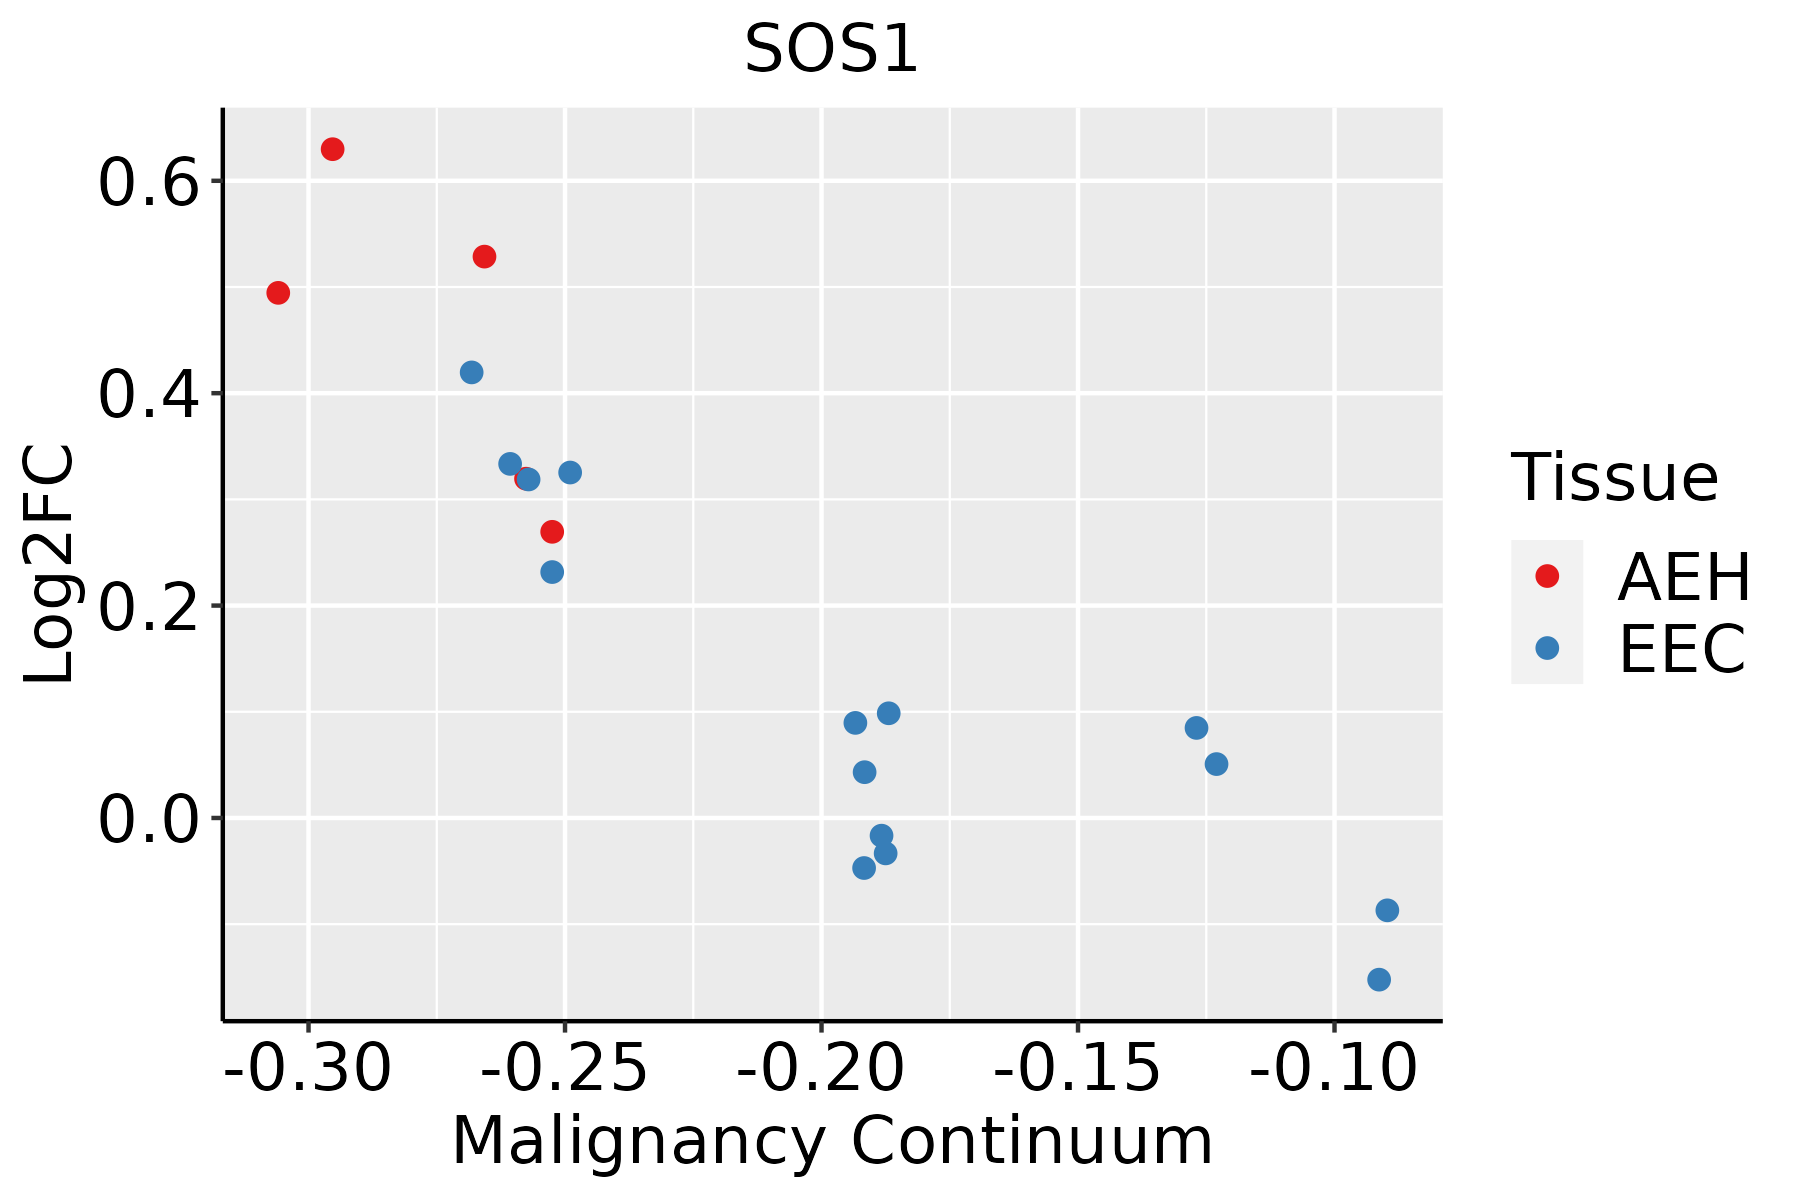 | AEH: Atypical endometrial hyperplasia |
| EEC: Endometrioid Cancer | ||
| Liver |  | HCC: Hepatocellular carcinoma |
| NAFLD: Non-alcoholic fatty liver disease | ||
| Lung | 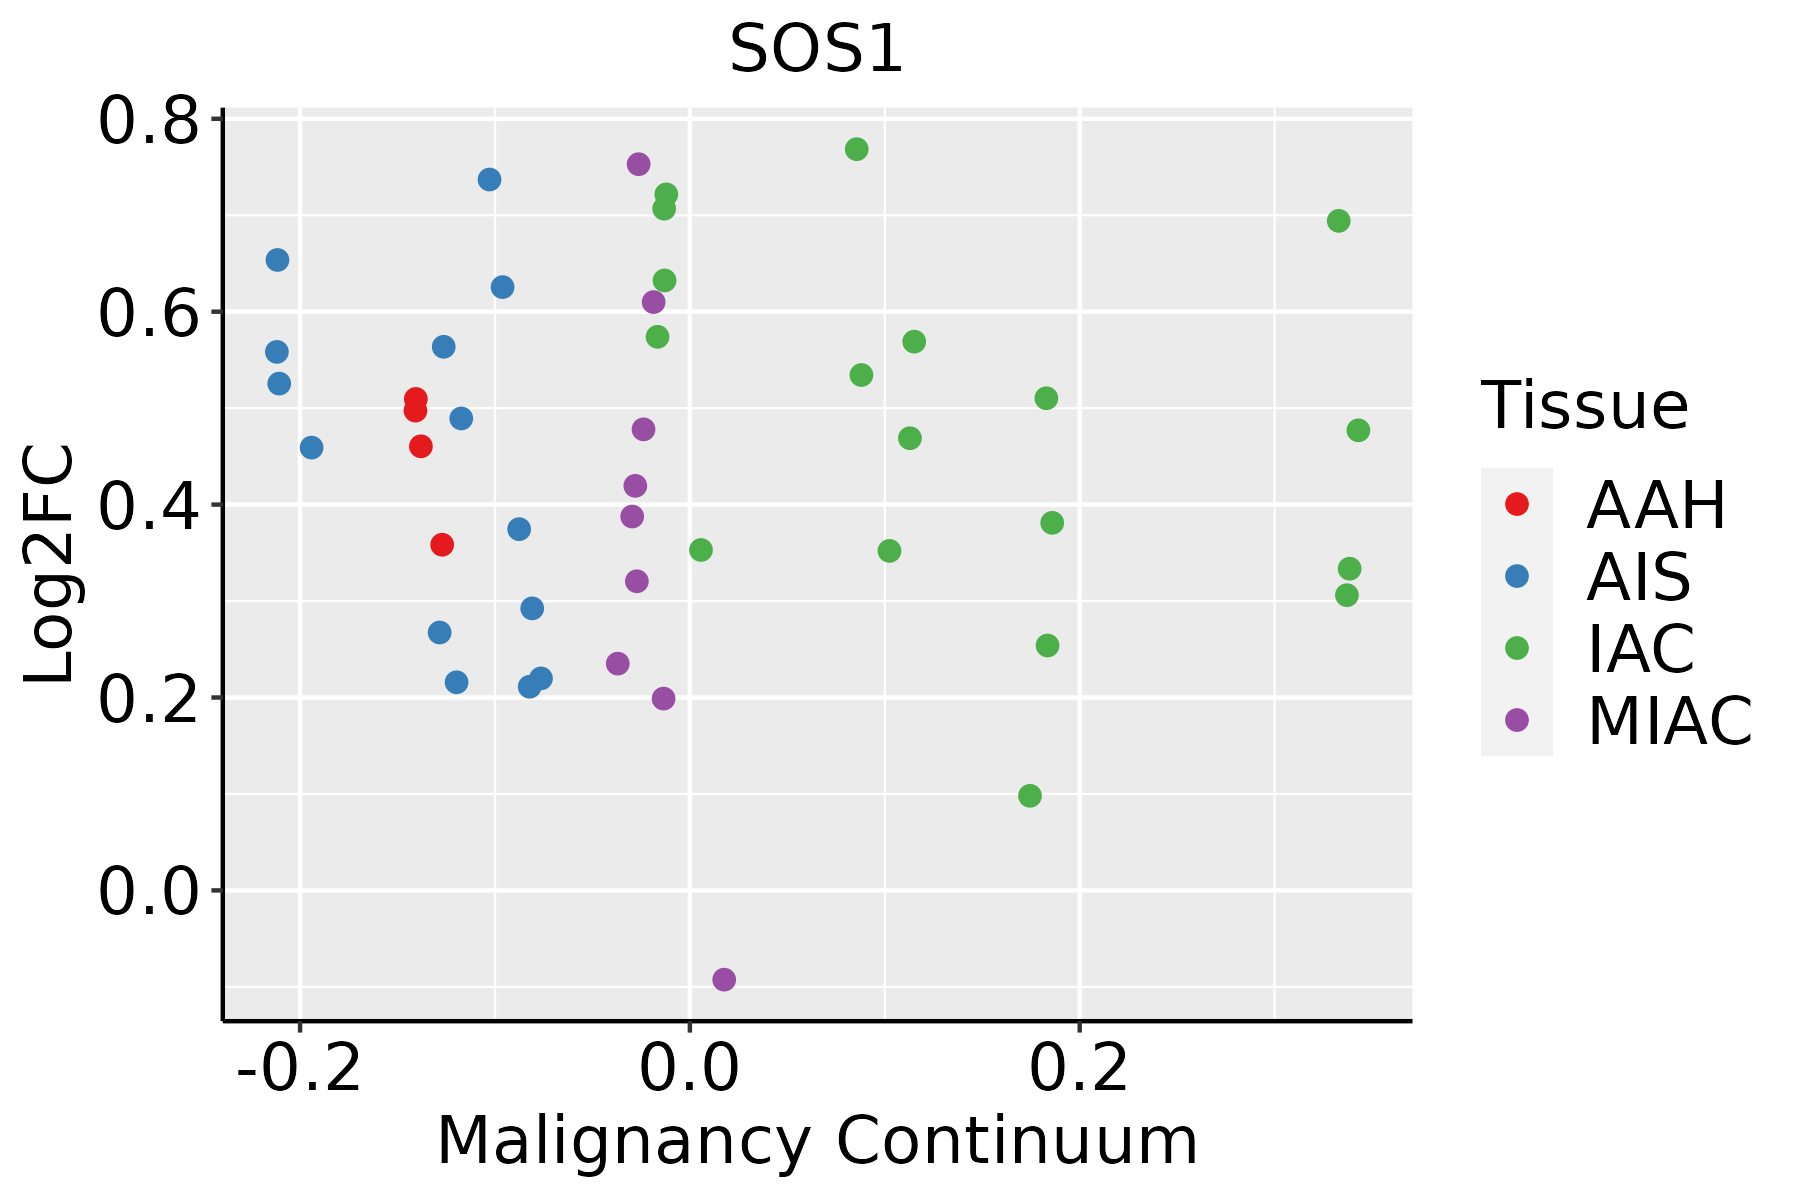 | AAH: Atypical adenomatous hyperplasia |
| AIS: Adenocarcinoma in situ | ||
| IAC: Invasive lung adenocarcinoma | ||
| MIA: Minimally invasive adenocarcinoma | ||
| Oral Cavity | 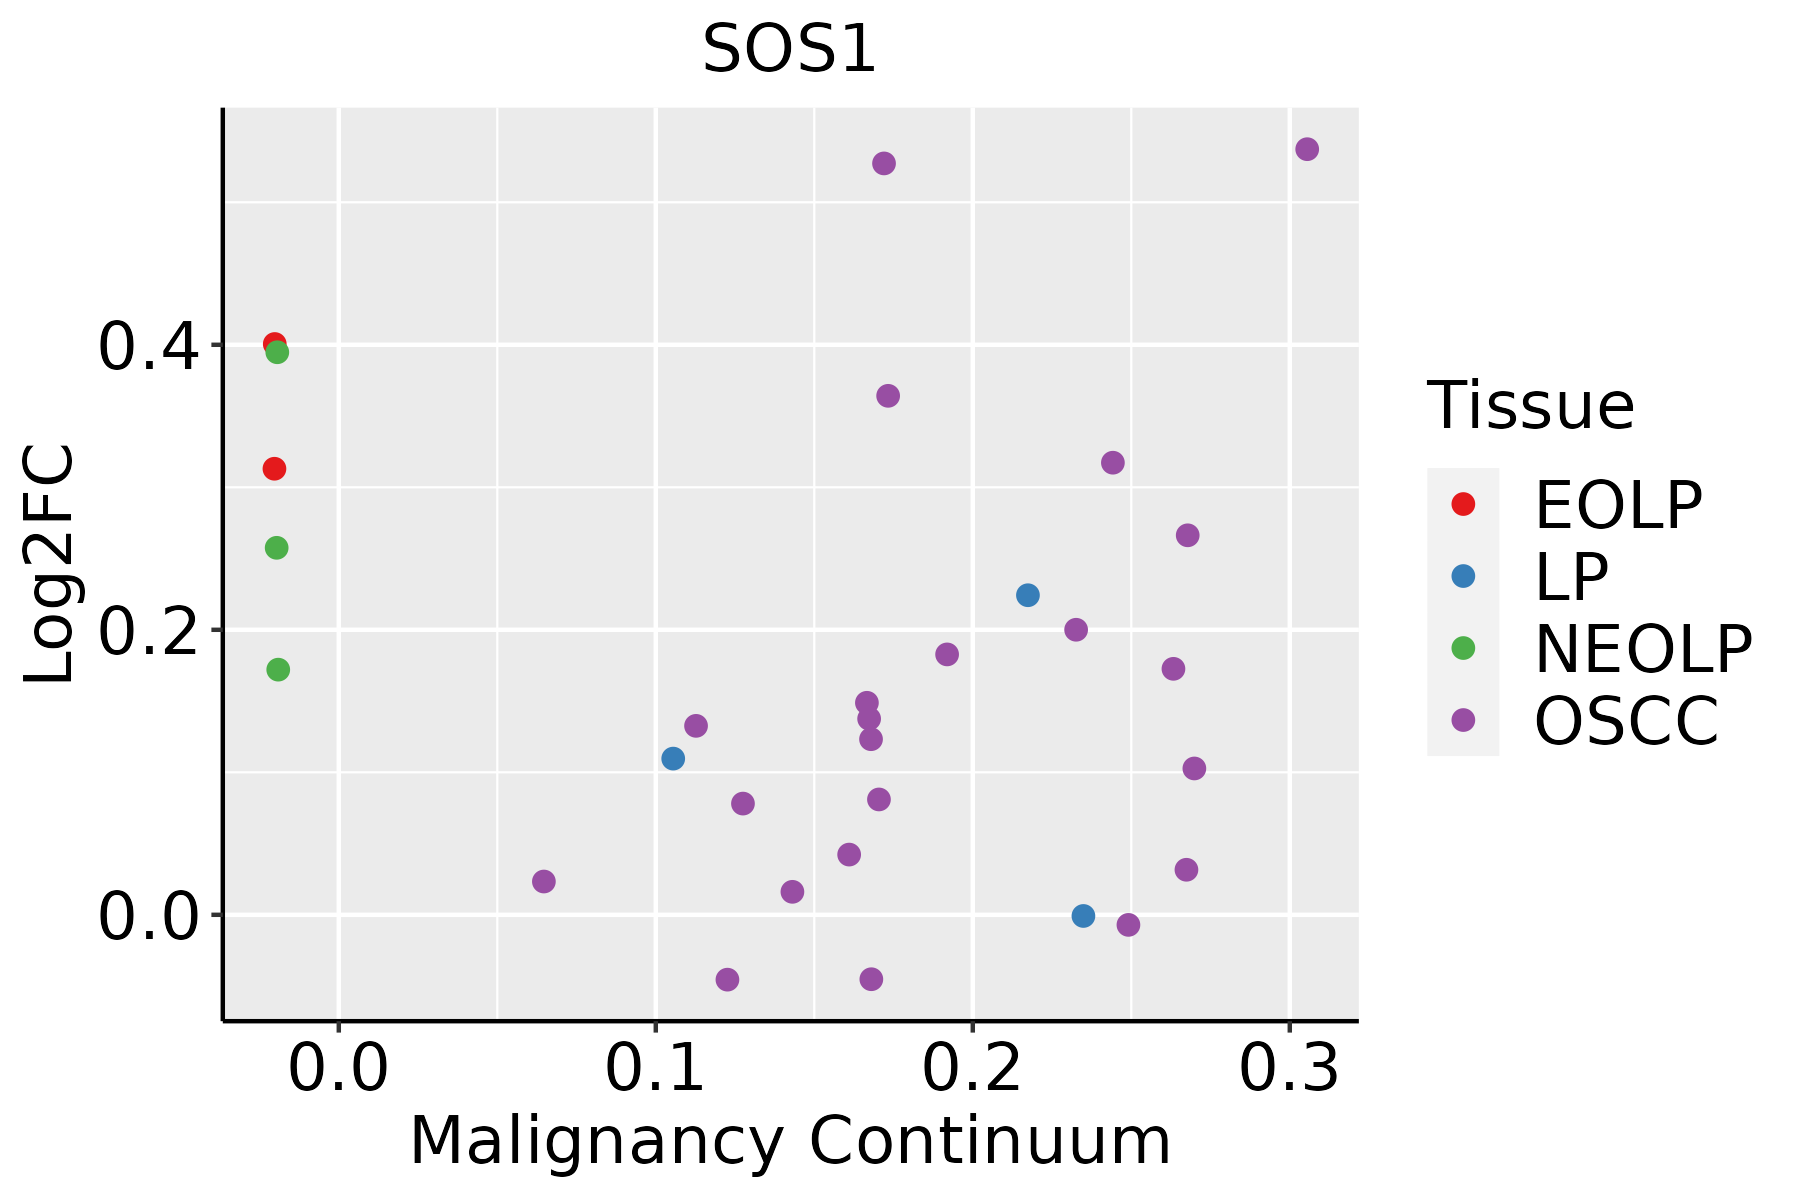 | EOLP: Erosive Oral lichen planus |
| LP: leukoplakia | ||
| NEOLP: Non-erosive oral lichen planus | ||
| OSCC: Oral squamous cell carcinoma | ||
| Prostate | 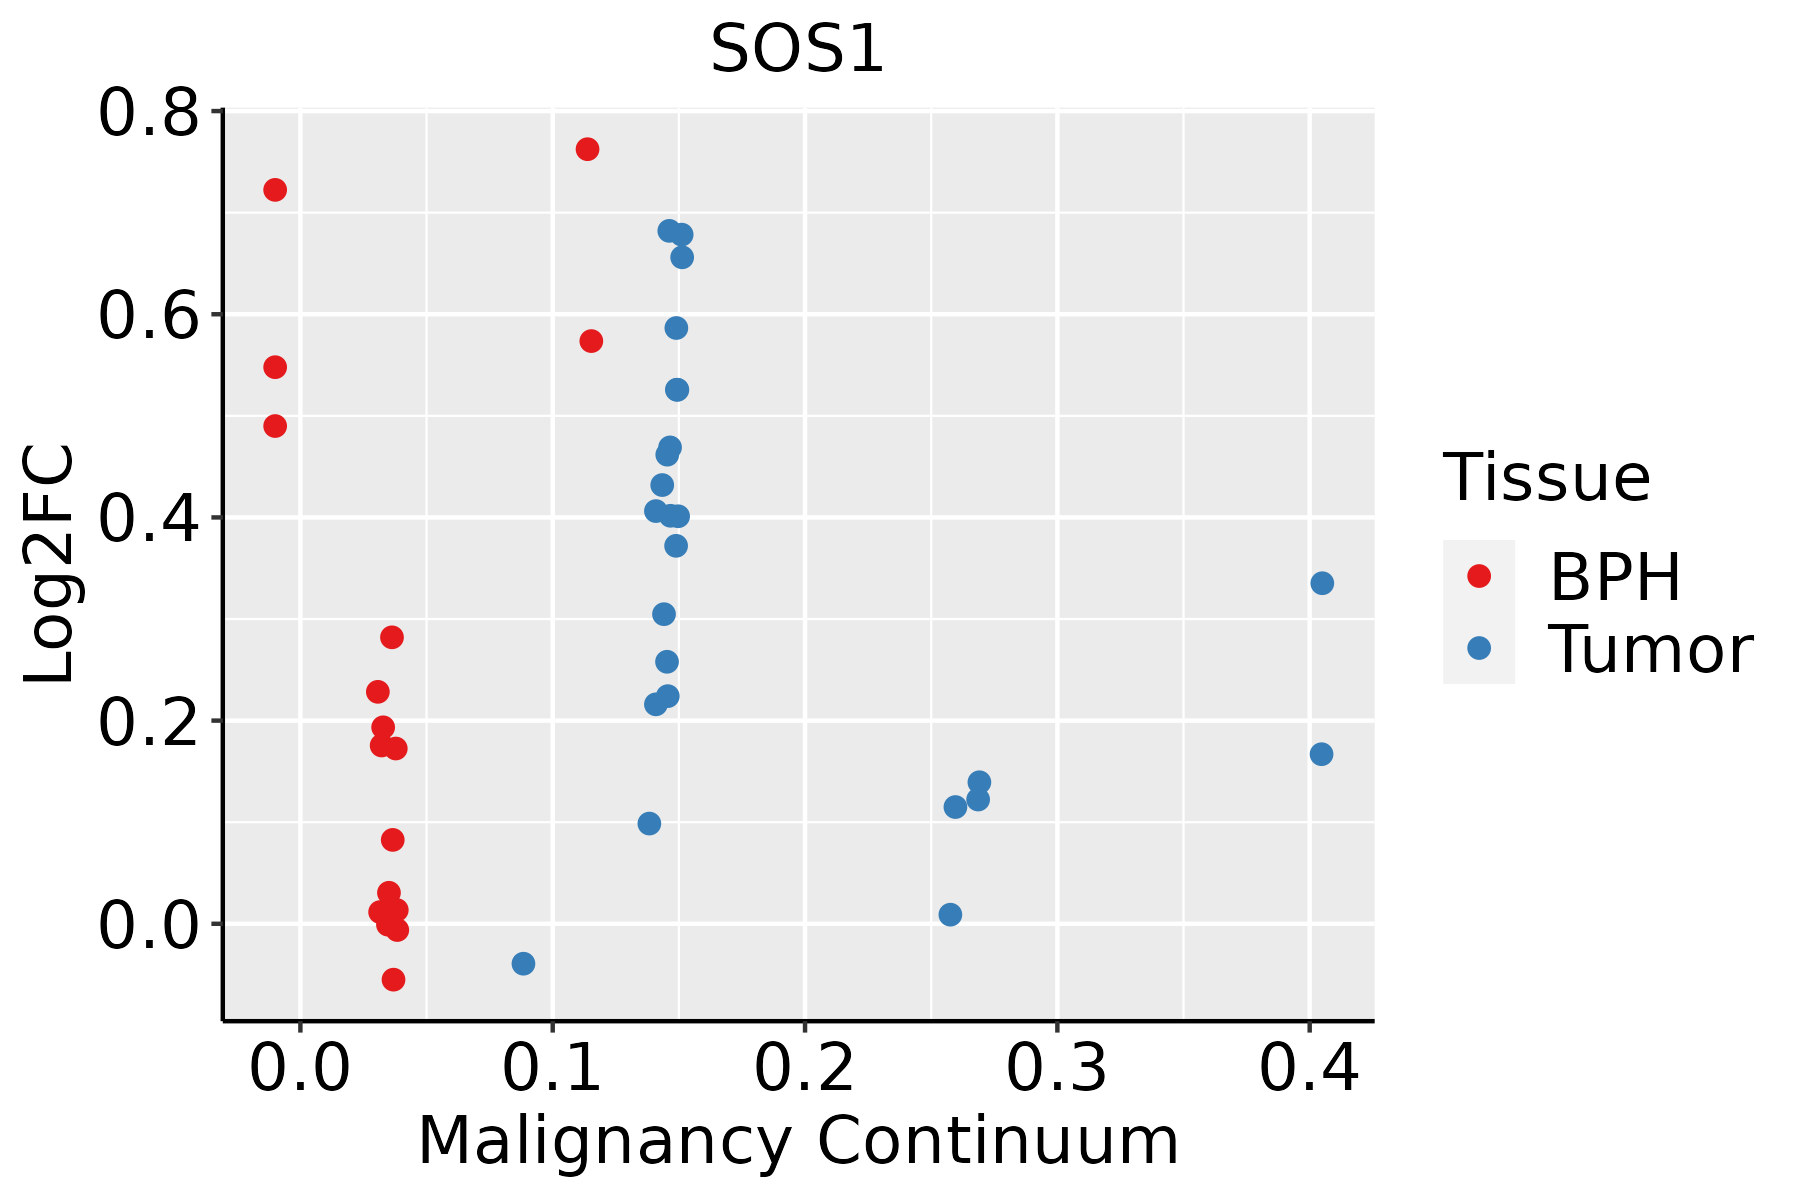 | BPH: Benign Prostatic Hyperplasia |
| Skin |  | AK: Actinic keratosis |
| cSCC: Cutaneous squamous cell carcinoma | ||
| SCCIS:squamous cell carcinoma in situ | ||
| Thyroid |  | ATC: Anaplastic thyroid cancer |
| HT: Hashimoto's thyroiditis | ||
| PTC: Papillary thyroid cancer |
| ∗log2FC in expression of this searched gene in stem-like cells from each diseased tissue sample relative to stem-like cells in normal samples in each tissue plotted against the malignancy continuum. Samples are colored based on if they are from different disease stage. |
Top |
Malignant transformation related pathway analysis |
| Find out the enriched GO biological processes and KEGG pathways involved in transition from healthy to precancer to cancer |
| Tissue | Disease Stage | Enriched GO biological Processes |
| Colorectum | AD |  |
| Colorectum | SER |  |
| Colorectum | MSS |  |
| Colorectum | MSI-H |  |
| Colorectum | FAP |  |
| ∗Top 15 enriched GO BP terms are showed in the bar plot of each disease state in each tissue. Each row represents a significant GO biological process which is colored according to the -log10(p.adjust). |
| Page: 1 2 3 4 5 6 7 8 9 |
| GO ID | Tissue | Disease Stage | Description | Gene Ratio | Bg Ratio | pvalue | p.adjust | Count |
| GO:000740918 | Thyroid | PTC | axonogenesis | 178/5968 | 418/18723 | 2.17e-06 | 2.91e-05 | 178 |
| GO:005105617 | Thyroid | PTC | regulation of small GTPase mediated signal transduction | 132/5968 | 302/18723 | 9.26e-06 | 1.04e-04 | 132 |
| GO:0030901111 | Thyroid | PTC | midbrain development | 48/5968 | 90/18723 | 1.95e-05 | 1.99e-04 | 48 |
| GO:190118410 | Thyroid | PTC | regulation of ERBB signaling pathway | 41/5968 | 79/18723 | 1.70e-04 | 1.31e-03 | 41 |
| GO:004205810 | Thyroid | PTC | regulation of epidermal growth factor receptor signaling pathway | 38/5968 | 73/18723 | 2.69e-04 | 1.91e-03 | 38 |
| GO:00020117 | Thyroid | PTC | morphogenesis of an epithelial sheet | 31/5968 | 57/18723 | 3.54e-04 | 2.43e-03 | 31 |
| GO:00032055 | Thyroid | PTC | cardiac chamber development | 72/5968 | 161/18723 | 4.13e-04 | 2.77e-03 | 72 |
| GO:19015325 | Thyroid | PTC | regulation of hematopoietic progenitor cell differentiation | 18/5968 | 32/18723 | 3.72e-03 | 1.79e-02 | 18 |
| GO:00017822 | Thyroid | PTC | B cell homeostasis | 17/5968 | 31/18723 | 6.74e-03 | 2.90e-02 | 17 |
| GO:00352648 | Thyroid | PTC | multicellular organism growth | 56/5968 | 132/18723 | 6.79e-03 | 2.92e-02 | 56 |
| GO:00032066 | Thyroid | PTC | cardiac chamber morphogenesis | 51/5968 | 121/18723 | 1.09e-02 | 4.37e-02 | 51 |
| GO:000726524 | Thyroid | ATC | Ras protein signal transduction | 172/6293 | 337/18723 | 2.25e-11 | 7.96e-10 | 172 |
| GO:006156423 | Thyroid | ATC | axon development | 220/6293 | 467/18723 | 6.85e-10 | 1.80e-08 | 220 |
| GO:000740919 | Thyroid | ATC | axonogenesis | 197/6293 | 418/18723 | 5.09e-09 | 1.13e-07 | 197 |
| GO:0038127111 | Thyroid | ATC | ERBB signaling pathway | 71/6293 | 121/18723 | 1.31e-08 | 2.69e-07 | 71 |
| GO:0048872210 | Thyroid | ATC | homeostasis of number of cells | 135/6293 | 272/18723 | 2.92e-08 | 5.50e-07 | 135 |
| GO:0007173111 | Thyroid | ATC | epidermal growth factor receptor signaling pathway | 63/6293 | 108/18723 | 1.15e-07 | 1.92e-06 | 63 |
| GO:005105618 | Thyroid | ATC | regulation of small GTPase mediated signal transduction | 141/6293 | 302/18723 | 1.43e-06 | 1.77e-05 | 141 |
| GO:003090133 | Thyroid | ATC | midbrain development | 51/6293 | 90/18723 | 5.79e-06 | 6.13e-05 | 51 |
| GO:190118415 | Thyroid | ATC | regulation of ERBB signaling pathway | 45/6293 | 79/18723 | 1.68e-05 | 1.55e-04 | 45 |
| Page: 1 2 3 4 5 6 7 8 9 10 11 12 13 14 15 16 17 18 19 20 21 22 23 24 25 26 |
| Pathway ID | Tissue | Disease Stage | Description | Gene Ratio | Bg Ratio | pvalue | p.adjust | qvalue | Count |
| hsa0520820 | Cervix | CC | Chemical carcinogenesis - reactive oxygen species | 92/1267 | 223/8465 | 4.71e-22 | 5.09e-20 | 3.01e-20 | 92 |
| hsa0471420 | Cervix | CC | Thermogenesis | 76/1267 | 232/8465 | 4.29e-12 | 1.16e-10 | 6.85e-11 | 76 |
| hsa0516318 | Cervix | CC | Human cytomegalovirus infection | 65/1267 | 225/8465 | 4.59e-08 | 6.47e-07 | 3.83e-07 | 65 |
| hsa0520516 | Cervix | CC | Proteoglycans in cancer | 60/1267 | 205/8465 | 9.13e-08 | 1.18e-06 | 7.00e-07 | 60 |
| hsa0451010 | Cervix | CC | Focal adhesion | 59/1267 | 203/8465 | 1.53e-07 | 1.84e-06 | 1.09e-06 | 59 |
| hsa0481016 | Cervix | CC | Regulation of actin cytoskeleton | 64/1267 | 229/8465 | 2.24e-07 | 2.59e-06 | 1.53e-06 | 64 |
| hsa0491520 | Cervix | CC | Estrogen signaling pathway | 44/1267 | 138/8465 | 3.55e-07 | 3.97e-06 | 2.35e-06 | 44 |
| hsa0401210 | Cervix | CC | ErbB signaling pathway | 28/1267 | 85/8465 | 2.40e-05 | 1.82e-04 | 1.08e-04 | 28 |
| hsa0521010 | Cervix | CC | Colorectal cancer | 27/1267 | 86/8465 | 8.60e-05 | 5.57e-04 | 3.30e-04 | 27 |
| hsa052148 | Cervix | CC | Glioma | 24/1267 | 75/8465 | 1.51e-04 | 9.20e-04 | 5.44e-04 | 24 |
| hsa051657 | Cervix | CC | Human papillomavirus infection | 74/1267 | 331/8465 | 1.70e-04 | 1.02e-03 | 6.03e-04 | 74 |
| hsa04664 | Cervix | CC | Fc epsilon RI signaling pathway | 22/1267 | 68/8465 | 2.35e-04 | 1.31e-03 | 7.77e-04 | 22 |
| hsa015223 | Cervix | CC | Endocrine resistance | 28/1267 | 98/8465 | 3.82e-04 | 1.87e-03 | 1.11e-03 | 28 |
| hsa0472214 | Cervix | CC | Neurotrophin signaling pathway | 32/1267 | 119/8465 | 5.01e-04 | 2.42e-03 | 1.43e-03 | 32 |
| hsa052157 | Cervix | CC | Prostate cancer | 27/1267 | 97/8465 | 7.54e-04 | 3.39e-03 | 2.01e-03 | 27 |
| hsa0491212 | Cervix | CC | GnRH signaling pathway | 26/1267 | 93/8465 | 8.72e-04 | 3.87e-03 | 2.29e-03 | 26 |
| hsa0521310 | Cervix | CC | Endometrial cancer | 18/1267 | 58/8465 | 1.46e-03 | 6.30e-03 | 3.73e-03 | 18 |
| hsa052234 | Cervix | CC | Non-small cell lung cancer | 21/1267 | 72/8465 | 1.48e-03 | 6.32e-03 | 3.74e-03 | 21 |
| hsa0522510 | Cervix | CC | Hepatocellular carcinoma | 40/1267 | 168/8465 | 1.52e-03 | 6.39e-03 | 3.78e-03 | 40 |
| hsa052119 | Cervix | CC | Renal cell carcinoma | 20/1267 | 69/8465 | 2.07e-03 | 8.17e-03 | 4.83e-03 | 20 |
| Page: 1 2 3 4 5 6 7 8 9 10 11 12 13 14 15 16 17 18 19 20 21 22 23 24 25 26 27 28 29 30 31 32 33 34 35 36 37 38 |
Top |
Cell-cell communication analysis |
| Identification of potential cell-cell interactions between two cell types and their ligand-receptor pairs for different disease states |
| Ligand | Receptor | LRpair | Pathway | Tissue | Disease Stage |
| Page: 1 |
Top |
Single-cell gene regulatory network inference analysis |
| Find out the significant the regulons (TFs) and the target genes of each regulon across cell types for different disease states |
| TF | Cell Type | Tissue | Disease Stage | Target Gene | RSS | Regulon Activity |
| ∗The dot plots of a searched regulon are shown for all cell subpopulations in each disease state of each tissue based on the regulon specific score inferred using pySCENIC and by calculating the average expression. |
| Page: 1 |
Top |
Somatic mutation of malignant transformation related genes |
| Annotation of somatic variants for genes involved in malignant transformation |
| Hugo Symbol | Variant Class | Variant Classification | dbSNP RS | HGVSc | HGVSp | HGVSp Short | SWISSPROT | BIOTYPE | SIFT | PolyPhen | Tumor Sample Barcode | Tissue | Histology | Sex | Age | Stage | Therapy Types | Drugs | Outcome |
| SOS1 | SNV | Missense_Mutation | c.598A>G | p.Thr200Ala | p.T200A | Q07889 | protein_coding | tolerated(0.09) | benign(0) | TCGA-A2-A0SX-01 | Breast | breast invasive carcinoma | Female | <65 | I/II | Chemotherapy | adriamycin | PD | |
| SOS1 | SNV | Missense_Mutation | novel | c.1468C>A | p.Leu490Ile | p.L490I | Q07889 | protein_coding | deleterious(0.01) | probably_damaging(0.989) | TCGA-A8-A085-01 | Breast | breast invasive carcinoma | Male | <65 | I/II | Hormone Therapy | tamoxiphen | SD |
| SOS1 | SNV | Missense_Mutation | rs727505383 | c.3433G>A | p.Asp1145Asn | p.D1145N | Q07889 | protein_coding | deleterious(0.03) | benign(0.053) | TCGA-AR-A0TX-01 | Breast | breast invasive carcinoma | Female | <65 | I/II | Unknown | Unknown | SD |
| SOS1 | SNV | Missense_Mutation | c.1846N>T | p.His616Tyr | p.H616Y | Q07889 | protein_coding | deleterious(0) | probably_damaging(1) | TCGA-E2-A14W-01 | Breast | breast invasive carcinoma | Male | >=65 | I/II | Chemotherapy | cytoxan | SD | |
| SOS1 | insertion | Nonsense_Mutation | novel | c.517_518insACTGTAGCCACACAGCCATAAATGACTGATAAGAGAAACAGTG | p.Met173AsnfsTer10 | p.M173Nfs*10 | Q07889 | protein_coding | TCGA-AO-A0J9-01 | Breast | breast invasive carcinoma | Female | <65 | III/IV | Chemotherapy | cyclophosphamide | PD | ||
| SOS1 | insertion | Frame_Shift_Ins | novel | c.3688_3689insAAAAGAT | p.Pro1230GlnfsTer16 | p.P1230Qfs*16 | Q07889 | protein_coding | TCGA-AR-A0TU-01 | Breast | breast invasive carcinoma | Female | <65 | I/II | Unspecific | Doxorubicin | SD | ||
| SOS1 | deletion | Frame_Shift_Del | novel | c.2848delN | p.Arg950AspfsTer7 | p.R950Dfs*7 | Q07889 | protein_coding | TCGA-EW-A2FV-01 | Breast | breast invasive carcinoma | Female | <65 | III/IV | Chemotherapy | docetaxel | SD | ||
| SOS1 | SNV | Missense_Mutation | novel | c.451A>C | p.Asn151His | p.N151H | Q07889 | protein_coding | deleterious(0) | probably_damaging(1) | TCGA-2W-A8YY-01 | Cervix | cervical & endocervical cancer | Female | <65 | I/II | Chemotherapy | cisplatin | CR |
| SOS1 | SNV | Missense_Mutation | rs371408734 | c.3709N>G | p.Pro1237Ala | p.P1237A | Q07889 | protein_coding | deleterious_low_confidence(0) | probably_damaging(0.986) | TCGA-C5-A7CO-01 | Cervix | cervical & endocervical cancer | Female | >=65 | I/II | Chemotherapy | cisplatin | SD |
| SOS1 | SNV | Missense_Mutation | novel | c.3150N>A | p.Met1050Ile | p.M1050I | Q07889 | protein_coding | tolerated(0.18) | benign(0.048) | TCGA-C5-A8XH-01 | Cervix | cervical & endocervical cancer | Female | <65 | I/II | Unknown | Unknown | SD |
| Page: 1 2 3 4 5 6 7 8 9 10 11 12 13 14 15 16 17 18 |
Top |
Related drugs of malignant transformation related genes |
| Identification of chemicals and drugs interact with genes involved in malignant transfromation |
| (DGIdb 4.0) |
| Entrez ID | Symbol | Category | Interaction Types | Drug Claim Name | Drug Name | PMIDs |
| 6654 | SOS1 | KINASE | 385612239 | |||
| 6654 | SOS1 | KINASE | IL-6 | 9815779 |
| Page: 1 |

Copyright 2023-Present -The University of Texas Health Science Center at Houston |