
|
|||||
|
 | |
| |
| |
| |
| |
| |
|
Gene: SMC3 |
Gene summary for SMC3 |
| Gene information | Species | Human | Gene symbol | SMC3 | Gene ID | 9126 |
| Gene name | structural maintenance of chromosomes 3 | |
| Gene Alias | BAM | |
| Cytomap | 10q25.2 | |
| Gene Type | protein-coding | GO ID | GO:0000003 | UniProtAcc | Q9UQE7 |
Top |
Malignant transformation analysis |
| Identification of the aberrant gene expression in precancerous and cancerous lesions by comparing the gene expression of stem-like cells in diseased tissues with normal stem cells |
| Entrez ID | Symbol | Replicates | Species | Organ | Tissue | Adj P-value | Log2FC | Malignancy |
| 9126 | SMC3 | LZE2T | Human | Esophagus | ESCC | 2.42e-05 | 1.18e+00 | 0.082 |
| 9126 | SMC3 | LZE4T | Human | Esophagus | ESCC | 4.36e-29 | 8.23e-01 | 0.0811 |
| 9126 | SMC3 | LZE7T | Human | Esophagus | ESCC | 1.66e-06 | 5.42e-01 | 0.0667 |
| 9126 | SMC3 | LZE8T | Human | Esophagus | ESCC | 1.87e-11 | 3.03e-01 | 0.067 |
| 9126 | SMC3 | LZE20T | Human | Esophagus | ESCC | 8.48e-10 | 1.71e-01 | 0.0662 |
| 9126 | SMC3 | LZE21D1 | Human | Esophagus | HGIN | 1.82e-02 | 1.66e-01 | 0.0632 |
| 9126 | SMC3 | LZE24T | Human | Esophagus | ESCC | 8.31e-20 | 6.30e-01 | 0.0596 |
| 9126 | SMC3 | LZE21T | Human | Esophagus | ESCC | 1.99e-02 | 2.98e-01 | 0.0655 |
| 9126 | SMC3 | LZE6T | Human | Esophagus | ESCC | 1.39e-12 | 3.73e-01 | 0.0845 |
| 9126 | SMC3 | P1T-E | Human | Esophagus | ESCC | 2.02e-12 | 7.08e-01 | 0.0875 |
| 9126 | SMC3 | P2T-E | Human | Esophagus | ESCC | 5.08e-66 | 1.26e+00 | 0.1177 |
| 9126 | SMC3 | P4T-E | Human | Esophagus | ESCC | 2.68e-46 | 1.28e+00 | 0.1323 |
| 9126 | SMC3 | P5T-E | Human | Esophagus | ESCC | 5.07e-48 | 1.19e+00 | 0.1327 |
| 9126 | SMC3 | P8T-E | Human | Esophagus | ESCC | 2.12e-37 | 7.08e-01 | 0.0889 |
| 9126 | SMC3 | P9T-E | Human | Esophagus | ESCC | 1.22e-18 | 3.16e-01 | 0.1131 |
| 9126 | SMC3 | P10T-E | Human | Esophagus | ESCC | 2.87e-28 | 4.56e-01 | 0.116 |
| 9126 | SMC3 | P11T-E | Human | Esophagus | ESCC | 1.86e-17 | 7.53e-01 | 0.1426 |
| 9126 | SMC3 | P12T-E | Human | Esophagus | ESCC | 2.07e-44 | 8.71e-01 | 0.1122 |
| 9126 | SMC3 | P15T-E | Human | Esophagus | ESCC | 2.03e-31 | 7.63e-01 | 0.1149 |
| 9126 | SMC3 | P16T-E | Human | Esophagus | ESCC | 4.01e-65 | 1.12e+00 | 0.1153 |
| Page: 1 2 3 4 5 6 7 |
| Tissue | Expression Dynamics | Abbreviation |
| Esophagus | 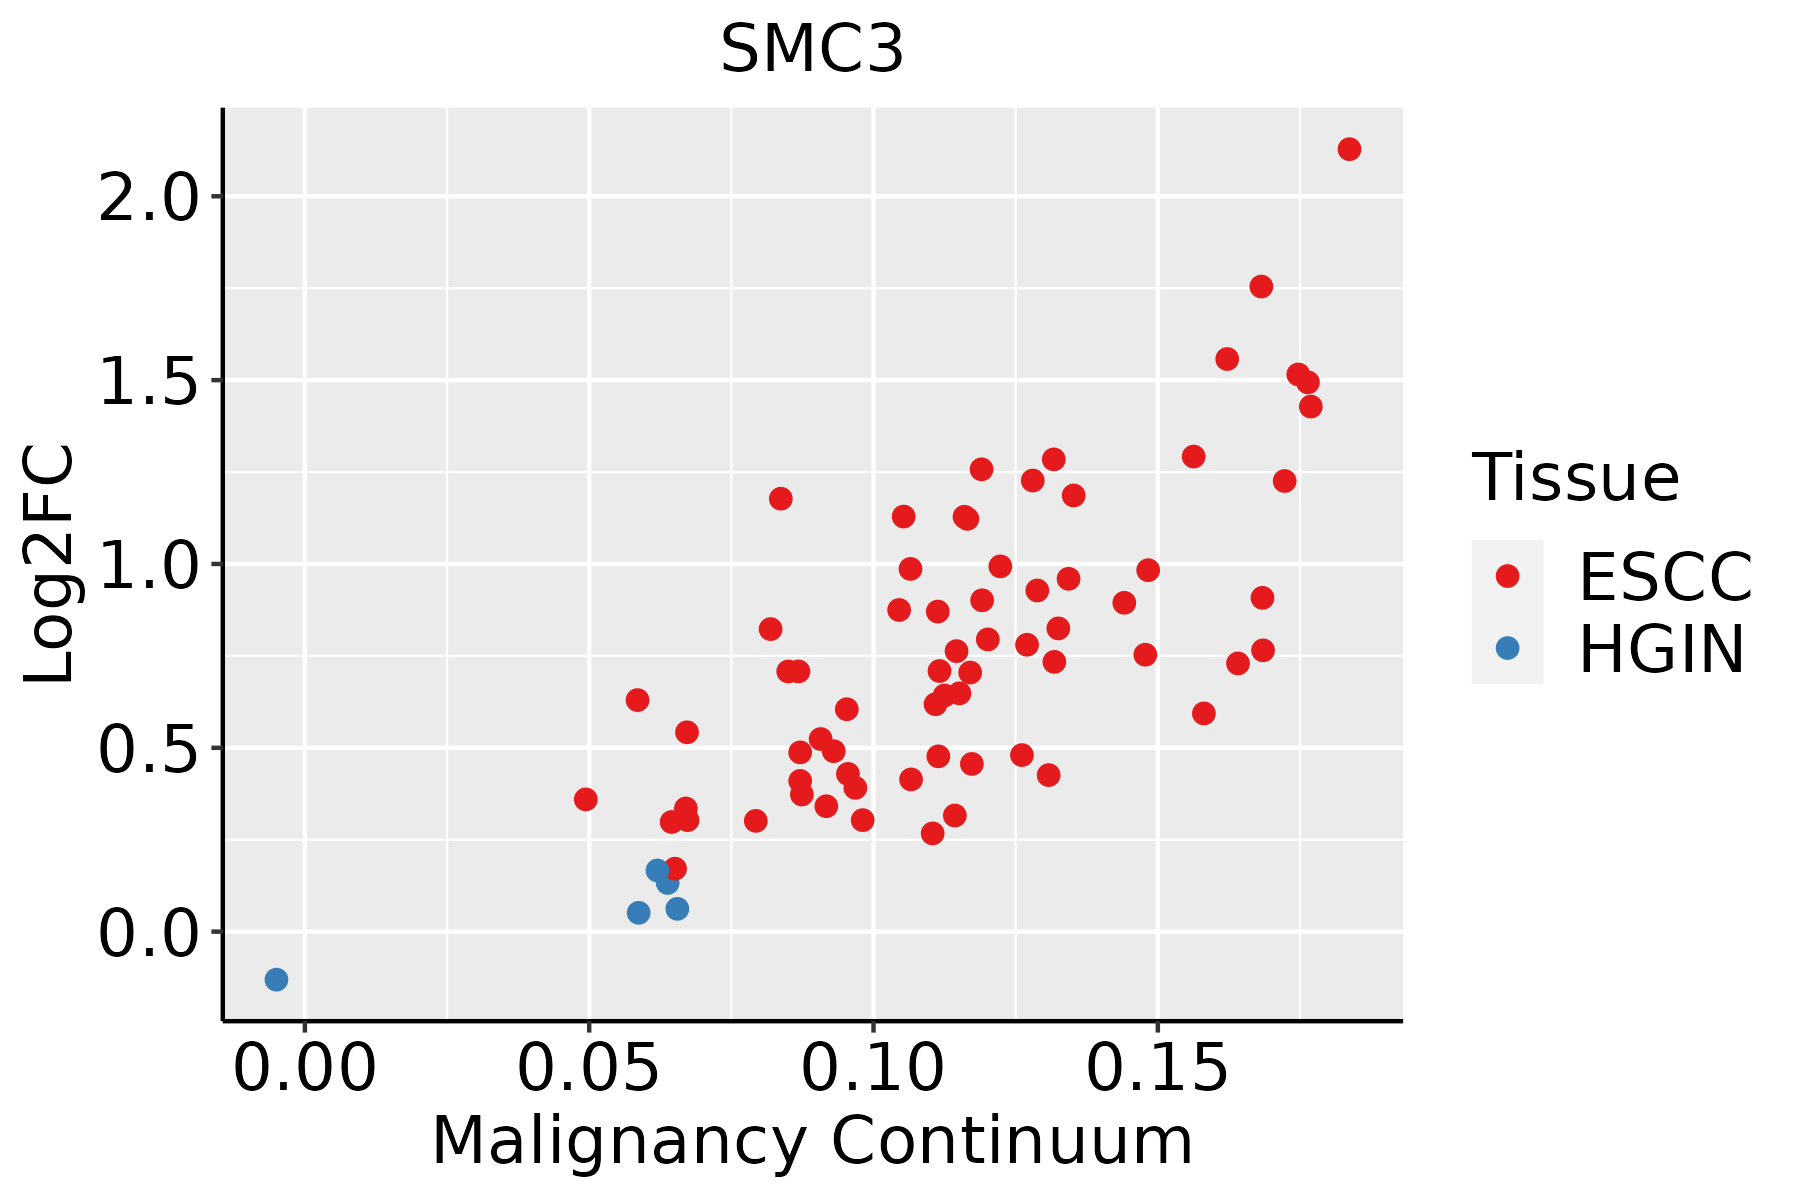 | ESCC: Esophageal squamous cell carcinoma |
| HGIN: High-grade intraepithelial neoplasias | ||
| LGIN: Low-grade intraepithelial neoplasias | ||
| Liver |  | HCC: Hepatocellular carcinoma |
| NAFLD: Non-alcoholic fatty liver disease | ||
| Oral Cavity | 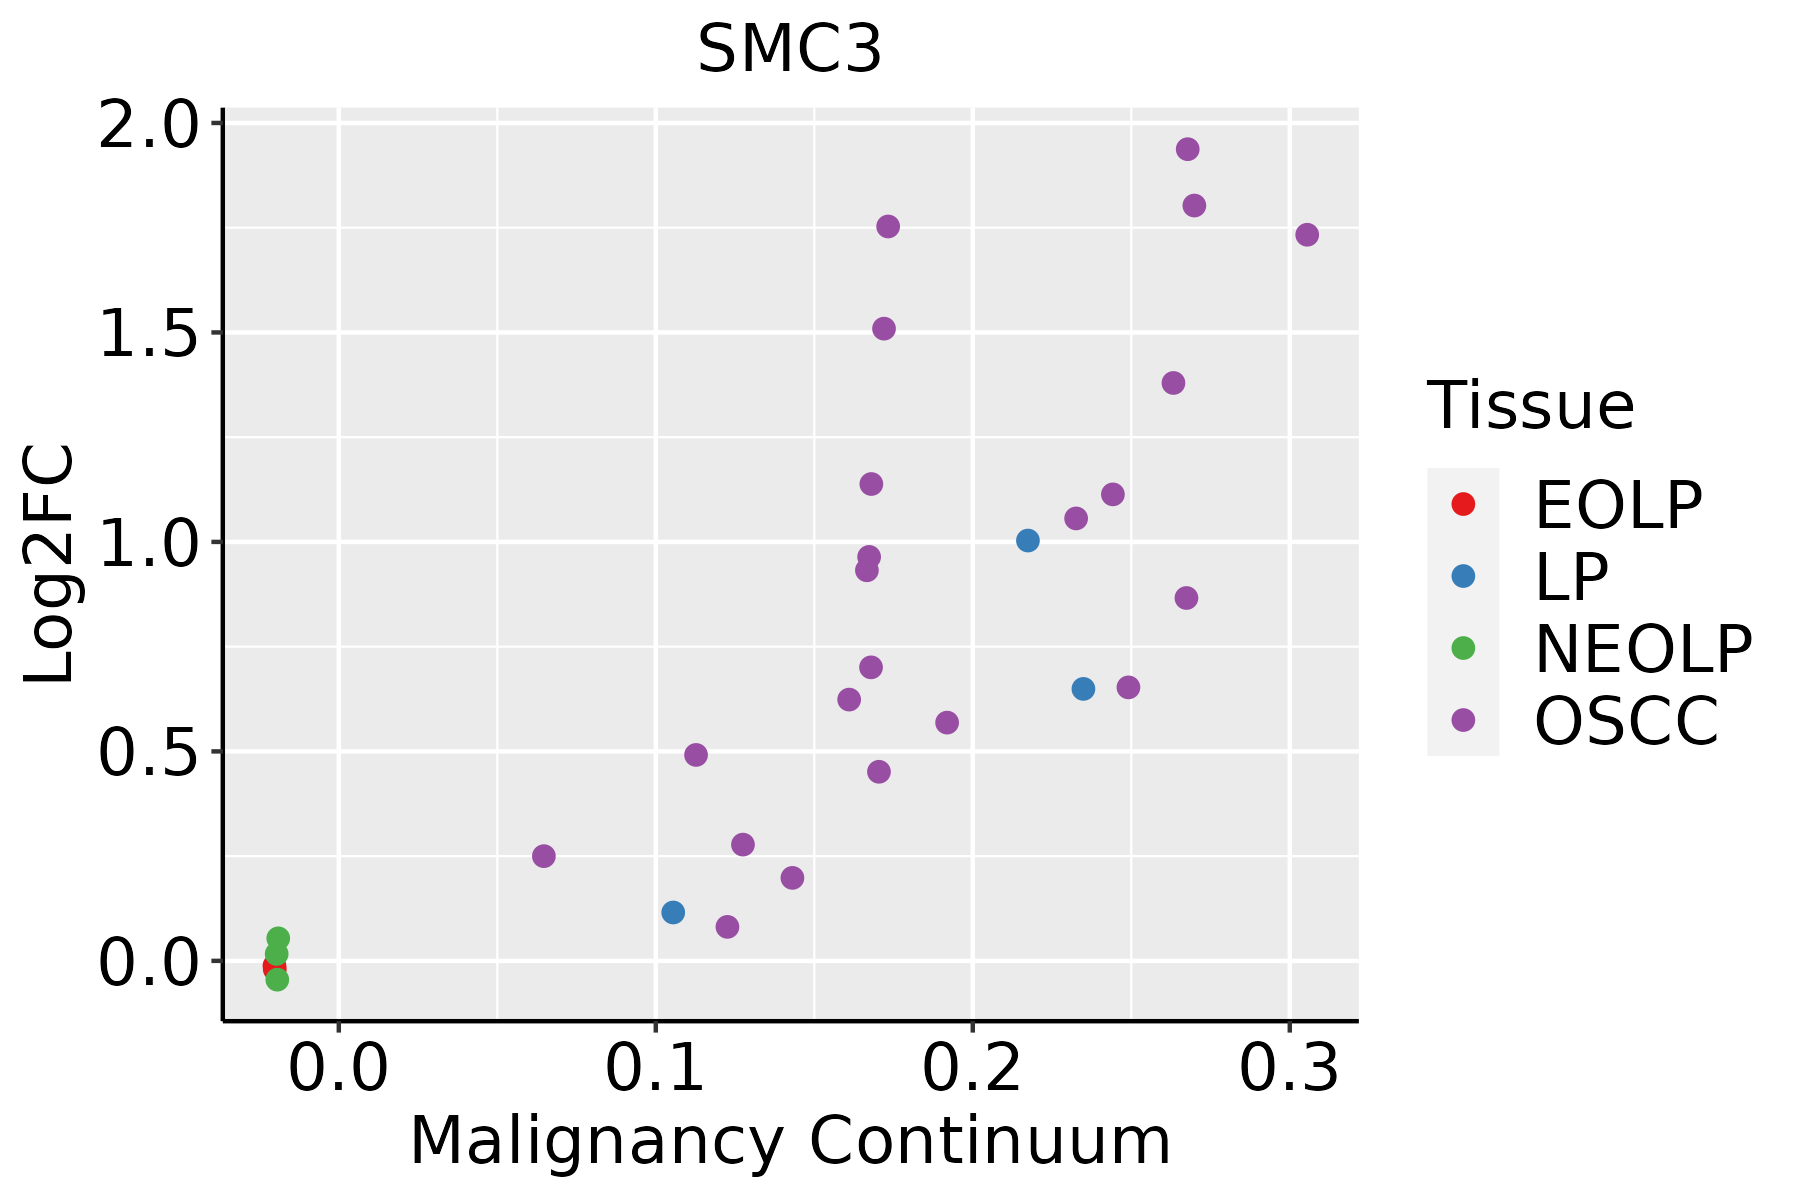 | EOLP: Erosive Oral lichen planus |
| LP: leukoplakia | ||
| NEOLP: Non-erosive oral lichen planus | ||
| OSCC: Oral squamous cell carcinoma | ||
| Prostate | 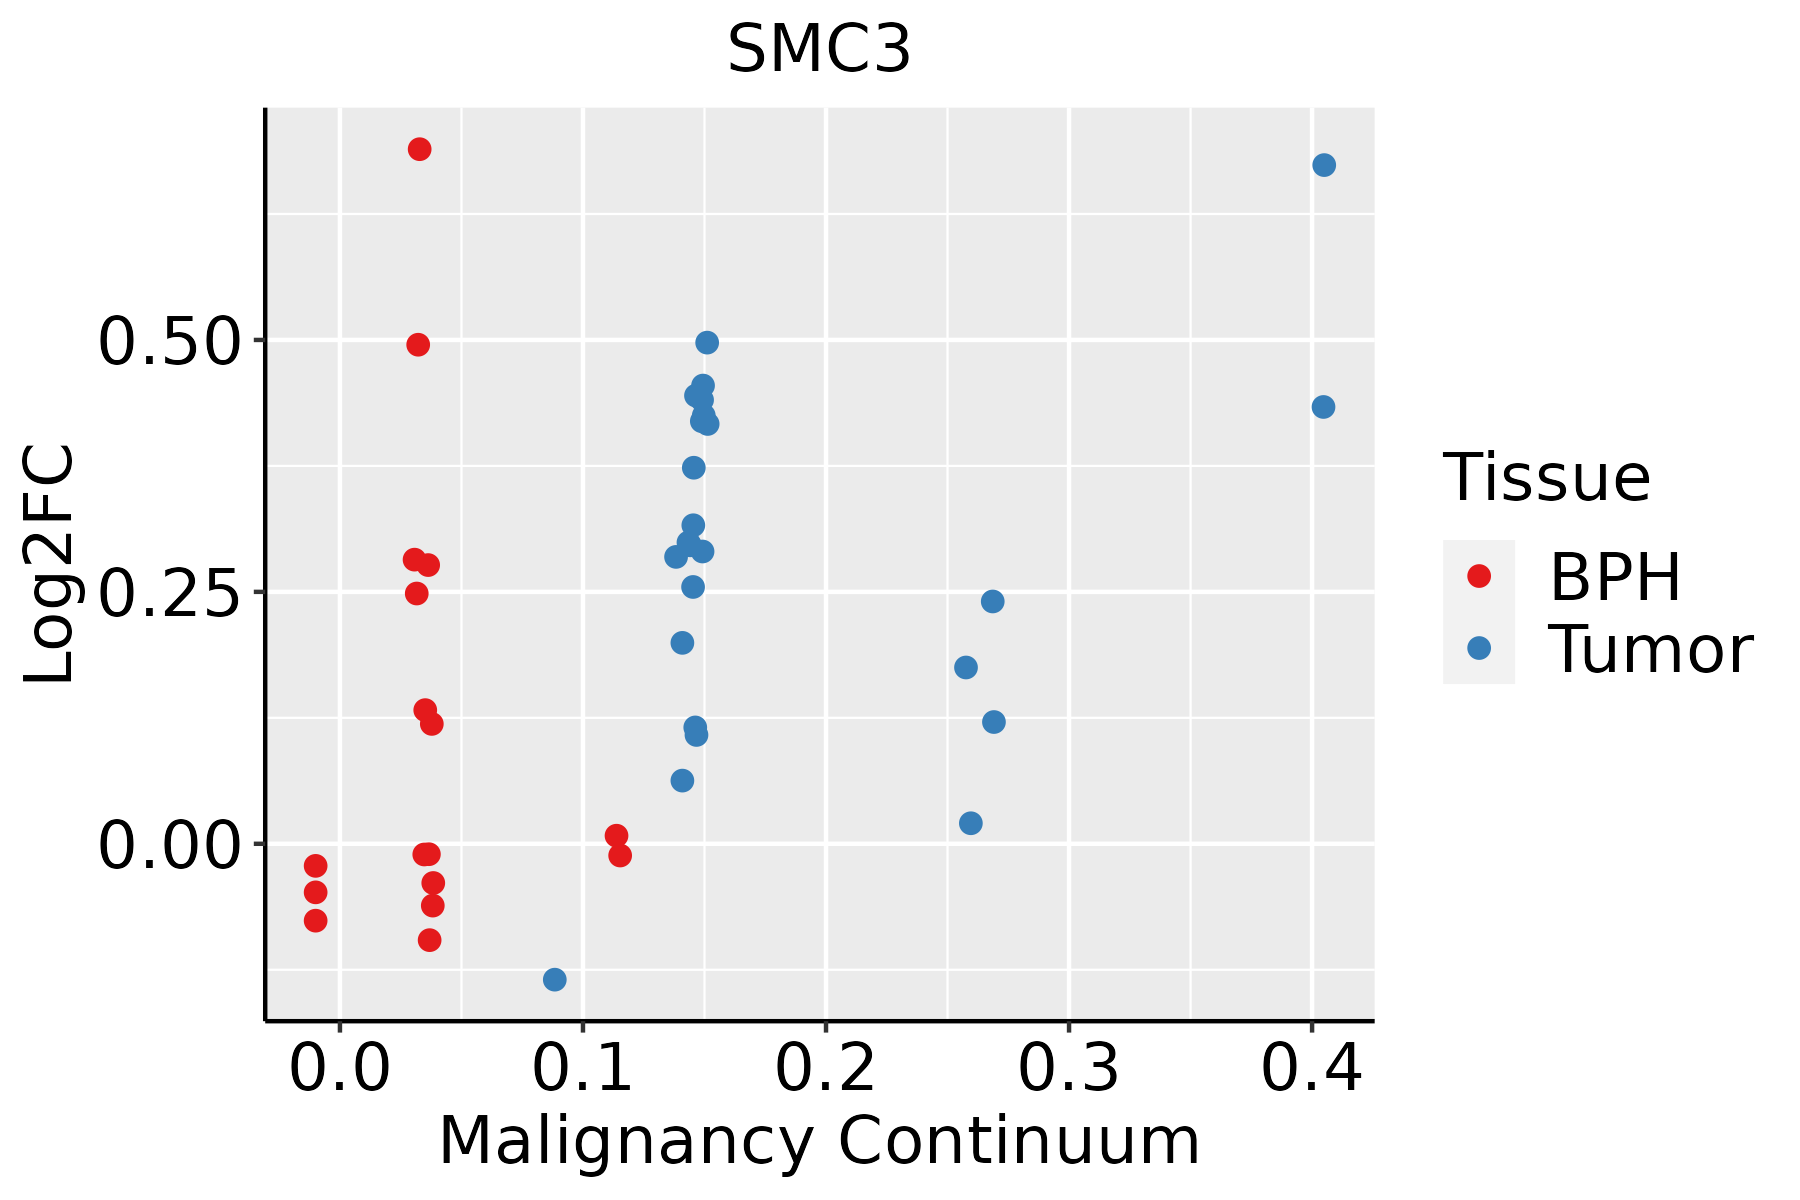 | BPH: Benign Prostatic Hyperplasia |
| Skin |  | AK: Actinic keratosis |
| cSCC: Cutaneous squamous cell carcinoma | ||
| SCCIS:squamous cell carcinoma in situ | ||
| Thyroid | 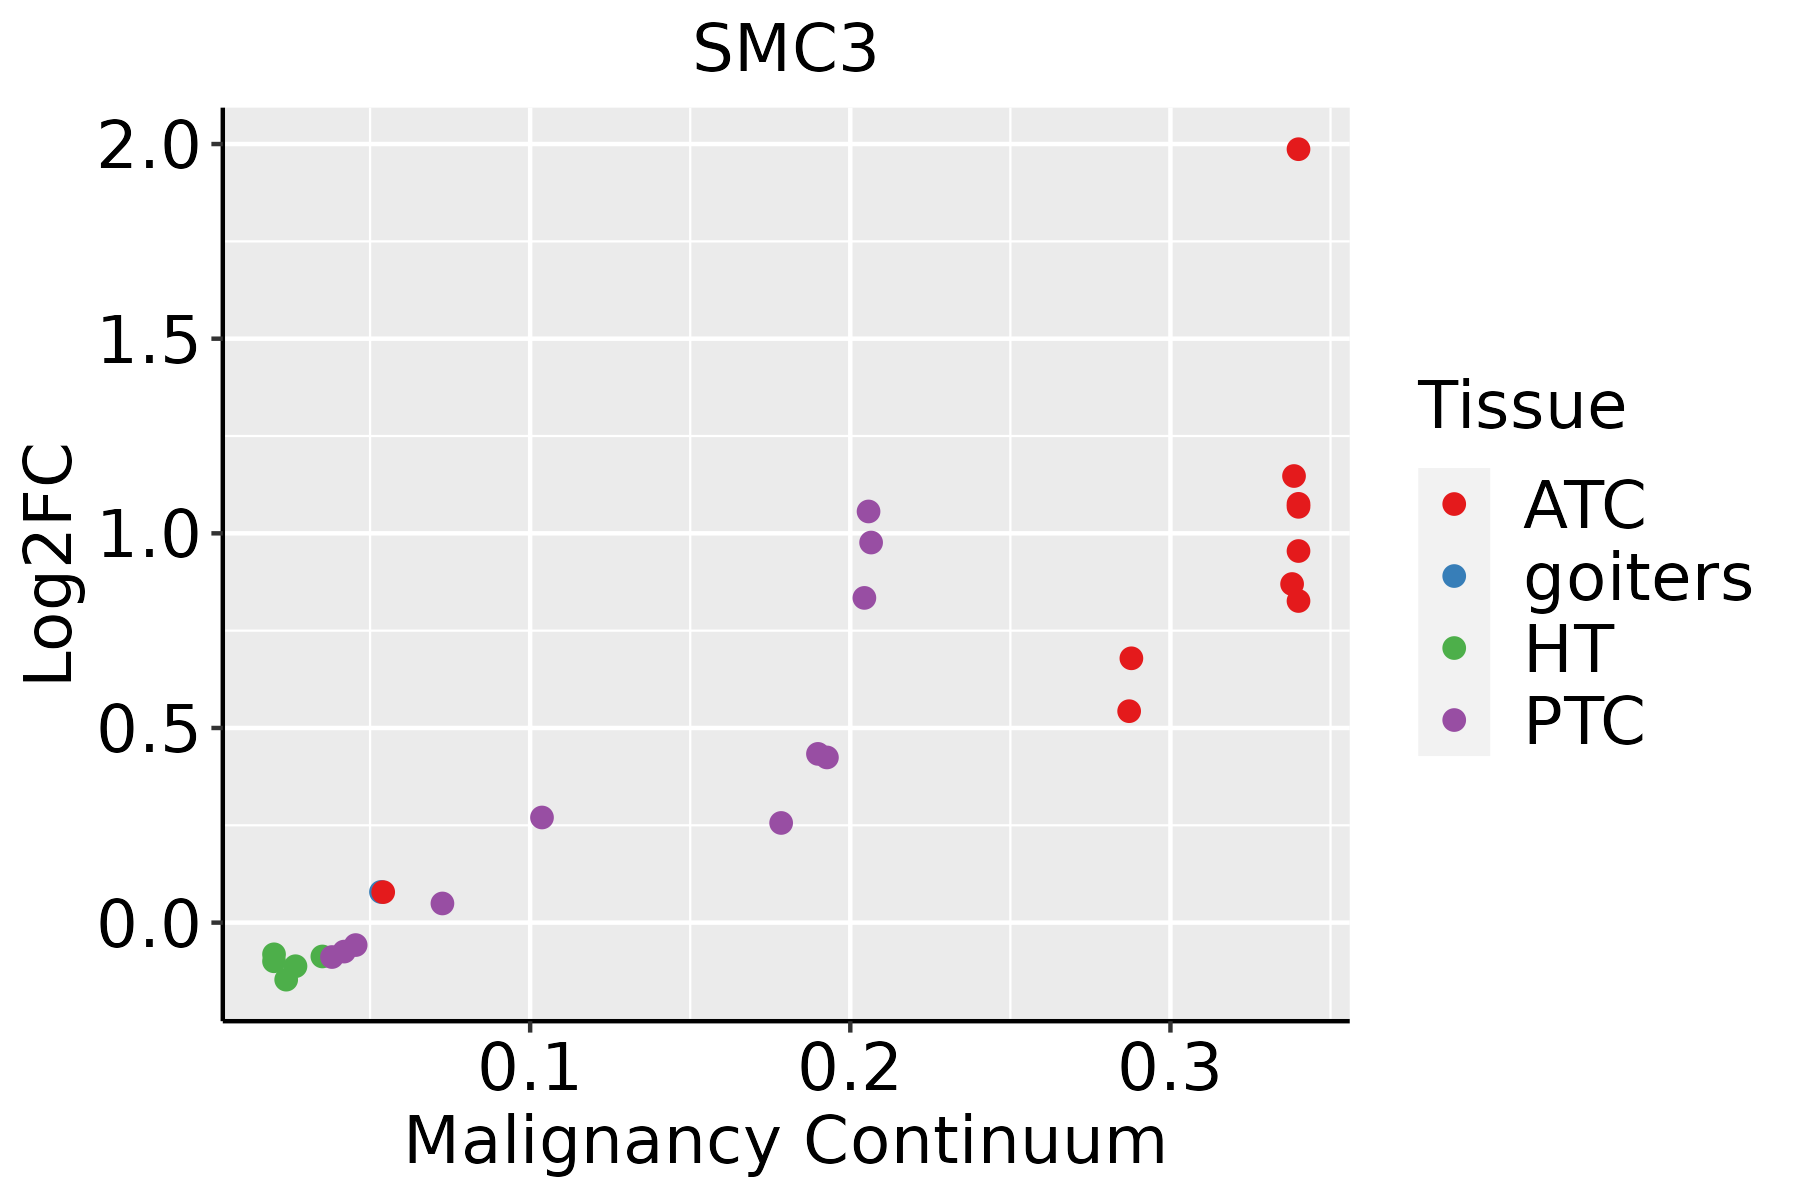 | ATC: Anaplastic thyroid cancer |
| HT: Hashimoto's thyroiditis | ||
| PTC: Papillary thyroid cancer |
| ∗log2FC in expression of this searched gene in stem-like cells from each diseased tissue sample relative to stem-like cells in normal samples in each tissue plotted against the malignancy continuum. Samples are colored based on if they are from different disease stage. |
Top |
Malignant transformation related pathway analysis |
| Find out the enriched GO biological processes and KEGG pathways involved in transition from healthy to precancer to cancer |
| Tissue | Disease Stage | Enriched GO biological Processes |
| Colorectum | AD |  |
| Colorectum | SER |  |
| Colorectum | MSS |  |
| Colorectum | MSI-H |  |
| Colorectum | FAP |  |
| ∗Top 15 enriched GO BP terms are showed in the bar plot of each disease state in each tissue. Each row represents a significant GO biological process which is colored according to the -log10(p.adjust). |
| Page: 1 2 3 4 5 6 7 8 9 |
| GO ID | Tissue | Disease Stage | Description | Gene Ratio | Bg Ratio | pvalue | p.adjust | Count |
| GO:003582117 | Thyroid | PTC | modulation of process of other organism | 53/5968 | 106/18723 | 7.63e-05 | 6.54e-04 | 53 |
| GO:009872710 | Thyroid | PTC | maintenance of cell number | 63/5968 | 134/18723 | 1.73e-04 | 1.32e-03 | 63 |
| GO:005122514 | Thyroid | PTC | spindle assembly | 56/5968 | 117/18723 | 2.17e-04 | 1.60e-03 | 56 |
| GO:00198279 | Thyroid | PTC | stem cell population maintenance | 61/5968 | 131/18723 | 3.01e-04 | 2.12e-03 | 61 |
| GO:00482855 | Thyroid | PTC | organelle fission | 188/5968 | 488/18723 | 9.64e-04 | 5.77e-03 | 188 |
| GO:009030717 | Thyroid | PTC | mitotic spindle assembly | 33/5968 | 65/18723 | 1.17e-03 | 6.81e-03 | 33 |
| GO:00988135 | Thyroid | PTC | nuclear chromosome segregation | 114/5968 | 281/18723 | 1.21e-03 | 6.94e-03 | 114 |
| GO:005170218 | Thyroid | PTC | biological process involved in interaction with symbiont | 44/5968 | 94/18723 | 1.72e-03 | 9.44e-03 | 44 |
| GO:00439225 | Thyroid | PTC | negative regulation by host of viral transcription | 10/5968 | 14/18723 | 2.77e-03 | 1.38e-02 | 10 |
| GO:00002804 | Thyroid | PTC | nuclear division | 167/5968 | 439/18723 | 3.27e-03 | 1.60e-02 | 167 |
| GO:004478817 | Thyroid | PTC | modulation by host of viral process | 17/5968 | 30/18723 | 4.31e-03 | 2.04e-02 | 17 |
| GO:000706410 | Thyroid | PTC | mitotic sister chromatid cohesion | 16/5968 | 28/18723 | 4.99e-03 | 2.31e-02 | 16 |
| GO:00070629 | Thyroid | PTC | sister chromatid cohesion | 29/5968 | 62/18723 | 9.96e-03 | 4.07e-02 | 29 |
| GO:001049832 | Thyroid | ATC | proteasomal protein catabolic process | 309/6293 | 490/18723 | 1.78e-41 | 1.13e-37 | 309 |
| GO:0043161210 | Thyroid | ATC | proteasome-mediated ubiquitin-dependent protein catabolic process | 265/6293 | 412/18723 | 7.09e-38 | 1.49e-34 | 265 |
| GO:0009896210 | Thyroid | ATC | positive regulation of catabolic process | 290/6293 | 492/18723 | 2.15e-31 | 1.94e-28 | 290 |
| GO:0031331210 | Thyroid | ATC | positive regulation of cellular catabolic process | 258/6293 | 427/18723 | 2.09e-30 | 1.65e-27 | 258 |
| GO:004217635 | Thyroid | ATC | regulation of protein catabolic process | 239/6293 | 391/18723 | 2.63e-29 | 1.85e-26 | 239 |
| GO:190336235 | Thyroid | ATC | regulation of cellular protein catabolic process | 168/6293 | 255/18723 | 3.50e-26 | 1.58e-23 | 168 |
| GO:001603234 | Thyroid | ATC | viral process | 241/6293 | 415/18723 | 5.50e-25 | 2.04e-22 | 241 |
| Page: 1 2 3 4 5 6 7 8 9 10 11 12 13 14 15 16 17 18 19 20 21 22 23 24 25 26 27 |
| Pathway ID | Tissue | Disease Stage | Description | Gene Ratio | Bg Ratio | pvalue | p.adjust | qvalue | Count |
| hsa041109 | Esophagus | HGIN | Cell cycle | 38/1383 | 157/8465 | 6.70e-03 | 4.37e-02 | 3.47e-02 | 38 |
| hsa0411016 | Esophagus | HGIN | Cell cycle | 38/1383 | 157/8465 | 6.70e-03 | 4.37e-02 | 3.47e-02 | 38 |
| hsa0411023 | Esophagus | ESCC | Cell cycle | 126/4205 | 157/8465 | 1.34e-15 | 5.60e-14 | 2.87e-14 | 126 |
| hsa041146 | Esophagus | ESCC | Oocyte meiosis | 77/4205 | 131/8465 | 2.19e-02 | 4.80e-02 | 2.46e-02 | 77 |
| hsa0411033 | Esophagus | ESCC | Cell cycle | 126/4205 | 157/8465 | 1.34e-15 | 5.60e-14 | 2.87e-14 | 126 |
| hsa0411411 | Esophagus | ESCC | Oocyte meiosis | 77/4205 | 131/8465 | 2.19e-02 | 4.80e-02 | 2.46e-02 | 77 |
| hsa041104 | Liver | Cirrhotic | Cell cycle | 61/2530 | 157/8465 | 9.53e-03 | 3.21e-02 | 1.98e-02 | 61 |
| hsa0411011 | Liver | Cirrhotic | Cell cycle | 61/2530 | 157/8465 | 9.53e-03 | 3.21e-02 | 1.98e-02 | 61 |
| hsa041102 | Liver | HCC | Cell cycle | 106/4020 | 157/8465 | 2.54e-07 | 3.04e-06 | 1.69e-06 | 106 |
| hsa041103 | Liver | HCC | Cell cycle | 106/4020 | 157/8465 | 2.54e-07 | 3.04e-06 | 1.69e-06 | 106 |
| hsa041108 | Oral cavity | OSCC | Cell cycle | 118/3704 | 157/8465 | 7.15e-16 | 2.66e-14 | 1.35e-14 | 118 |
| hsa04114 | Oral cavity | OSCC | Oocyte meiosis | 74/3704 | 131/8465 | 2.13e-03 | 5.75e-03 | 2.92e-03 | 74 |
| hsa0411015 | Oral cavity | OSCC | Cell cycle | 118/3704 | 157/8465 | 7.15e-16 | 2.66e-14 | 1.35e-14 | 118 |
| hsa041141 | Oral cavity | OSCC | Oocyte meiosis | 74/3704 | 131/8465 | 2.13e-03 | 5.75e-03 | 2.92e-03 | 74 |
| hsa0411022 | Oral cavity | LP | Cell cycle | 70/2418 | 157/8465 | 1.17e-05 | 8.27e-05 | 5.33e-05 | 70 |
| hsa0411032 | Oral cavity | LP | Cell cycle | 70/2418 | 157/8465 | 1.17e-05 | 8.27e-05 | 5.33e-05 | 70 |
| hsa041107 | Prostate | BPH | Cell cycle | 49/1718 | 157/8465 | 7.39e-04 | 3.59e-03 | 2.22e-03 | 49 |
| hsa0411014 | Prostate | BPH | Cell cycle | 49/1718 | 157/8465 | 7.39e-04 | 3.59e-03 | 2.22e-03 | 49 |
| hsa0411021 | Prostate | Tumor | Cell cycle | 51/1791 | 157/8465 | 5.67e-04 | 2.89e-03 | 1.79e-03 | 51 |
| hsa0411031 | Prostate | Tumor | Cell cycle | 51/1791 | 157/8465 | 5.67e-04 | 2.89e-03 | 1.79e-03 | 51 |
| Page: 1 |
Top |
Cell-cell communication analysis |
| Identification of potential cell-cell interactions between two cell types and their ligand-receptor pairs for different disease states |
| Ligand | Receptor | LRpair | Pathway | Tissue | Disease Stage |
| Page: 1 |
Top |
Single-cell gene regulatory network inference analysis |
| Find out the significant the regulons (TFs) and the target genes of each regulon across cell types for different disease states |
| TF | Cell Type | Tissue | Disease Stage | Target Gene | RSS | Regulon Activity |
| SMC3 | TRANS | Cervix | Healthy | LLPH,ZCCHC10,PRPSAP1, etc. | 1.80e-01 |  |
| SMC3 | TAC | Colorectum | Healthy | HELLS,AC069277.1,CENPP, etc. | 6.95e-02 |  |
| SMC3 | GC | Colorectum | AD | MCM3AP,SLC37A3,NDUFAF2, etc. | 3.40e-02 |  |
| SMC3 | CD8TCM | Colorectum | ADJ | MCM3AP,SLC37A3,NDUFAF2, etc. | 8.22e-03 |  |
| SMC3 | MON | Colorectum | ADJ | MCM3AP,SLC37A3,NDUFAF2, etc. | 2.27e-02 | |
| SMC3 | BN | Colorectum | Healthy | MCM3AP,SLC37A3,NDUFAF2, etc. | 1.44e-02 | |
| SMC3 | PERI | Colorectum | Healthy | C19orf25,CTSO,RWDD4, etc. | 5.13e-02 | |
| SMC3 | CD8TEX | Endometrium | ADJ | AHI1,ATAD2,MDM1, etc. | 5.28e-02 |  |
| SMC3 | PLA | Endometrium | ADJ | AHI1,ATAD2,MDM1, etc. | 5.52e-02 | |
| SMC3 | NEUT | Endometrium | AEH | AHI1,ATAD2,MDM1, etc. | 2.06e-01 |  |
| ∗The dot plots of a searched regulon are shown for all cell subpopulations in each disease state of each tissue based on the regulon specific score inferred using pySCENIC and by calculating the average expression. |
| Page: 1 2 3 |
Top |
Somatic mutation of malignant transformation related genes |
| Annotation of somatic variants for genes involved in malignant transformation |
| Hugo Symbol | Variant Class | Variant Classification | dbSNP RS | HGVSc | HGVSp | HGVSp Short | SWISSPROT | BIOTYPE | SIFT | PolyPhen | Tumor Sample Barcode | Tissue | Histology | Sex | Age | Stage | Therapy Types | Drugs | Outcome |
| SMC3 | SNV | Missense_Mutation | c.3191N>A | p.Gly1064Asp | p.G1064D | Q9UQE7 | protein_coding | tolerated(0.84) | benign(0.003) | TCGA-AC-A23C-01 | Breast | breast invasive carcinoma | Female | <65 | I/II | Chemotherapy | chemo | CR | |
| SMC3 | SNV | Missense_Mutation | novel | c.3624C>A | p.Asp1208Glu | p.D1208E | Q9UQE7 | protein_coding | deleterious(0.01) | possibly_damaging(0.65) | TCGA-AR-A2LR-01 | Breast | breast invasive carcinoma | Female | <65 | I/II | Chemotherapy | adriamycin | SD |
| SMC3 | SNV | Missense_Mutation | c.481G>A | p.Glu161Lys | p.E161K | Q9UQE7 | protein_coding | deleterious(0) | probably_damaging(1) | TCGA-BH-A0EE-01 | Breast | breast invasive carcinoma | Female | >=65 | I/II | Chemotherapy | docetaxel | SD | |
| SMC3 | SNV | Missense_Mutation | novel | c.3612G>C | p.Glu1204Asp | p.E1204D | Q9UQE7 | protein_coding | tolerated(0.15) | benign(0.159) | TCGA-BH-A2L8-01 | Breast | breast invasive carcinoma | Female | <65 | I/II | Chemotherapy | cytoxan | CR |
| SMC3 | SNV | Missense_Mutation | c.2701N>G | p.Met901Val | p.M901V | Q9UQE7 | protein_coding | tolerated(0.15) | benign(0.006) | TCGA-D8-A1XR-01 | Breast | breast invasive carcinoma | Female | <65 | I/II | Chemotherapy | adriamycin+cyclophosphamide | SD | |
| SMC3 | SNV | Missense_Mutation | c.3443N>T | p.Ala1148Val | p.A1148V | Q9UQE7 | protein_coding | deleterious(0.02) | probably_damaging(1) | TCGA-D8-A27G-01 | Breast | breast invasive carcinoma | Female | >=65 | I/II | Unknown | Unknown | SD | |
| SMC3 | SNV | Missense_Mutation | novel | c.2908N>A | p.Glu970Lys | p.E970K | Q9UQE7 | protein_coding | deleterious(0.05) | possibly_damaging(0.474) | TCGA-EW-A6SC-01 | Breast | breast invasive carcinoma | Female | <65 | I/II | Hormone Therapy | aromatase | SD |
| SMC3 | SNV | Missense_Mutation | rs754501454 | c.2708N>T | p.Arg903Leu | p.R903L | Q9UQE7 | protein_coding | tolerated(0.2) | benign(0.019) | TCGA-S3-AA10-01 | Breast | breast invasive carcinoma | Female | >=65 | I/II | Chemotherapy | cytoxan | CR |
| SMC3 | insertion | Nonsense_Mutation | novel | c.633_634insTTTTTAAGCTTTTATAATTTGTTATAATTA | p.Ala211_Gln212insPheLeuSerPheTyrAsnLeuLeuTerLeu | p.A211_Q212insFLSFYNLL*L | Q9UQE7 | protein_coding | TCGA-A8-A0A1-01 | Breast | breast invasive carcinoma | Female | >=65 | I/II | Hormone Therapy | tamoxiphen | SD | ||
| SMC3 | insertion | Nonsense_Mutation | novel | c.1076_1077insTGCACAGGCTGGAGTGCAGTGGTGAGATCACAGCTC | p.Glu359delinsAspAlaGlnAlaGlyValGlnTrpTerAspHisSerSer | p.E359delinsDAQAGVQW*DHSS | Q9UQE7 | protein_coding | TCGA-BH-A0AY-01 | Breast | breast invasive carcinoma | Female | <65 | I/II | Chemotherapy | SD |
| Page: 1 2 3 4 5 6 7 8 9 10 11 12 13 |
Top |
Related drugs of malignant transformation related genes |
| Identification of chemicals and drugs interact with genes involved in malignant transfromation |
| (DGIdb 4.0) |
| Entrez ID | Symbol | Category | Interaction Types | Drug Claim Name | Drug Name | PMIDs |
| Page: 1 |

Copyright 2023-Present -The University of Texas Health Science Center at Houston |