
|
|||||
|
 | |
| |
| |
| |
| |
| |
|
Gene: SDC4 |
Gene summary for SDC4 |
| Gene information | Species | Human | Gene symbol | SDC4 | Gene ID | 6385 |
| Gene name | syndecan 4 | |
| Gene Alias | SYND4 | |
| Cytomap | 20q13.12 | |
| Gene Type | protein-coding | GO ID | GO:0001655 | UniProtAcc | P31431 |
Top |
Malignant transformation analysis |
| Identification of the aberrant gene expression in precancerous and cancerous lesions by comparing the gene expression of stem-like cells in diseased tissues with normal stem cells |
| Entrez ID | Symbol | Replicates | Species | Organ | Tissue | Adj P-value | Log2FC | Malignancy |
| 6385 | SDC4 | GSM4909285 | Human | Breast | IDC | 2.01e-09 | -4.73e-01 | 0.21 |
| 6385 | SDC4 | GSM4909288 | Human | Breast | IDC | 1.21e-03 | -3.37e-01 | 0.0988 |
| 6385 | SDC4 | GSM4909290 | Human | Breast | IDC | 1.62e-08 | -4.99e-01 | 0.2096 |
| 6385 | SDC4 | GSM4909294 | Human | Breast | IDC | 1.01e-15 | -5.57e-01 | 0.2022 |
| 6385 | SDC4 | GSM4909296 | Human | Breast | IDC | 2.30e-14 | -4.88e-01 | 0.1524 |
| 6385 | SDC4 | GSM4909297 | Human | Breast | IDC | 1.44e-07 | -1.89e-03 | 0.1517 |
| 6385 | SDC4 | GSM4909299 | Human | Breast | IDC | 3.62e-04 | 3.28e-01 | 0.035 |
| 6385 | SDC4 | GSM4909304 | Human | Breast | IDC | 9.01e-05 | -3.89e-01 | 0.1636 |
| 6385 | SDC4 | GSM4909306 | Human | Breast | IDC | 1.70e-08 | -4.43e-01 | 0.1564 |
| 6385 | SDC4 | GSM4909307 | Human | Breast | IDC | 1.42e-08 | -4.66e-01 | 0.1569 |
| 6385 | SDC4 | GSM4909311 | Human | Breast | IDC | 1.10e-31 | -4.50e-01 | 0.1534 |
| 6385 | SDC4 | GSM4909312 | Human | Breast | IDC | 4.20e-10 | -2.46e-01 | 0.1552 |
| 6385 | SDC4 | GSM4909313 | Human | Breast | IDC | 1.63e-08 | 3.12e-01 | 0.0391 |
| 6385 | SDC4 | GSM4909315 | Human | Breast | IDC | 2.32e-07 | -4.07e-01 | 0.21 |
| 6385 | SDC4 | GSM4909316 | Human | Breast | IDC | 6.95e-03 | -4.87e-01 | 0.21 |
| 6385 | SDC4 | GSM4909318 | Human | Breast | IDC | 5.82e-03 | -4.58e-01 | 0.2031 |
| 6385 | SDC4 | GSM4909319 | Human | Breast | IDC | 1.82e-37 | -7.22e-01 | 0.1563 |
| 6385 | SDC4 | GSM4909320 | Human | Breast | IDC | 3.22e-13 | -6.99e-01 | 0.1575 |
| 6385 | SDC4 | GSM4909321 | Human | Breast | IDC | 7.02e-16 | -3.60e-01 | 0.1559 |
| 6385 | SDC4 | brca1 | Human | Breast | Precancer | 2.27e-02 | -1.86e-01 | -0.0338 |
| Page: 1 2 3 4 5 6 7 8 9 10 11 12 13 |
| Tissue | Expression Dynamics | Abbreviation |
| Breast | 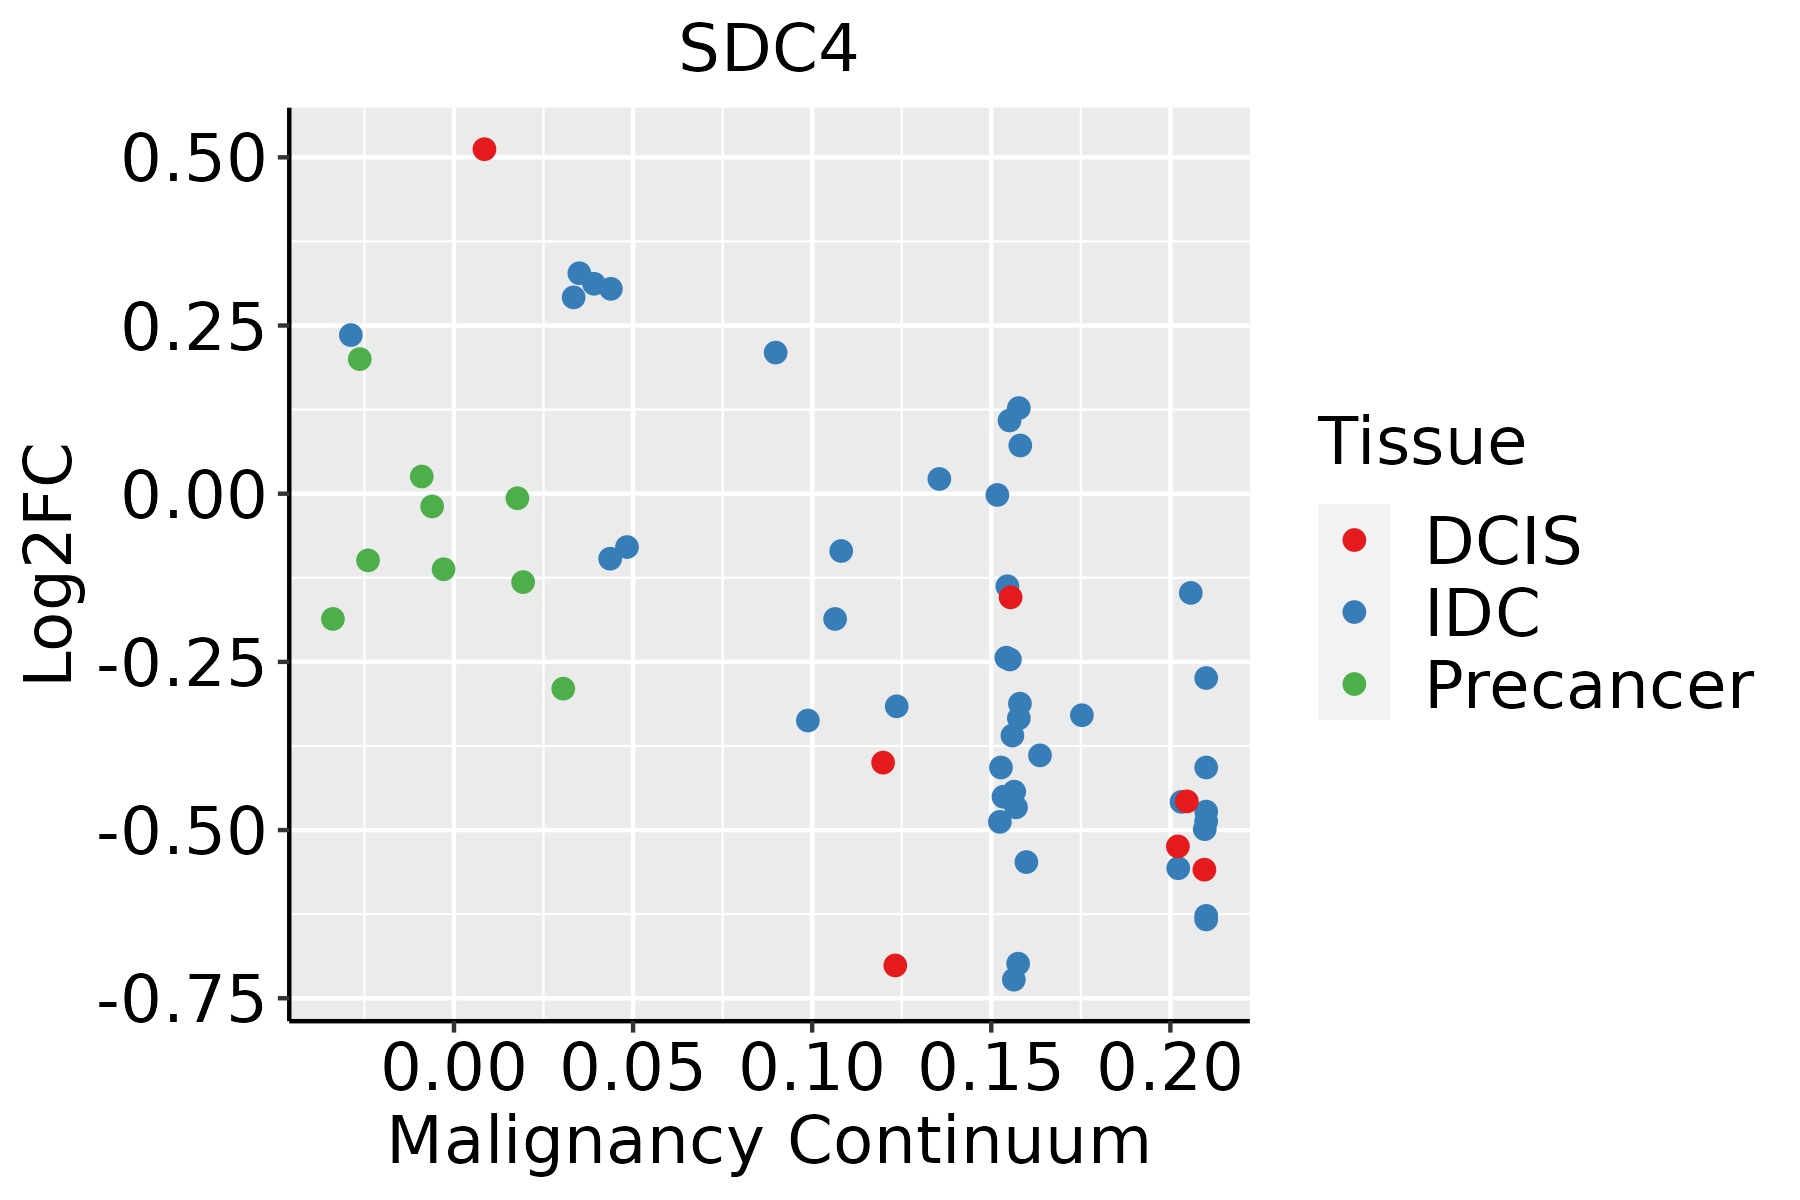 | IDC: Invasive ductal carcinoma |
| DCIS: Ductal carcinoma in situ | ||
| Precancer(BRCA1-mut): Precancerous lesion from BRCA1 mutation carriers | ||
| Cervix | 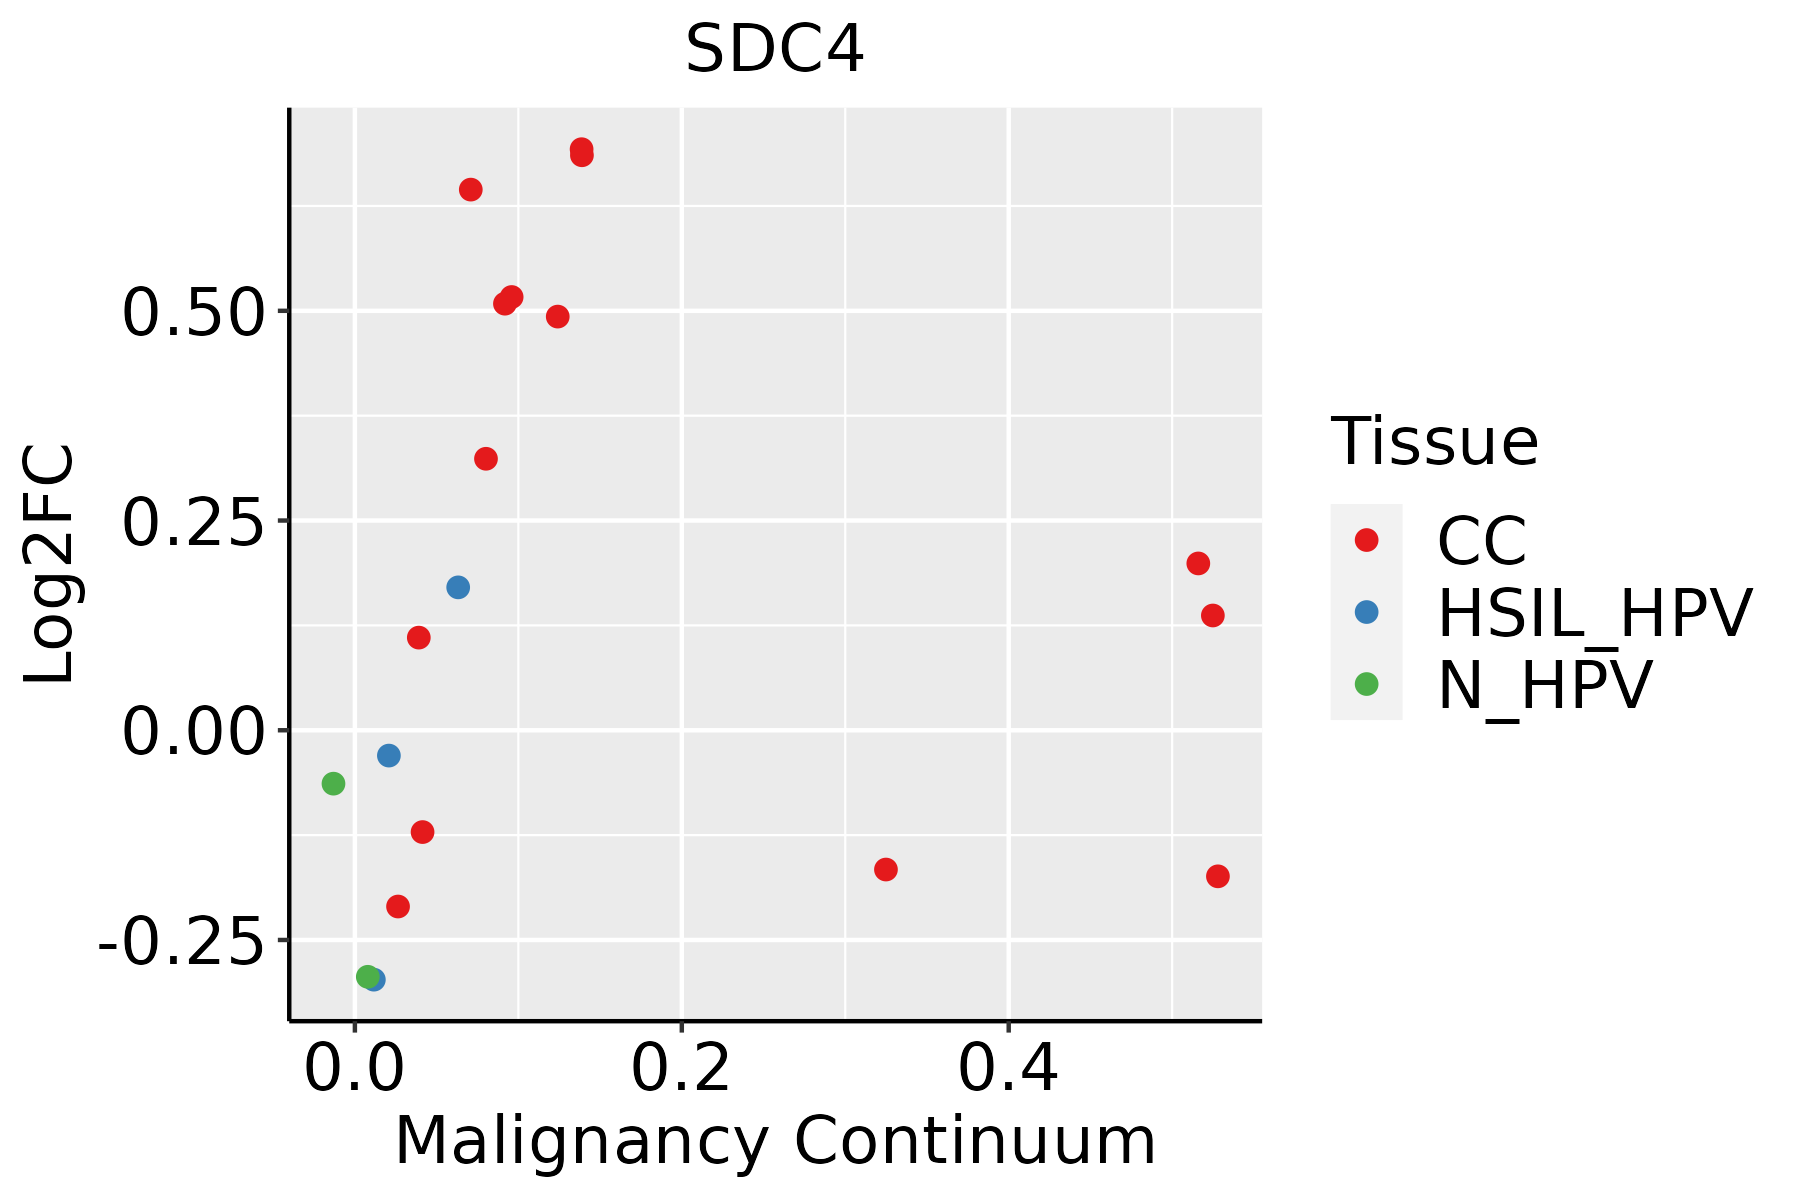 | CC: Cervix cancer |
| HSIL_HPV: HPV-infected high-grade squamous intraepithelial lesions | ||
| N_HPV: HPV-infected normal cervix | ||
| Colorectum (GSE201348) |  | FAP: Familial adenomatous polyposis |
| CRC: Colorectal cancer | ||
| Colorectum (HTA11) |  | AD: Adenomas |
| SER: Sessile serrated lesions | ||
| MSI-H: Microsatellite-high colorectal cancer | ||
| MSS: Microsatellite stable colorectal cancer | ||
| Esophagus |  | ESCC: Esophageal squamous cell carcinoma |
| HGIN: High-grade intraepithelial neoplasias | ||
| LGIN: Low-grade intraepithelial neoplasias | ||
| GC | 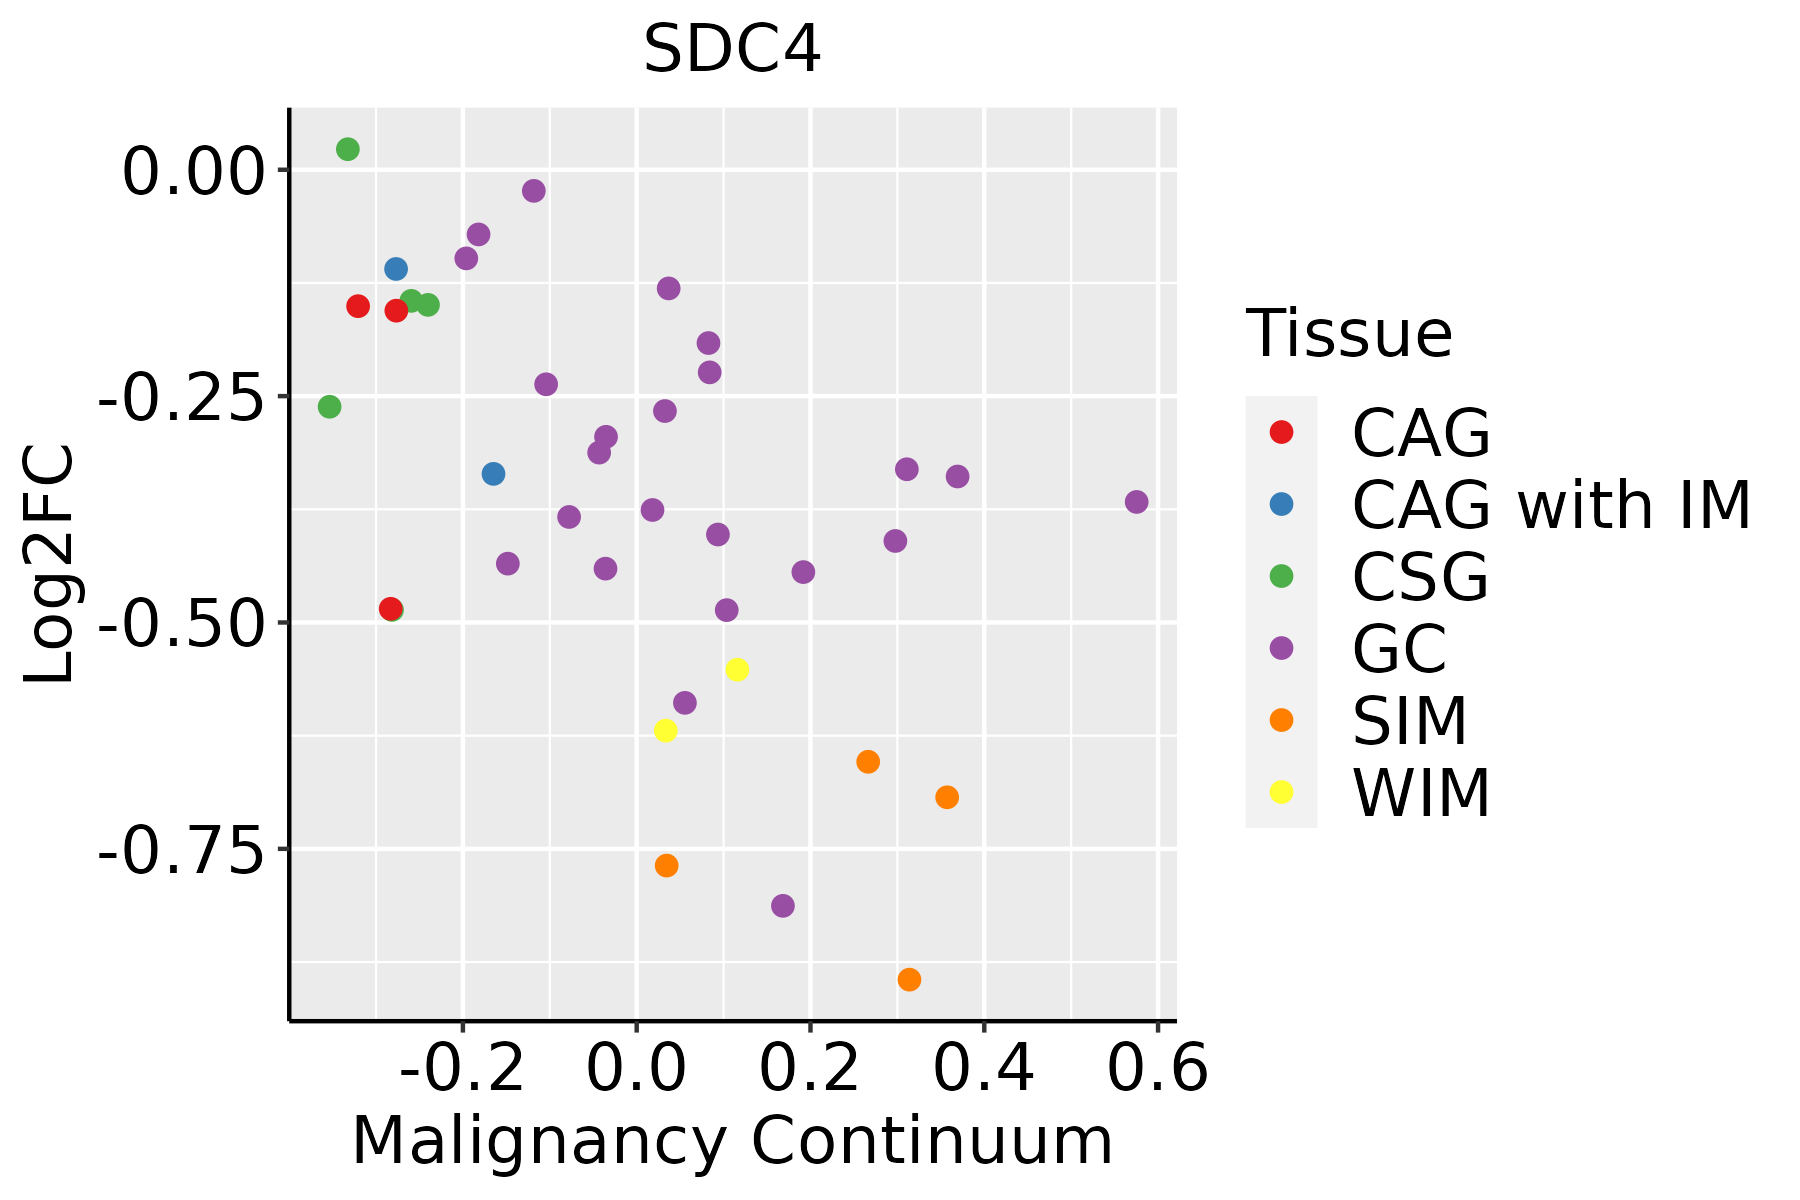 | CAG: Chronic atrophic gastritis |
| CAG with IM: Chronic atrophic gastritis with intestinal metaplasia | ||
| CSG: Chronic superficial gastritis | ||
| GC: Gastric cancer | ||
| SIM: Severe intestinal metaplasia | ||
| WIM: Wild intestinal metaplasia | ||
| Liver |  | HCC: Hepatocellular carcinoma |
| NAFLD: Non-alcoholic fatty liver disease | ||
| Lung |  | AAH: Atypical adenomatous hyperplasia |
| AIS: Adenocarcinoma in situ | ||
| IAC: Invasive lung adenocarcinoma | ||
| MIA: Minimally invasive adenocarcinoma | ||
| Oral Cavity | 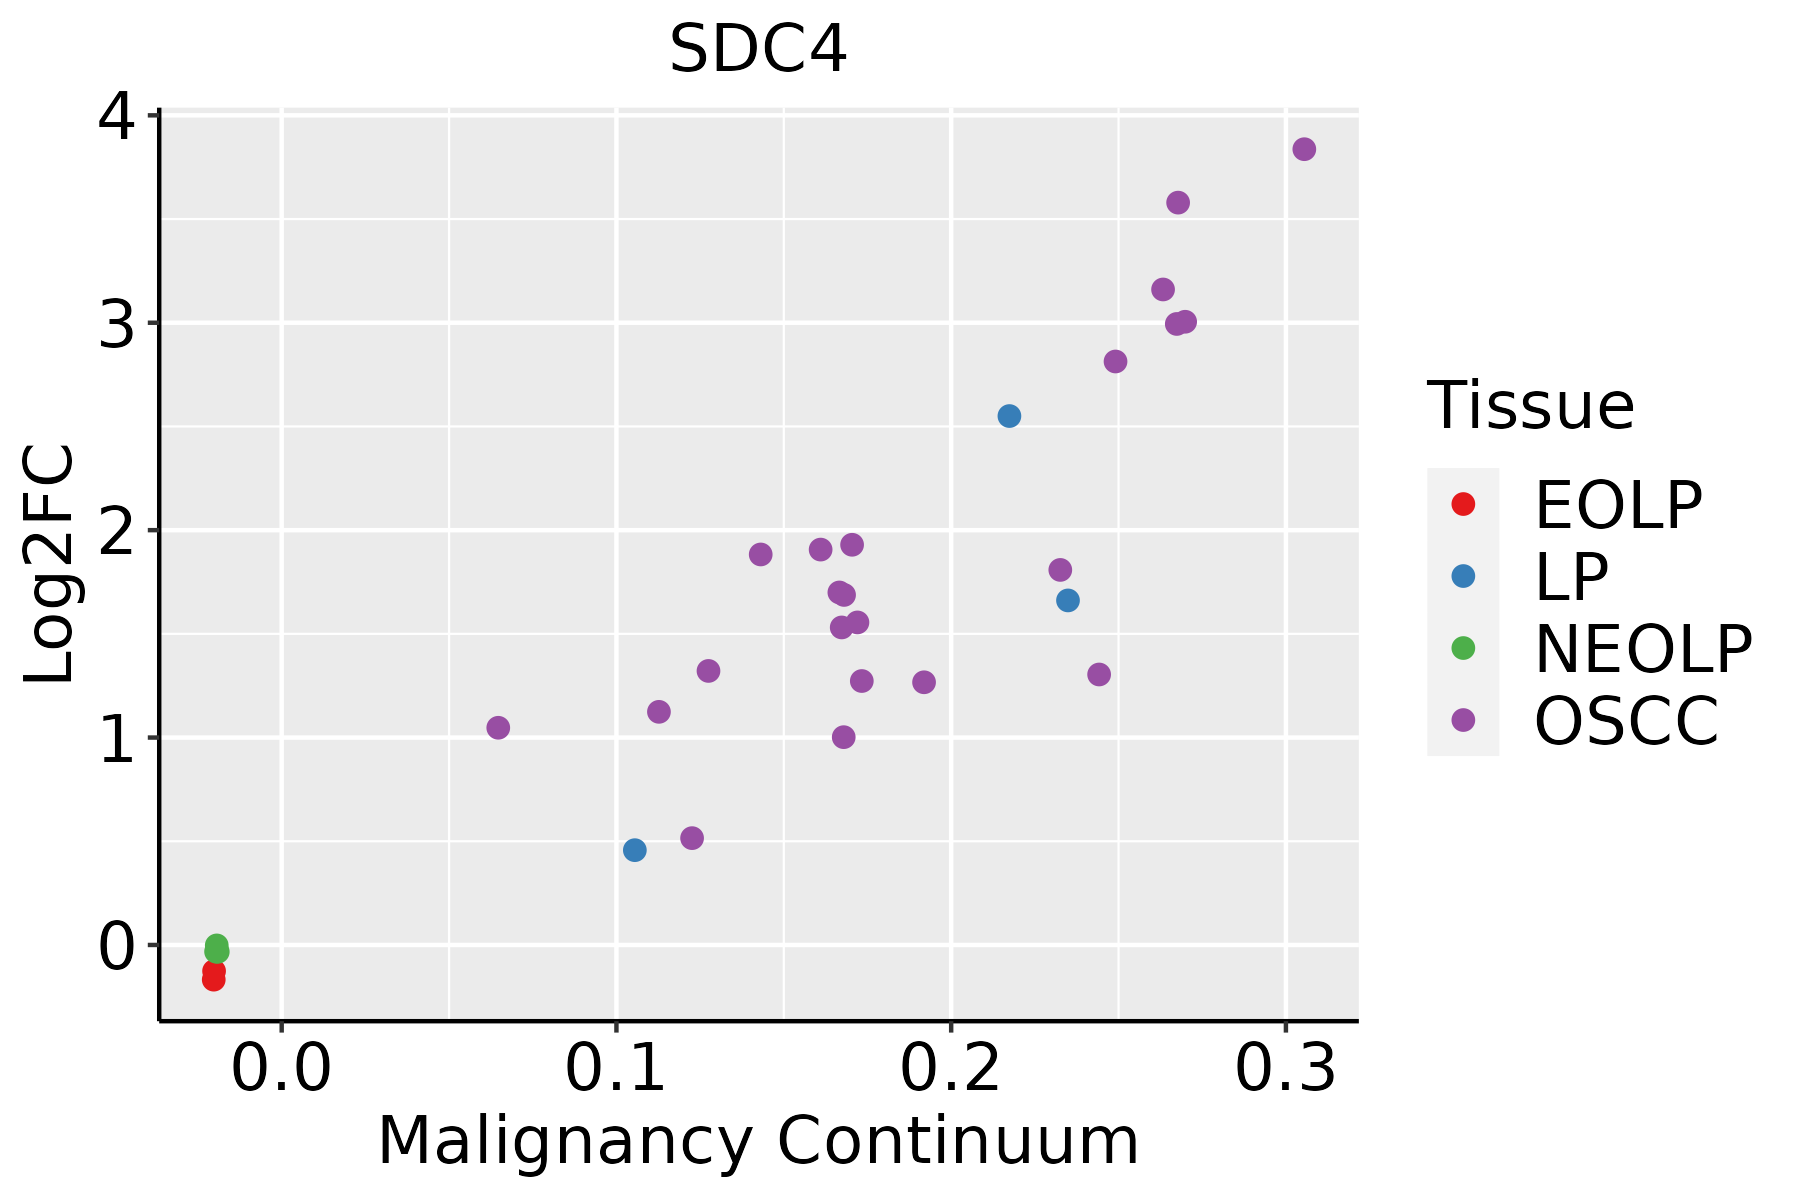 | EOLP: Erosive Oral lichen planus |
| LP: leukoplakia | ||
| NEOLP: Non-erosive oral lichen planus | ||
| OSCC: Oral squamous cell carcinoma | ||
| Prostate |  | BPH: Benign Prostatic Hyperplasia |
| Skin | 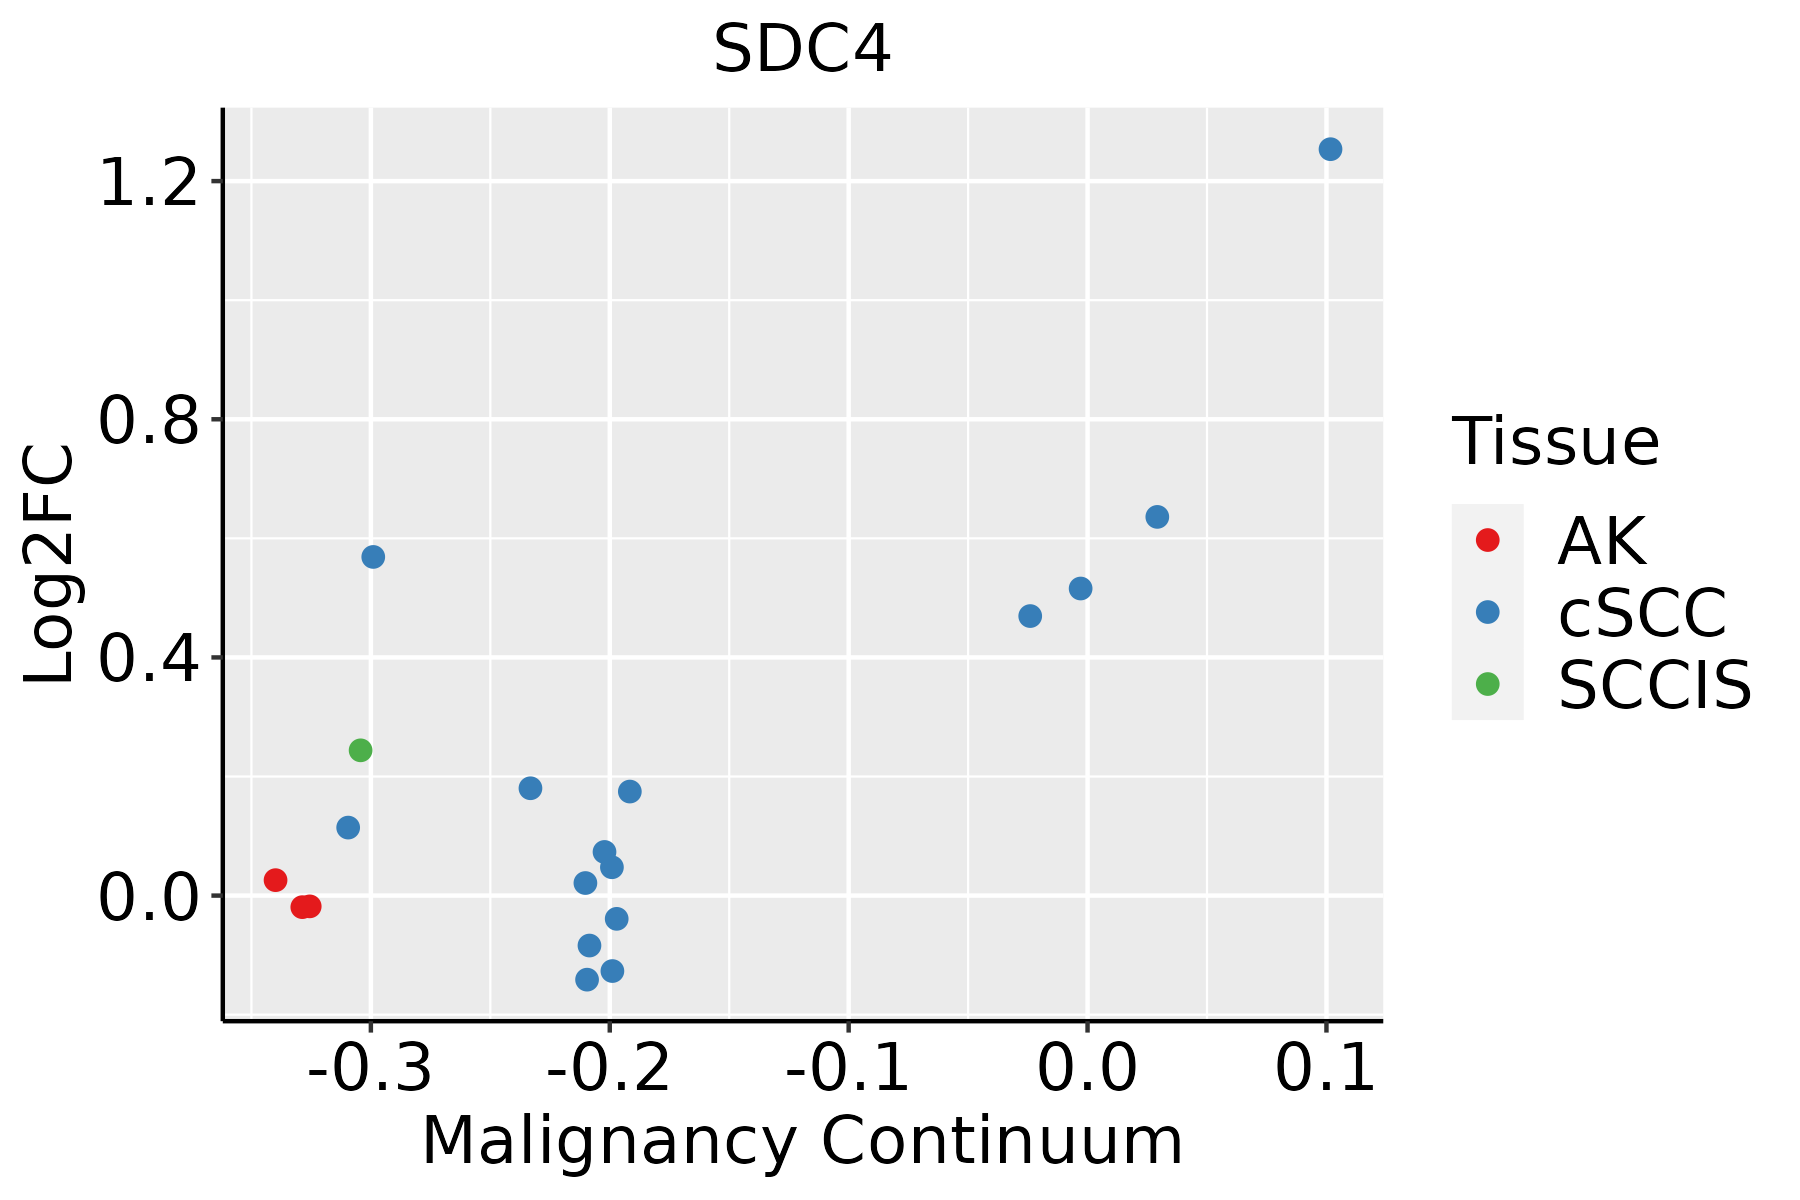 | AK: Actinic keratosis |
| cSCC: Cutaneous squamous cell carcinoma | ||
| SCCIS:squamous cell carcinoma in situ | ||
| Thyroid | 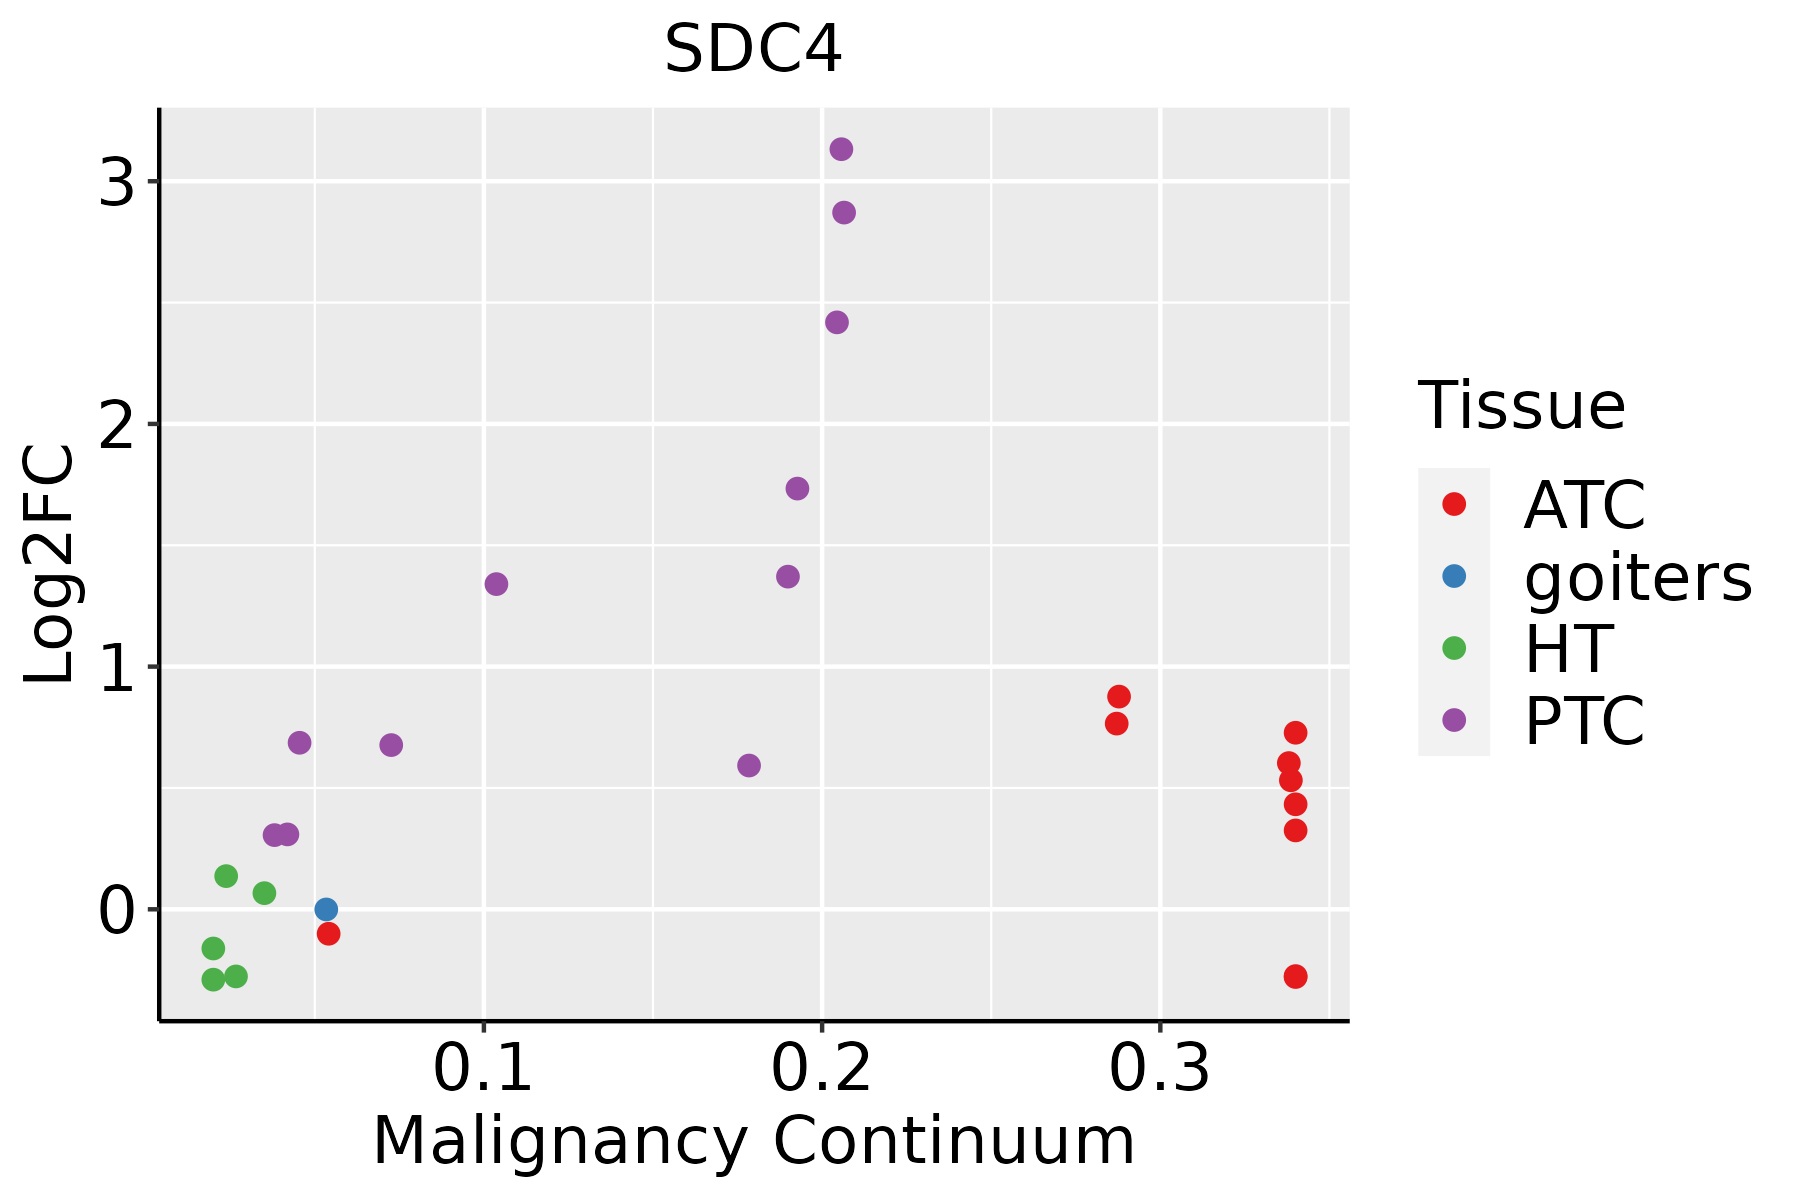 | ATC: Anaplastic thyroid cancer |
| HT: Hashimoto's thyroiditis | ||
| PTC: Papillary thyroid cancer |
| ∗log2FC in expression of this searched gene in stem-like cells from each diseased tissue sample relative to stem-like cells in normal samples in each tissue plotted against the malignancy continuum. Samples are colored based on if they are from different disease stage. |
Top |
Malignant transformation related pathway analysis |
| Find out the enriched GO biological processes and KEGG pathways involved in transition from healthy to precancer to cancer |
| Tissue | Disease Stage | Enriched GO biological Processes |
| Colorectum | AD |  |
| Colorectum | SER |  |
| Colorectum | MSS |  |
| Colorectum | MSI-H |  |
| Colorectum | FAP |  |
| ∗Top 15 enriched GO BP terms are showed in the bar plot of each disease state in each tissue. Each row represents a significant GO biological process which is colored according to the -log10(p.adjust). |
| Page: 1 2 3 4 5 6 7 8 9 |
| GO ID | Tissue | Disease Stage | Description | Gene Ratio | Bg Ratio | pvalue | p.adjust | Count |
| GO:01100204 | Colorectum | CRC | regulation of actomyosin structure organization | 24/2078 | 100/18723 | 1.93e-04 | 3.32e-03 | 24 |
| GO:00977344 | Colorectum | CRC | extracellular exosome biogenesis | 9/2078 | 21/18723 | 2.12e-04 | 3.56e-03 | 9 |
| GO:00336745 | Colorectum | CRC | positive regulation of kinase activity | 77/2078 | 467/18723 | 2.42e-04 | 4.00e-03 | 77 |
| GO:0001823 | Colorectum | CRC | mesonephros development | 23/2078 | 96/18723 | 2.68e-04 | 4.32e-03 | 23 |
| GO:0001657 | Colorectum | CRC | ureteric bud development | 22/2078 | 91/18723 | 3.14e-04 | 4.89e-03 | 22 |
| GO:00514923 | Colorectum | CRC | regulation of stress fiber assembly | 22/2078 | 91/18723 | 3.14e-04 | 4.89e-03 | 22 |
| GO:0072163 | Colorectum | CRC | mesonephric epithelium development | 22/2078 | 92/18723 | 3.71e-04 | 5.55e-03 | 22 |
| GO:0072164 | Colorectum | CRC | mesonephric tubule development | 22/2078 | 92/18723 | 3.71e-04 | 5.55e-03 | 22 |
| GO:01401124 | Colorectum | CRC | extracellular vesicle biogenesis | 9/2078 | 23/18723 | 4.80e-04 | 6.90e-03 | 9 |
| GO:00351483 | Colorectum | CRC | tube formation | 30/2078 | 148/18723 | 7.75e-04 | 9.87e-03 | 30 |
| GO:00219153 | Colorectum | CRC | neural tube development | 30/2078 | 152/18723 | 1.21e-03 | 1.38e-02 | 30 |
| GO:19035414 | Colorectum | CRC | regulation of exosomal secretion | 7/2078 | 17/18723 | 1.46e-03 | 1.57e-02 | 7 |
| GO:00018414 | Colorectum | CRC | neural tube formation | 22/2078 | 102/18723 | 1.62e-03 | 1.69e-02 | 22 |
| GO:00459214 | Colorectum | CRC | positive regulation of exocytosis | 19/2078 | 86/18723 | 2.44e-03 | 2.31e-02 | 19 |
| GO:00721753 | Colorectum | CRC | epithelial tube formation | 26/2078 | 132/18723 | 2.56e-03 | 2.40e-02 | 26 |
| GO:19035323 | Colorectum | CRC | positive regulation of secretion by cell | 47/2078 | 282/18723 | 2.91e-03 | 2.64e-02 | 47 |
| GO:00140203 | Colorectum | CRC | primary neural tube formation | 20/2078 | 94/18723 | 3.05e-03 | 2.72e-02 | 20 |
| GO:00322334 | Colorectum | CRC | positive regulation of actin filament bundle assembly | 15/2078 | 63/18723 | 3.16e-03 | 2.78e-02 | 15 |
| GO:19018883 | Colorectum | CRC | regulation of cell junction assembly | 36/2078 | 204/18723 | 3.30e-03 | 2.84e-02 | 36 |
| GO:00018383 | Colorectum | CRC | embryonic epithelial tube formation | 24/2078 | 121/18723 | 3.33e-03 | 2.85e-02 | 24 |
| Page: 1 2 3 4 5 6 7 8 9 10 11 12 13 14 15 16 17 18 19 20 21 22 23 24 25 26 27 28 29 30 31 32 33 34 35 36 37 38 39 40 41 42 43 44 45 46 47 48 49 50 51 52 53 54 55 56 57 58 59 60 61 62 63 64 65 66 67 68 69 70 71 72 73 74 75 76 77 78 79 |
| Pathway ID | Tissue | Disease Stage | Description | Gene Ratio | Bg Ratio | pvalue | p.adjust | qvalue | Count |
| hsa0541818 | Breast | Precancer | Fluid shear stress and atherosclerosis | 28/684 | 139/8465 | 4.74e-06 | 6.00e-05 | 4.59e-05 | 28 |
| hsa0520514 | Breast | Precancer | Proteoglycans in cancer | 30/684 | 205/8465 | 1.00e-03 | 7.18e-03 | 5.50e-03 | 30 |
| hsa0541819 | Breast | Precancer | Fluid shear stress and atherosclerosis | 28/684 | 139/8465 | 4.74e-06 | 6.00e-05 | 4.59e-05 | 28 |
| hsa0520515 | Breast | Precancer | Proteoglycans in cancer | 30/684 | 205/8465 | 1.00e-03 | 7.18e-03 | 5.50e-03 | 30 |
| hsa0541824 | Breast | IDC | Fluid shear stress and atherosclerosis | 34/867 | 139/8465 | 9.41e-07 | 1.61e-05 | 1.20e-05 | 34 |
| hsa0520523 | Breast | IDC | Proteoglycans in cancer | 42/867 | 205/8465 | 7.69e-06 | 9.99e-05 | 7.48e-05 | 42 |
| hsa0541834 | Breast | IDC | Fluid shear stress and atherosclerosis | 34/867 | 139/8465 | 9.41e-07 | 1.61e-05 | 1.20e-05 | 34 |
| hsa0520533 | Breast | IDC | Proteoglycans in cancer | 42/867 | 205/8465 | 7.69e-06 | 9.99e-05 | 7.48e-05 | 42 |
| hsa0541844 | Breast | DCIS | Fluid shear stress and atherosclerosis | 34/846 | 139/8465 | 5.31e-07 | 9.03e-06 | 6.65e-06 | 34 |
| hsa0520542 | Breast | DCIS | Proteoglycans in cancer | 39/846 | 205/8465 | 5.36e-05 | 5.58e-04 | 4.11e-04 | 39 |
| hsa0541854 | Breast | DCIS | Fluid shear stress and atherosclerosis | 34/846 | 139/8465 | 5.31e-07 | 9.03e-06 | 6.65e-06 | 34 |
| hsa0520552 | Breast | DCIS | Proteoglycans in cancer | 39/846 | 205/8465 | 5.36e-05 | 5.58e-04 | 4.11e-04 | 39 |
| hsa0541820 | Cervix | CC | Fluid shear stress and atherosclerosis | 50/1267 | 139/8465 | 5.71e-10 | 1.32e-08 | 7.81e-09 | 50 |
| hsa0520516 | Cervix | CC | Proteoglycans in cancer | 60/1267 | 205/8465 | 9.13e-08 | 1.18e-06 | 7.00e-07 | 60 |
| hsa045147 | Cervix | CC | Cell adhesion molecules | 36/1267 | 157/8465 | 4.94e-03 | 1.67e-02 | 9.86e-03 | 36 |
| hsa05418110 | Cervix | CC | Fluid shear stress and atherosclerosis | 50/1267 | 139/8465 | 5.71e-10 | 1.32e-08 | 7.81e-09 | 50 |
| hsa0520517 | Cervix | CC | Proteoglycans in cancer | 60/1267 | 205/8465 | 9.13e-08 | 1.18e-06 | 7.00e-07 | 60 |
| hsa0451412 | Cervix | CC | Cell adhesion molecules | 36/1267 | 157/8465 | 4.94e-03 | 1.67e-02 | 9.86e-03 | 36 |
| hsa0451421 | Cervix | HSIL_HPV | Cell adhesion molecules | 20/459 | 157/8465 | 3.03e-04 | 3.06e-03 | 2.47e-03 | 20 |
| hsa045124 | Cervix | HSIL_HPV | ECM-receptor interaction | 12/459 | 89/8465 | 2.95e-03 | 1.88e-02 | 1.52e-02 | 12 |
| Page: 1 2 3 4 5 6 |
Top |
Cell-cell communication analysis |
| Identification of potential cell-cell interactions between two cell types and their ligand-receptor pairs for different disease states |
| Ligand | Receptor | LRpair | Pathway | Tissue | Disease Stage |
| COL1A1 | SDC4 | COL1A1_SDC4 | COLLAGEN | Breast | ADJ |
| COL1A2 | SDC4 | COL1A2_SDC4 | COLLAGEN | Breast | ADJ |
| COL4A1 | SDC4 | COL4A1_SDC4 | COLLAGEN | Breast | ADJ |
| COL4A2 | SDC4 | COL4A2_SDC4 | COLLAGEN | Breast | ADJ |
| COL6A1 | SDC4 | COL6A1_SDC4 | COLLAGEN | Breast | ADJ |
| COL6A2 | SDC4 | COL6A2_SDC4 | COLLAGEN | Breast | ADJ |
| COL6A3 | SDC4 | COL6A3_SDC4 | COLLAGEN | Breast | ADJ |
| THBS1 | SDC4 | THBS1_SDC4 | THBS | Breast | ADJ |
| THBS2 | SDC4 | THBS2_SDC4 | THBS | Breast | ADJ |
| ANGPTL4 | SDC4 | ANGPTL4_SDC4 | ANGPTL | Breast | ADJ |
| MDK | SDC4 | MDK_SDC4 | MK | Breast | ADJ |
| FN1 | SDC4 | FN1_SDC4 | FN1 | Breast | ADJ |
| TNC | SDC4 | TNC_SDC4 | TENASCIN | Breast | ADJ |
| TNXB | SDC4 | TNXB_SDC4 | TENASCIN | Breast | ADJ |
| COL1A1 | SDC4 | COL1A1_SDC4 | COLLAGEN | Breast | DCIS |
| COL1A2 | SDC4 | COL1A2_SDC4 | COLLAGEN | Breast | DCIS |
| COL4A1 | SDC4 | COL4A1_SDC4 | COLLAGEN | Breast | DCIS |
| COL4A2 | SDC4 | COL4A2_SDC4 | COLLAGEN | Breast | DCIS |
| COL6A1 | SDC4 | COL6A1_SDC4 | COLLAGEN | Breast | DCIS |
| COL6A2 | SDC4 | COL6A2_SDC4 | COLLAGEN | Breast | DCIS |
| Page: 1 |
Top |
Single-cell gene regulatory network inference analysis |
| Find out the significant the regulons (TFs) and the target genes of each regulon across cell types for different disease states |
| TF | Cell Type | Tissue | Disease Stage | Target Gene | RSS | Regulon Activity |
| ∗The dot plots of a searched regulon are shown for all cell subpopulations in each disease state of each tissue based on the regulon specific score inferred using pySCENIC and by calculating the average expression. |
| Page: 1 |
Top |
Somatic mutation of malignant transformation related genes |
| Annotation of somatic variants for genes involved in malignant transformation |
| Hugo Symbol | Variant Class | Variant Classification | dbSNP RS | HGVSc | HGVSp | HGVSp Short | SWISSPROT | BIOTYPE | SIFT | PolyPhen | Tumor Sample Barcode | Tissue | Histology | Sex | Age | Stage | Therapy Types | Drugs | Outcome |
| SDC4 | SNV | Missense_Mutation | c.181N>A | p.Ser61Thr | p.S61T | P31431 | protein_coding | deleterious(0.04) | probably_damaging(0.994) | TCGA-A8-A09Z-01 | Breast | breast invasive carcinoma | Female | >=65 | I/II | Unknown | Unknown | SD | |
| SDC4 | SNV | Missense_Mutation | c.74N>G | p.Glu25Gly | p.E25G | P31431 | protein_coding | deleterious(0) | probably_damaging(0.997) | TCGA-AZ-6601-01 | Colorectum | colon adenocarcinoma | Male | >=65 | I/II | Unknown | Unknown | PD | |
| SDC4 | SNV | Missense_Mutation | rs201484099 | c.592N>A | p.Ala198Thr | p.A198T | P31431 | protein_coding | deleterious(0) | probably_damaging(0.997) | TCGA-A5-A1OF-01 | Endometrium | uterine corpus endometrioid carcinoma | Female | <65 | I/II | Unknown | Unknown | SD |
| SDC4 | SNV | Missense_Mutation | rs750355782 | c.431N>T | p.Thr144Met | p.T144M | P31431 | protein_coding | deleterious(0.05) | probably_damaging(0.99) | TCGA-A5-A1OF-01 | Endometrium | uterine corpus endometrioid carcinoma | Female | <65 | I/II | Unknown | Unknown | SD |
| SDC4 | SNV | Missense_Mutation | novel | c.517N>G | p.Lys173Glu | p.K173E | P31431 | protein_coding | deleterious(0) | probably_damaging(0.989) | TCGA-AX-A06F-01 | Endometrium | uterine corpus endometrioid carcinoma | Female | <65 | III/IV | Chemotherapy | carboplatin | SD |
| SDC4 | SNV | Missense_Mutation | c.552N>T | p.Lys184Asn | p.K184N | P31431 | protein_coding | deleterious(0) | probably_damaging(0.998) | TCGA-AX-A0J0-01 | Endometrium | uterine corpus endometrioid carcinoma | Female | <65 | I/II | Unknown | Unknown | SD | |
| SDC4 | SNV | Missense_Mutation | novel | c.97N>A | p.Leu33Ile | p.L33I | P31431 | protein_coding | tolerated(0.2) | possibly_damaging(0.551) | TCGA-B5-A1MX-01 | Endometrium | uterine corpus endometrioid carcinoma | Female | <65 | I/II | Hormone Therapy | megace | SD |
| SDC4 | SNV | Missense_Mutation | c.287G>A | p.Gly96Glu | p.G96E | P31431 | protein_coding | tolerated(0.28) | benign(0.03) | TCGA-BS-A0U8-01 | Endometrium | uterine corpus endometrioid carcinoma | Female | <65 | III/IV | Chemotherapy | doxorubicin | SD | |
| SDC4 | SNV | Missense_Mutation | novel | c.344N>T | p.Arg115Ile | p.R115I | P31431 | protein_coding | deleterious(0.01) | possibly_damaging(0.773) | TCGA-BS-A0UV-01 | Endometrium | uterine corpus endometrioid carcinoma | Female | <65 | III/IV | Unknown | Unknown | SD |
| SDC4 | SNV | Missense_Mutation | novel | c.104G>A | p.Gly35Asp | p.G35D | P31431 | protein_coding | tolerated(0.2) | benign(0.003) | TCGA-D1-A2G0-01 | Endometrium | uterine corpus endometrioid carcinoma | Female | >=65 | I/II | Unknown | Unknown | SD |
| Page: 1 2 |
Top |
Related drugs of malignant transformation related genes |
| Identification of chemicals and drugs interact with genes involved in malignant transfromation |
| (DGIdb 4.0) |
| Entrez ID | Symbol | Category | Interaction Types | Drug Claim Name | Drug Name | PMIDs |
| Page: 1 |

Copyright 2023-Present -The University of Texas Health Science Center at Houston |