
|
|||||
|
 | |
| |
| |
| |
| |
| |
|
Gene: S100A9 |
Gene summary for S100A9 |
| Gene information | Species | Human | Gene symbol | S100A9 | Gene ID | 6280 |
| Gene name | S100 calcium binding protein A9 | |
| Gene Alias | 60B8AG | |
| Cytomap | 1q21.3 | |
| Gene Type | protein-coding | GO ID | GO:0001558 | UniProtAcc | P06702 |
Top |
Malignant transformation analysis |
| Identification of the aberrant gene expression in precancerous and cancerous lesions by comparing the gene expression of stem-like cells in diseased tissues with normal stem cells |
| Entrez ID | Symbol | Replicates | Species | Organ | Tissue | Adj P-value | Log2FC | Malignancy |
| 6280 | S100A9 | GSM4909281 | Human | Breast | IDC | 5.40e-04 | -5.69e-01 | 0.21 |
| 6280 | S100A9 | GSM4909282 | Human | Breast | IDC | 1.96e-25 | 3.92e-01 | -0.0288 |
| 6280 | S100A9 | GSM4909285 | Human | Breast | IDC | 8.51e-06 | -6.47e-01 | 0.21 |
| 6280 | S100A9 | GSM4909286 | Human | Breast | IDC | 2.52e-23 | -8.00e-01 | 0.1081 |
| 6280 | S100A9 | GSM4909290 | Human | Breast | IDC | 1.38e-13 | 4.63e-01 | 0.2096 |
| 6280 | S100A9 | GSM4909291 | Human | Breast | IDC | 1.08e-04 | -7.08e-01 | 0.1753 |
| 6280 | S100A9 | GSM4909293 | Human | Breast | IDC | 9.60e-13 | -7.23e-01 | 0.1581 |
| 6280 | S100A9 | GSM4909296 | Human | Breast | IDC | 1.55e-04 | -6.09e-01 | 0.1524 |
| 6280 | S100A9 | GSM4909297 | Human | Breast | IDC | 4.02e-21 | -7.75e-01 | 0.1517 |
| 6280 | S100A9 | GSM4909298 | Human | Breast | IDC | 1.18e-18 | -7.87e-01 | 0.1551 |
| 6280 | S100A9 | GSM4909300 | Human | Breast | IDC | 1.06e-07 | 4.86e-01 | 0.0334 |
| 6280 | S100A9 | GSM4909301 | Human | Breast | IDC | 9.03e-20 | -7.93e-01 | 0.1577 |
| 6280 | S100A9 | GSM4909302 | Human | Breast | IDC | 1.25e-07 | -6.66e-01 | 0.1545 |
| 6280 | S100A9 | GSM4909303 | Human | Breast | IDC | 2.40e-02 | -7.57e-01 | 0.0438 |
| 6280 | S100A9 | GSM4909304 | Human | Breast | IDC | 3.61e-19 | -7.81e-01 | 0.1636 |
| 6280 | S100A9 | GSM4909305 | Human | Breast | IDC | 3.13e-02 | -4.63e-01 | 0.0436 |
| 6280 | S100A9 | GSM4909306 | Human | Breast | IDC | 2.82e-10 | -6.82e-01 | 0.1564 |
| 6280 | S100A9 | GSM4909307 | Human | Breast | IDC | 5.68e-14 | -7.42e-01 | 0.1569 |
| 6280 | S100A9 | GSM4909308 | Human | Breast | IDC | 1.63e-15 | -7.96e-01 | 0.158 |
| 6280 | S100A9 | GSM4909311 | Human | Breast | IDC | 2.20e-11 | -6.85e-01 | 0.1534 |
| Page: 1 2 3 4 5 6 7 8 9 |
| Tissue | Expression Dynamics | Abbreviation |
| Breast | 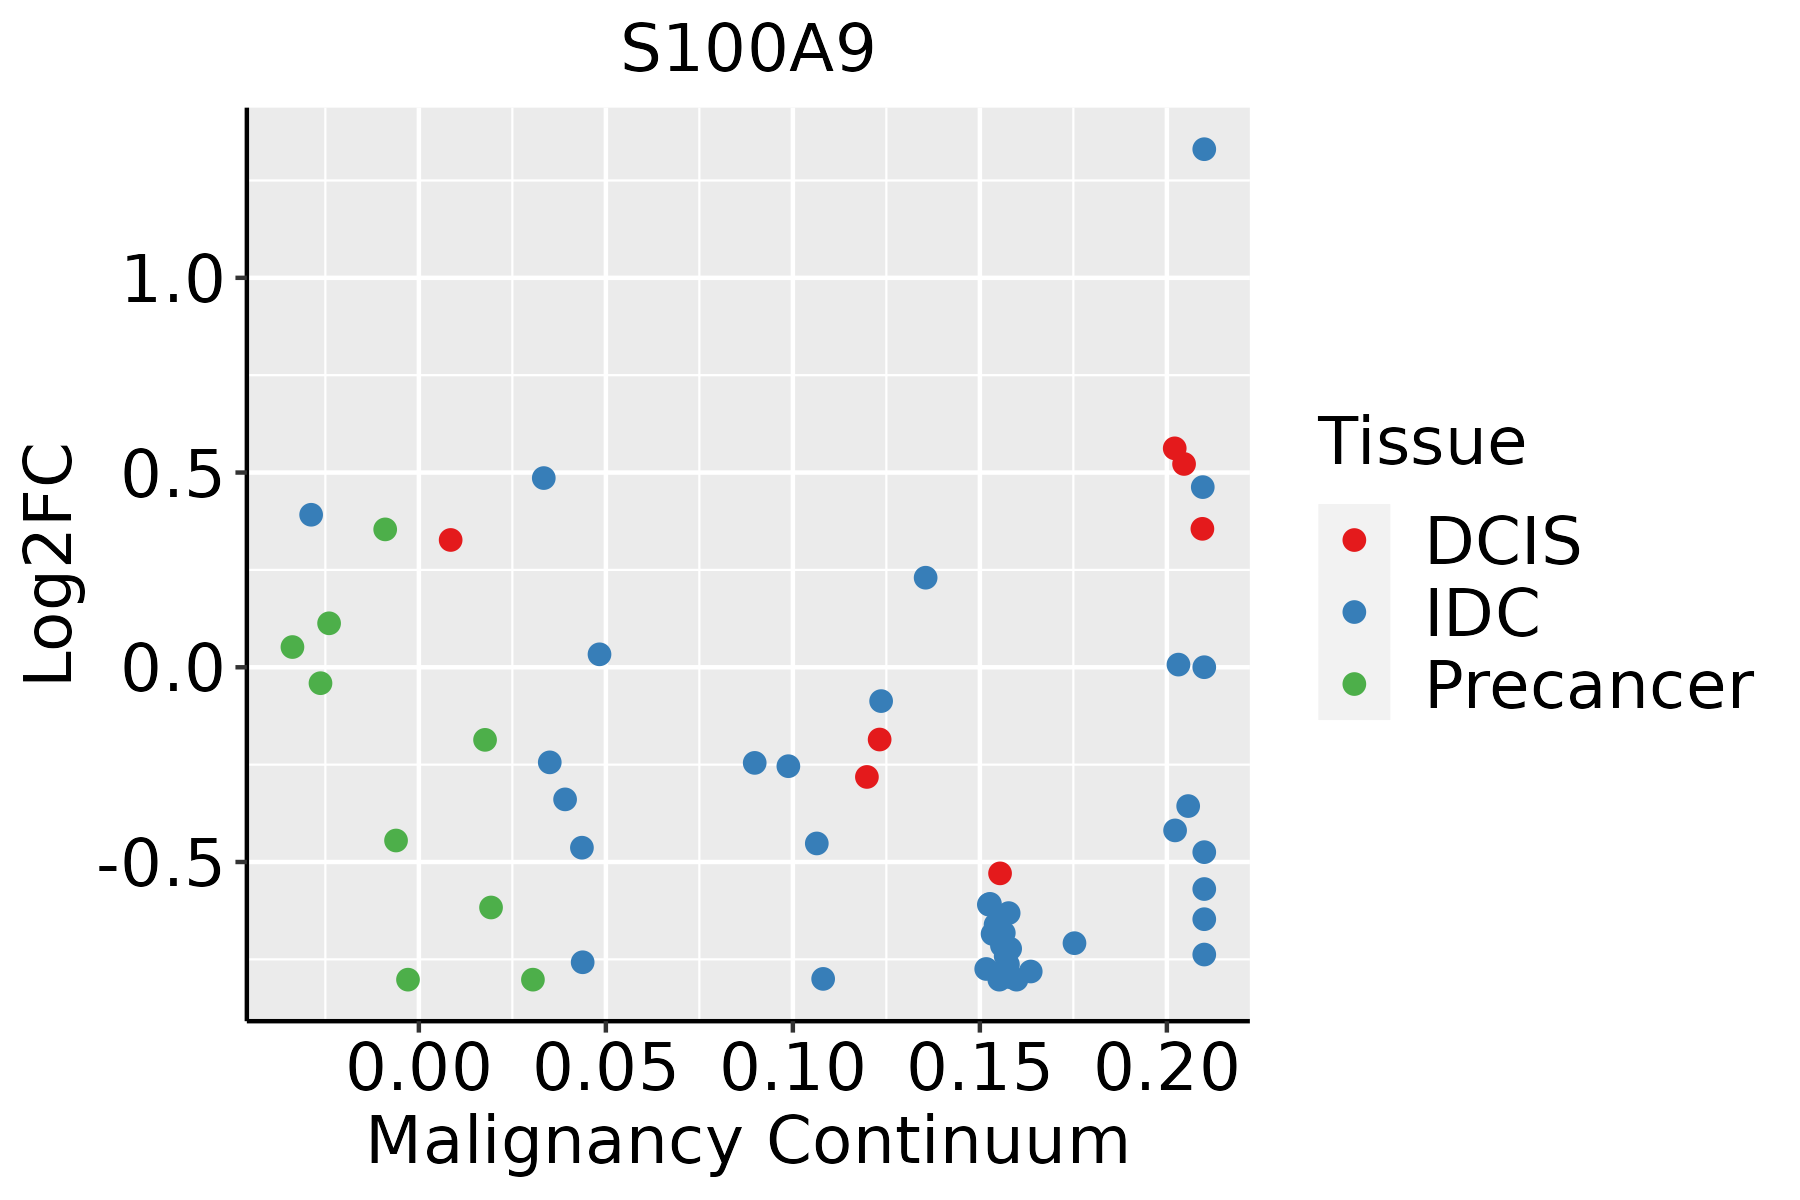 | IDC: Invasive ductal carcinoma |
| DCIS: Ductal carcinoma in situ | ||
| Precancer(BRCA1-mut): Precancerous lesion from BRCA1 mutation carriers | ||
| Cervix | 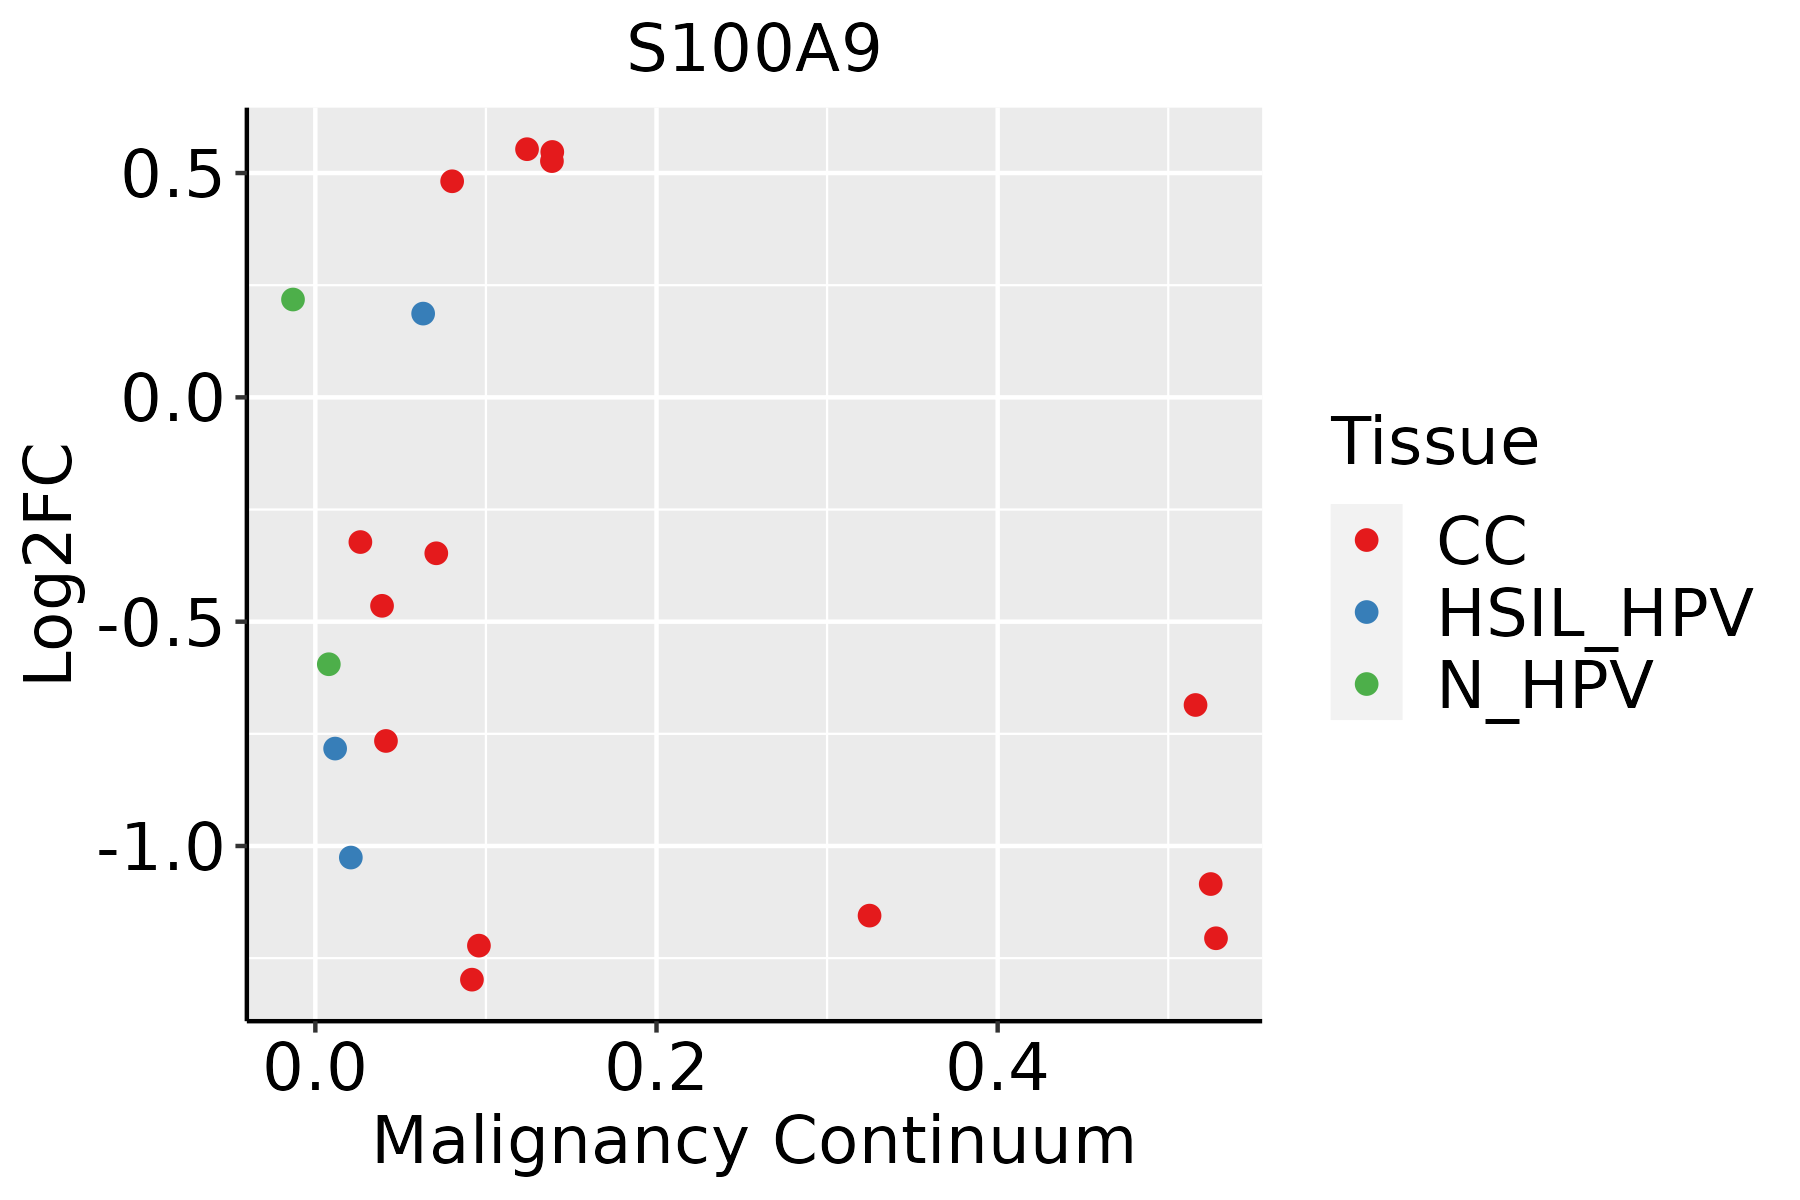 | CC: Cervix cancer |
| HSIL_HPV: HPV-infected high-grade squamous intraepithelial lesions | ||
| N_HPV: HPV-infected normal cervix | ||
| Endometrium | 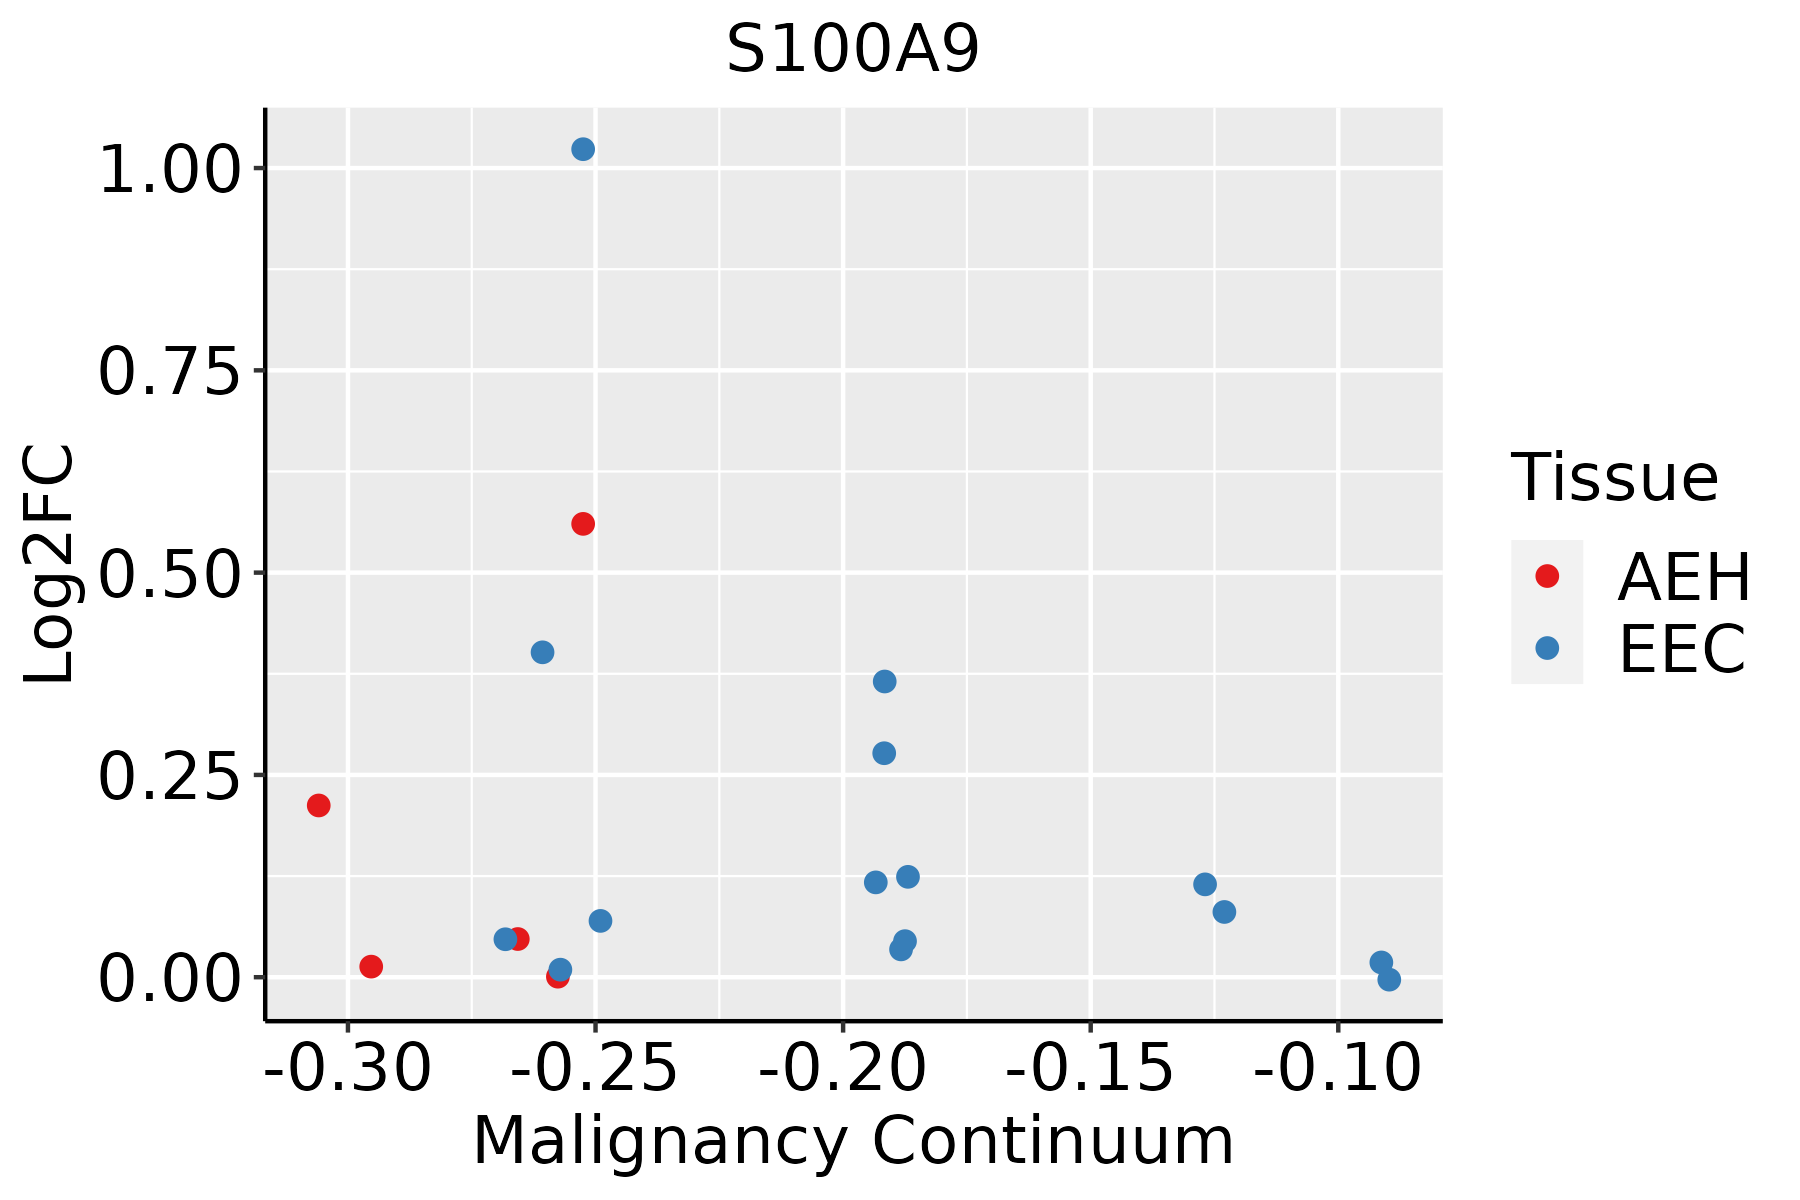 | AEH: Atypical endometrial hyperplasia |
| EEC: Endometrioid Cancer | ||
| Esophagus |  | ESCC: Esophageal squamous cell carcinoma |
| HGIN: High-grade intraepithelial neoplasias | ||
| LGIN: Low-grade intraepithelial neoplasias | ||
| Liver | 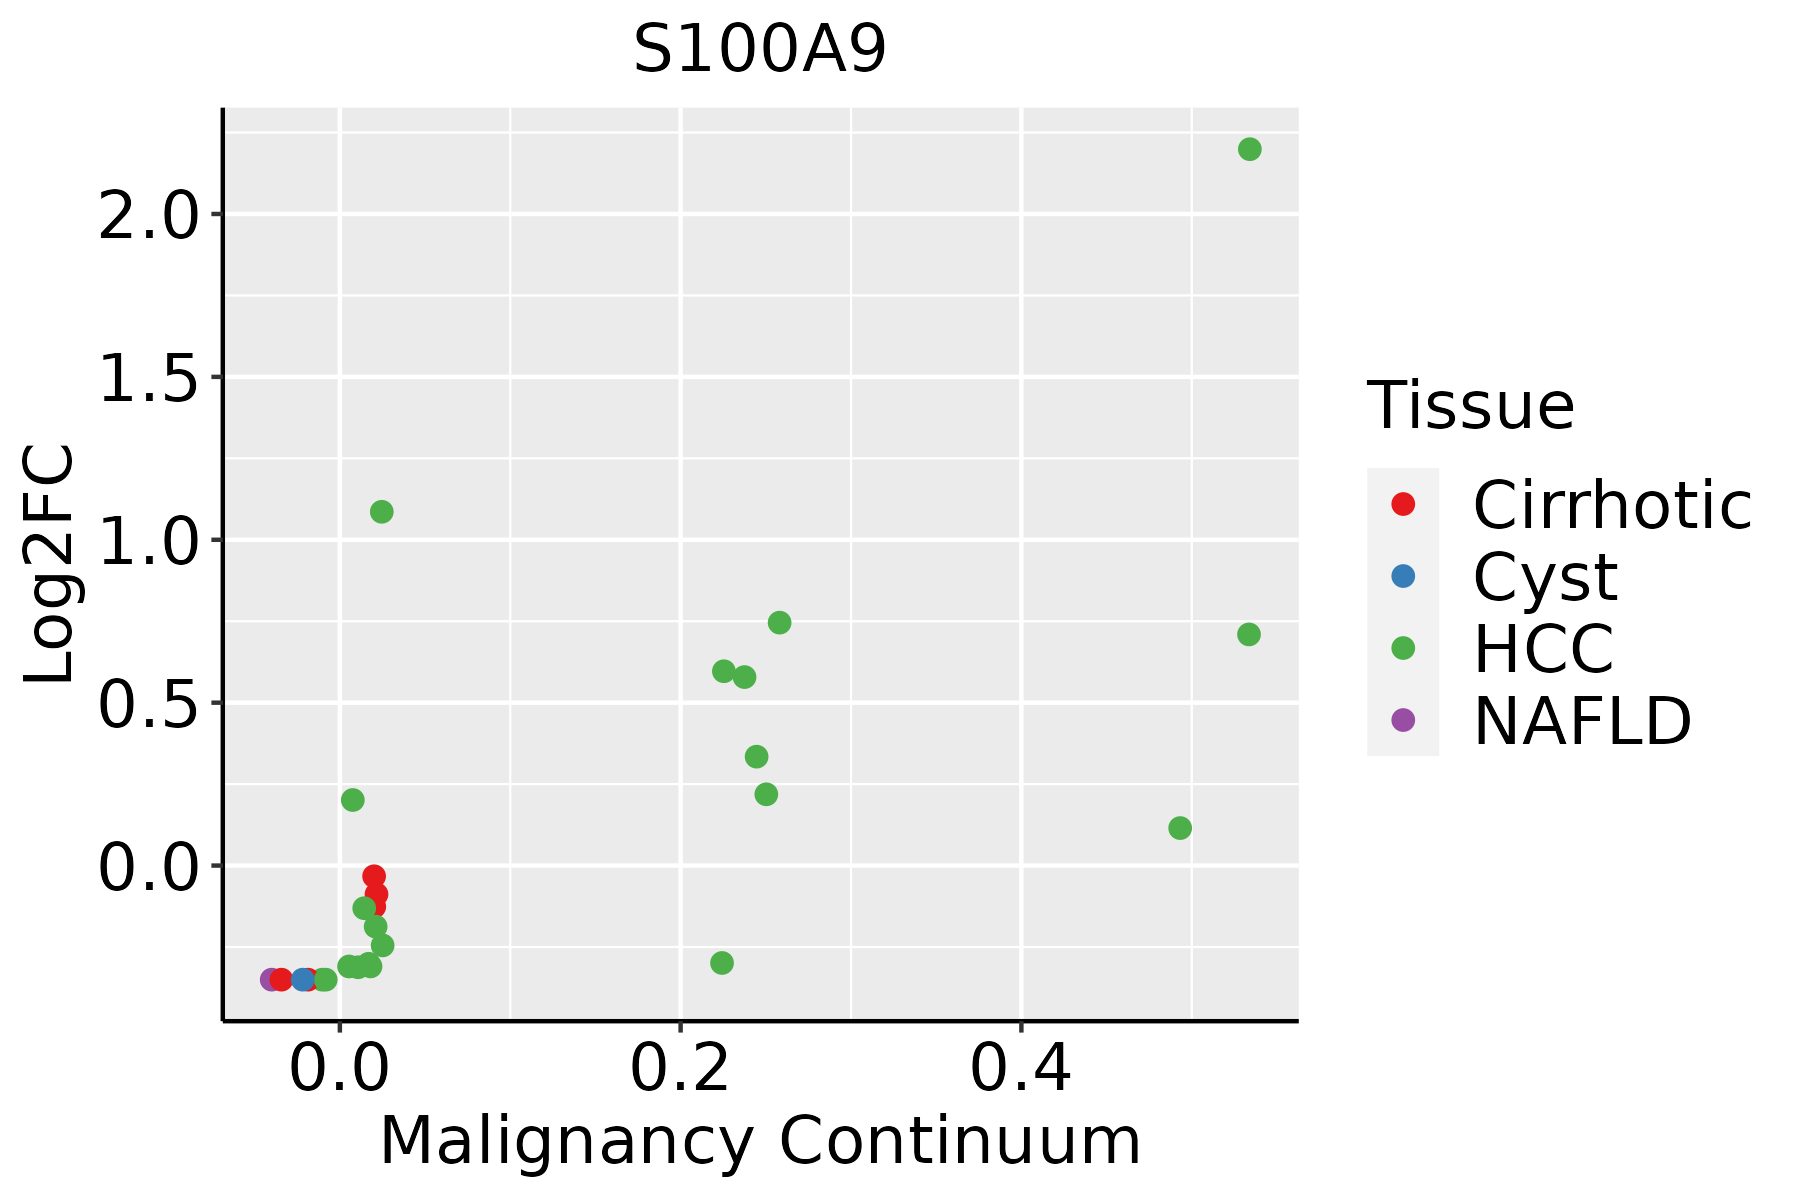 | HCC: Hepatocellular carcinoma |
| NAFLD: Non-alcoholic fatty liver disease | ||
| Oral Cavity | 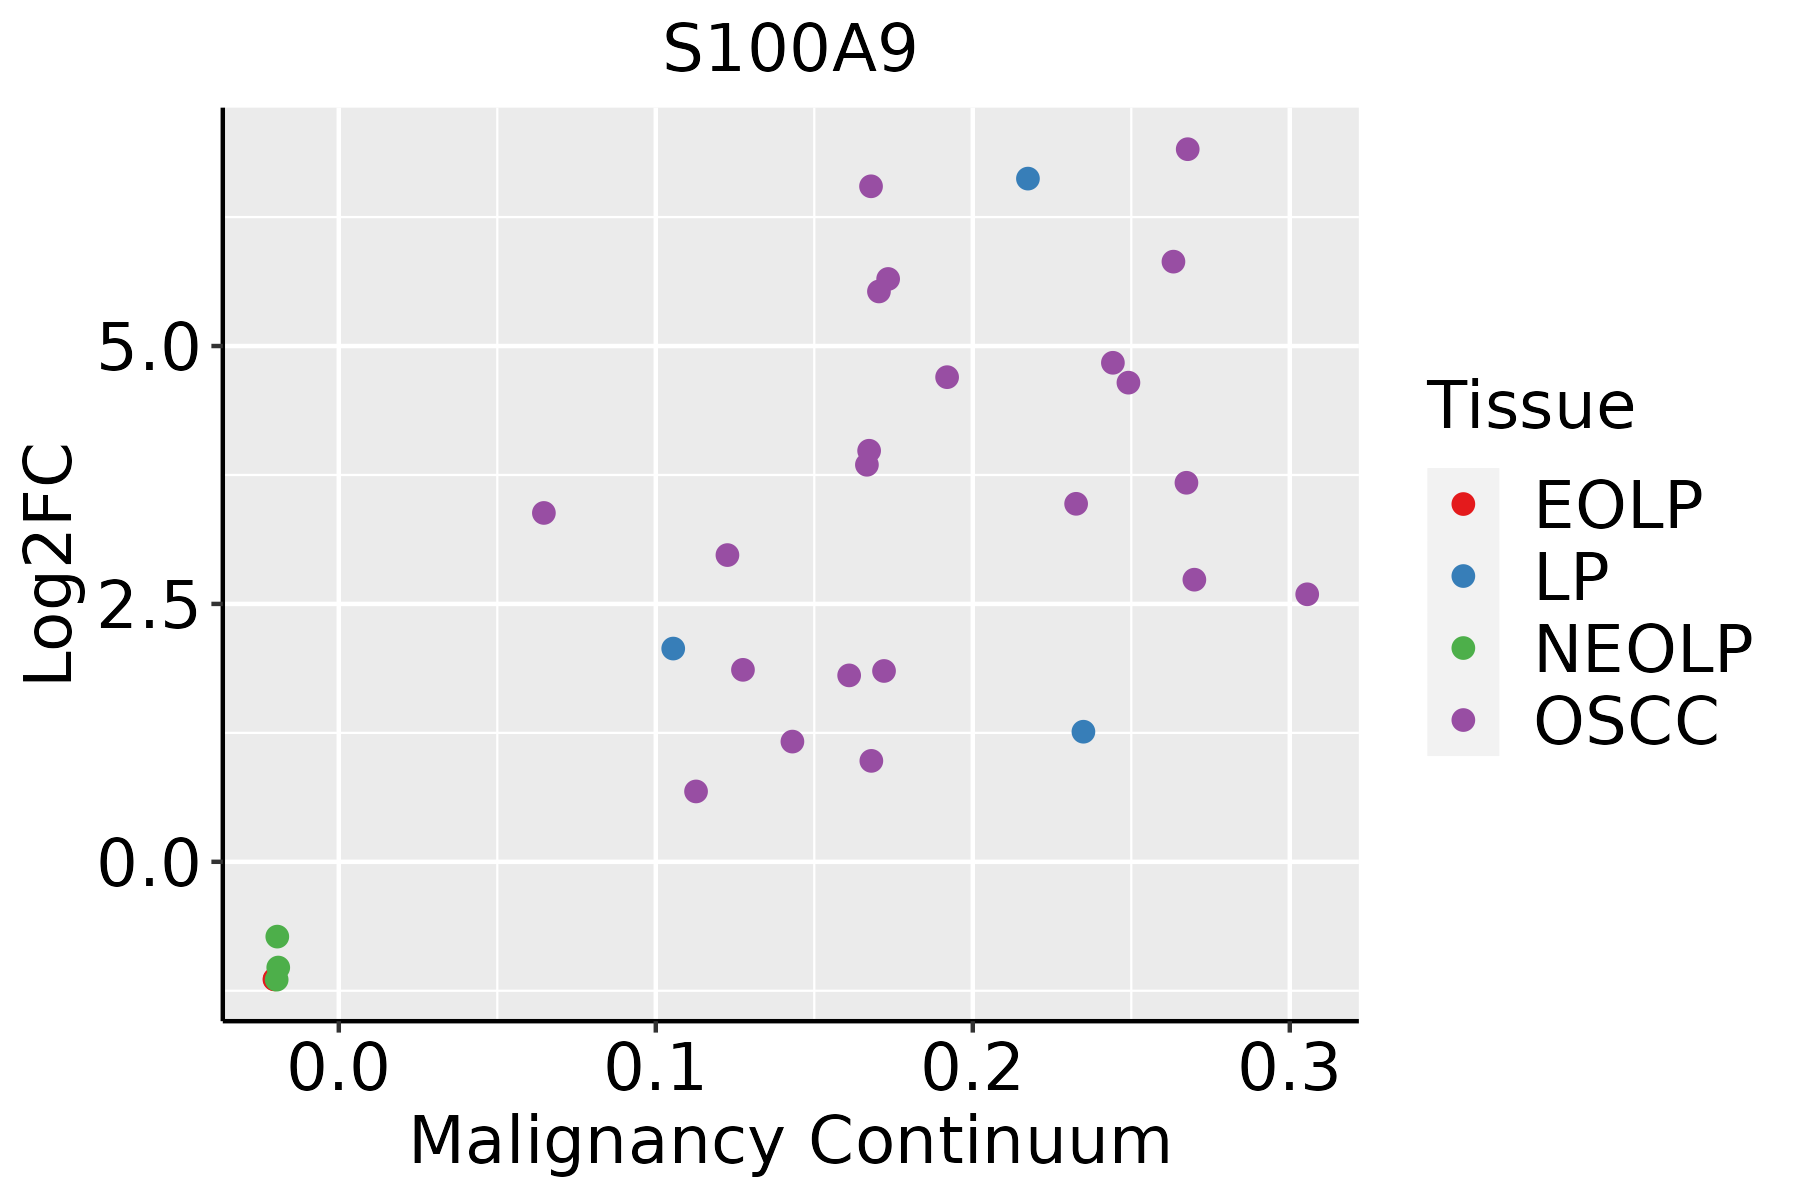 | EOLP: Erosive Oral lichen planus |
| LP: leukoplakia | ||
| NEOLP: Non-erosive oral lichen planus | ||
| OSCC: Oral squamous cell carcinoma | ||
| Skin |  | AK: Actinic keratosis |
| cSCC: Cutaneous squamous cell carcinoma | ||
| SCCIS:squamous cell carcinoma in situ |
| ∗log2FC in expression of this searched gene in stem-like cells from each diseased tissue sample relative to stem-like cells in normal samples in each tissue plotted against the malignancy continuum. Samples are colored based on if they are from different disease stage. |
Top |
Malignant transformation related pathway analysis |
| Find out the enriched GO biological processes and KEGG pathways involved in transition from healthy to precancer to cancer |
| Tissue | Disease Stage | Enriched GO biological Processes |
| Colorectum | AD |  |
| Colorectum | SER |  |
| Colorectum | MSS |  |
| Colorectum | MSI-H |  |
| Colorectum | FAP |  |
| ∗Top 15 enriched GO BP terms are showed in the bar plot of each disease state in each tissue. Each row represents a significant GO biological process which is colored according to the -log10(p.adjust). |
| Page: 1 2 3 4 5 6 7 8 9 |
| GO ID | Tissue | Disease Stage | Description | Gene Ratio | Bg Ratio | pvalue | p.adjust | Count |
| GO:00550693 | Liver | Cirrhotic | zinc ion homeostasis | 17/4634 | 40/18723 | 1.04e-02 | 4.61e-02 | 17 |
| GO:200123322 | Liver | HCC | regulation of apoptotic signaling pathway | 226/7958 | 356/18723 | 7.26e-16 | 5.68e-14 | 226 |
| GO:004586222 | Liver | HCC | positive regulation of proteolysis | 232/7958 | 372/18723 | 5.66e-15 | 3.98e-13 | 232 |
| GO:009719322 | Liver | HCC | intrinsic apoptotic signaling pathway | 184/7958 | 288/18723 | 1.50e-13 | 8.32e-12 | 184 |
| GO:200124212 | Liver | HCC | regulation of intrinsic apoptotic signaling pathway | 109/7958 | 164/18723 | 4.52e-10 | 1.45e-08 | 109 |
| GO:001604921 | Liver | HCC | cell growth | 269/7958 | 482/18723 | 1.84e-09 | 5.35e-08 | 269 |
| GO:000155821 | Liver | HCC | regulation of cell growth | 228/7958 | 414/18723 | 1.34e-07 | 2.55e-06 | 228 |
| GO:000963622 | Liver | HCC | response to toxic substance | 153/7958 | 262/18723 | 1.37e-07 | 2.58e-06 | 153 |
| GO:005123521 | Liver | HCC | maintenance of location | 185/7958 | 327/18723 | 1.70e-07 | 3.12e-06 | 185 |
| GO:004328112 | Liver | HCC | regulation of cysteine-type endopeptidase activity involved in apoptotic process | 125/7958 | 209/18723 | 3.12e-07 | 5.42e-06 | 125 |
| GO:200011612 | Liver | HCC | regulation of cysteine-type endopeptidase activity | 137/7958 | 235/18723 | 6.91e-07 | 1.08e-05 | 137 |
| GO:005254722 | Liver | HCC | regulation of peptidase activity | 247/7958 | 461/18723 | 8.28e-07 | 1.27e-05 | 247 |
| GO:003134611 | Liver | HCC | positive regulation of cell projection organization | 193/7958 | 353/18723 | 2.28e-06 | 3.08e-05 | 193 |
| GO:005254822 | Liver | HCC | regulation of endopeptidase activity | 230/7958 | 432/18723 | 3.58e-06 | 4.68e-05 | 230 |
| GO:200123522 | Liver | HCC | positive regulation of apoptotic signaling pathway | 79/7958 | 126/18723 | 3.70e-06 | 4.82e-05 | 79 |
| GO:003582111 | Liver | HCC | modulation of process of other organism | 67/7958 | 106/18723 | 1.34e-05 | 1.48e-04 | 67 |
| GO:005165112 | Liver | HCC | maintenance of location in cell | 119/7958 | 214/18723 | 7.11e-05 | 6.39e-04 | 119 |
| GO:199074812 | Liver | HCC | cellular detoxification | 70/7958 | 116/18723 | 7.87e-05 | 7.02e-04 | 70 |
| GO:009723712 | Liver | HCC | cellular response to toxic substance | 74/7958 | 124/18723 | 8.36e-05 | 7.36e-04 | 74 |
| GO:005507612 | Liver | HCC | transition metal ion homeostasis | 81/7958 | 138/18723 | 8.87e-05 | 7.72e-04 | 81 |
| Page: 1 2 3 4 5 6 7 8 9 10 11 12 13 14 15 16 17 18 19 20 21 22 23 24 25 26 27 28 29 30 31 32 33 34 35 36 37 38 39 40 41 42 |
| Pathway ID | Tissue | Disease Stage | Description | Gene Ratio | Bg Ratio | pvalue | p.adjust | qvalue | Count |
| hsa0465716 | Breast | Precancer | IL-17 signaling pathway | 20/684 | 94/8465 | 4.74e-05 | 4.54e-04 | 3.48e-04 | 20 |
| hsa0465717 | Breast | Precancer | IL-17 signaling pathway | 20/684 | 94/8465 | 4.74e-05 | 4.54e-04 | 3.48e-04 | 20 |
| hsa0465721 | Breast | IDC | IL-17 signaling pathway | 18/867 | 94/8465 | 6.39e-03 | 3.30e-02 | 2.47e-02 | 18 |
| hsa0465731 | Breast | IDC | IL-17 signaling pathway | 18/867 | 94/8465 | 6.39e-03 | 3.30e-02 | 2.47e-02 | 18 |
| hsa0465741 | Breast | DCIS | IL-17 signaling pathway | 18/846 | 94/8465 | 4.95e-03 | 2.67e-02 | 1.96e-02 | 18 |
| hsa0465751 | Breast | DCIS | IL-17 signaling pathway | 18/846 | 94/8465 | 4.95e-03 | 2.67e-02 | 1.96e-02 | 18 |
| hsa0465718 | Cervix | CC | IL-17 signaling pathway | 31/1267 | 94/8465 | 8.71e-06 | 7.43e-05 | 4.39e-05 | 31 |
| hsa0465719 | Cervix | CC | IL-17 signaling pathway | 31/1267 | 94/8465 | 8.71e-06 | 7.43e-05 | 4.39e-05 | 31 |
| hsa0465722 | Cervix | HSIL_HPV | IL-17 signaling pathway | 15/459 | 94/8465 | 1.45e-04 | 1.74e-03 | 1.40e-03 | 15 |
| hsa0465732 | Cervix | HSIL_HPV | IL-17 signaling pathway | 15/459 | 94/8465 | 1.45e-04 | 1.74e-03 | 1.40e-03 | 15 |
| hsa0465742 | Cervix | N_HPV | IL-17 signaling pathway | 16/349 | 94/8465 | 1.20e-06 | 1.64e-05 | 1.28e-05 | 16 |
| hsa0465752 | Cervix | N_HPV | IL-17 signaling pathway | 16/349 | 94/8465 | 1.20e-06 | 1.64e-05 | 1.28e-05 | 16 |
| hsa0465720 | Endometrium | EEC | IL-17 signaling pathway | 23/1237 | 94/8465 | 7.61e-03 | 3.63e-02 | 2.71e-02 | 23 |
| hsa04657110 | Endometrium | EEC | IL-17 signaling pathway | 23/1237 | 94/8465 | 7.61e-03 | 3.63e-02 | 2.71e-02 | 23 |
| hsa0465726 | Esophagus | HGIN | IL-17 signaling pathway | 25/1383 | 94/8465 | 7.52e-03 | 4.63e-02 | 3.68e-02 | 25 |
| hsa04657113 | Esophagus | HGIN | IL-17 signaling pathway | 25/1383 | 94/8465 | 7.52e-03 | 4.63e-02 | 3.68e-02 | 25 |
| hsa0465727 | Esophagus | ESCC | IL-17 signaling pathway | 66/4205 | 94/8465 | 3.93e-05 | 1.75e-04 | 8.99e-05 | 66 |
| hsa0465734 | Esophagus | ESCC | IL-17 signaling pathway | 66/4205 | 94/8465 | 3.93e-05 | 1.75e-04 | 8.99e-05 | 66 |
| hsa0465724 | Oral cavity | OSCC | IL-17 signaling pathway | 64/3704 | 94/8465 | 1.48e-06 | 7.87e-06 | 4.01e-06 | 64 |
| hsa04657112 | Oral cavity | OSCC | IL-17 signaling pathway | 64/3704 | 94/8465 | 1.48e-06 | 7.87e-06 | 4.01e-06 | 64 |
| Page: 1 2 |
Top |
Cell-cell communication analysis |
| Identification of potential cell-cell interactions between two cell types and their ligand-receptor pairs for different disease states |
| Ligand | Receptor | LRpair | Pathway | Tissue | Disease Stage |
| Page: 1 |
Top |
Single-cell gene regulatory network inference analysis |
| Find out the significant the regulons (TFs) and the target genes of each regulon across cell types for different disease states |
| TF | Cell Type | Tissue | Disease Stage | Target Gene | RSS | Regulon Activity |
| ∗The dot plots of a searched regulon are shown for all cell subpopulations in each disease state of each tissue based on the regulon specific score inferred using pySCENIC and by calculating the average expression. |
| Page: 1 |
Top |
Somatic mutation of malignant transformation related genes |
| Annotation of somatic variants for genes involved in malignant transformation |
| Hugo Symbol | Variant Class | Variant Classification | dbSNP RS | HGVSc | HGVSp | HGVSp Short | SWISSPROT | BIOTYPE | SIFT | PolyPhen | Tumor Sample Barcode | Tissue | Histology | Sex | Age | Stage | Therapy Types | Drugs | Outcome |
| S100A9 | SNV | Missense_Mutation | c.29N>C | p.Arg10Pro | p.R10P | P06702 | protein_coding | tolerated(0.19) | possibly_damaging(0.613) | TCGA-EK-A3GJ-01 | Cervix | cervical & endocervical cancer | Female | <65 | I/II | Unknown | Unknown | SD | |
| S100A9 | SNV | Missense_Mutation | c.17N>T | p.Ser6Leu | p.S6L | P06702 | protein_coding | deleterious(0) | possibly_damaging(0.88) | TCGA-A6-6141-01 | Colorectum | colon adenocarcinoma | Male | <65 | I/II | Chemotherapy | 5-fu | SD | |
| S100A9 | SNV | Missense_Mutation | c.17N>T | p.Ser6Leu | p.S6L | P06702 | protein_coding | deleterious(0) | possibly_damaging(0.88) | TCGA-AU-6004-01 | Colorectum | colon adenocarcinoma | Female | >=65 | I/II | Unknown | Unknown | SD | |
| S100A9 | SNV | Missense_Mutation | rs142015410 | c.125N>A | p.Arg42Gln | p.R42Q | P06702 | protein_coding | tolerated(0.62) | benign(0) | TCGA-D5-6929-01 | Colorectum | colon adenocarcinoma | Female | <65 | III/IV | Chemotherapy | oxaliplatinum+ | SD |
| S100A9 | SNV | Missense_Mutation | rs142015410 | c.125G>A | p.Arg42Gln | p.R42Q | P06702 | protein_coding | tolerated(0.62) | benign(0) | TCGA-F5-6814-01 | Colorectum | rectum adenocarcinoma | Male | <65 | I/II | Unknown | Unknown | SD |
| S100A9 | SNV | Missense_Mutation | rs140601192 | c.28N>T | p.Arg10Cys | p.R10C | P06702 | protein_coding | tolerated(0.25) | benign(0.017) | TCGA-AJ-A3EL-01 | Endometrium | uterine corpus endometrioid carcinoma | Female | <65 | I/II | Unknown | Unknown | SD |
| S100A9 | SNV | Missense_Mutation | rs147137403 | c.251C>T | p.Ala84Val | p.A84V | P06702 | protein_coding | tolerated(0.19) | benign(0.048) | TCGA-AX-A2HD-01 | Endometrium | uterine corpus endometrioid carcinoma | Female | >=65 | III/IV | Unknown | Unknown | SD |
| S100A9 | SNV | Missense_Mutation | novel | c.76N>A | p.Leu26Met | p.L26M | P06702 | protein_coding | tolerated(0.25) | benign(0.268) | TCGA-E6-A1LX-01 | Endometrium | uterine corpus endometrioid carcinoma | Female | <65 | I/II | Unknown | Unknown | SD |
| S100A9 | SNV | Missense_Mutation | novel | c.98A>G | p.Asn33Ser | p.N33S | P06702 | protein_coding | tolerated(1) | benign(0.031) | TCGA-FI-A2D5-01 | Endometrium | uterine corpus endometrioid carcinoma | Female | <65 | III/IV | Chemotherapy | carboplatinum | PD |
| S100A9 | SNV | Missense_Mutation | novel | c.259N>C | p.Thr87Pro | p.T87P | P06702 | protein_coding | tolerated(0.08) | possibly_damaging(0.825) | TCGA-BR-A4J8-01 | Stomach | stomach adenocarcinoma | Female | >=65 | III/IV | Chemotherapy | xeloda | CR |
| Page: 1 2 |
Top |
Related drugs of malignant transformation related genes |
| Identification of chemicals and drugs interact with genes involved in malignant transfromation |
| (DGIdb 4.0) |
| Entrez ID | Symbol | Category | Interaction Types | Drug Claim Name | Drug Name | PMIDs |
| 6280 | S100A9 | DRUGGABLE GENOME, KINASE, ENZYME | Paquinimod | PAQUINIMOD | ||
| 6280 | S100A9 | DRUGGABLE GENOME, KINASE, ENZYME | Tasquinimod | TASQUINIMOD | 24162378 |
| Page: 1 |

Copyright 2023-Present -The University of Texas Health Science Center at Houston |