
|
|||||
|
 | |
| |
| |
| |
| |
| |
|
Gene: RBPJ |
Gene summary for RBPJ |
| Gene information | Species | Human | Gene symbol | RBPJ | Gene ID | 3516 |
| Gene name | recombination signal binding protein for immunoglobulin kappa J region | |
| Gene Alias | AOS3 | |
| Cytomap | 4p15.2 | |
| Gene Type | protein-coding | GO ID | GO:0000003 | UniProtAcc | Q06330 |
Top |
Malignant transformation analysis |
| Identification of the aberrant gene expression in precancerous and cancerous lesions by comparing the gene expression of stem-like cells in diseased tissues with normal stem cells |
| Entrez ID | Symbol | Replicates | Species | Organ | Tissue | Adj P-value | Log2FC | Malignancy |
| 3516 | RBPJ | LZE2T | Human | Esophagus | ESCC | 1.28e-12 | 4.94e-01 | 0.082 |
| 3516 | RBPJ | LZE3D | Human | Esophagus | HGIN | 4.44e-04 | 4.43e-01 | 0.0668 |
| 3516 | RBPJ | LZE4T | Human | Esophagus | ESCC | 1.15e-04 | 2.85e-01 | 0.0811 |
| 3516 | RBPJ | LZE7T | Human | Esophagus | ESCC | 1.37e-03 | 5.57e-01 | 0.0667 |
| 3516 | RBPJ | LZE8T | Human | Esophagus | ESCC | 1.34e-07 | 2.53e-01 | 0.067 |
| 3516 | RBPJ | LZE20T | Human | Esophagus | ESCC | 2.16e-07 | 1.59e-01 | 0.0662 |
| 3516 | RBPJ | LZE22D1 | Human | Esophagus | HGIN | 5.77e-04 | 2.03e-02 | 0.0595 |
| 3516 | RBPJ | LZE22T | Human | Esophagus | ESCC | 2.45e-02 | 3.96e-02 | 0.068 |
| 3516 | RBPJ | LZE24T | Human | Esophagus | ESCC | 3.44e-13 | 2.17e-01 | 0.0596 |
| 3516 | RBPJ | LZE21T | Human | Esophagus | ESCC | 7.37e-04 | 1.26e-01 | 0.0655 |
| 3516 | RBPJ | LZE6T | Human | Esophagus | ESCC | 6.25e-08 | 2.68e-01 | 0.0845 |
| 3516 | RBPJ | P1T-E | Human | Esophagus | ESCC | 7.56e-07 | 1.87e-01 | 0.0875 |
| 3516 | RBPJ | P2T-E | Human | Esophagus | ESCC | 5.84e-26 | 5.97e-01 | 0.1177 |
| 3516 | RBPJ | P4T-E | Human | Esophagus | ESCC | 1.93e-20 | 5.60e-01 | 0.1323 |
| 3516 | RBPJ | P5T-E | Human | Esophagus | ESCC | 5.96e-20 | 1.18e-01 | 0.1327 |
| 3516 | RBPJ | P8T-E | Human | Esophagus | ESCC | 1.06e-21 | 7.23e-01 | 0.0889 |
| 3516 | RBPJ | P9T-E | Human | Esophagus | ESCC | 6.13e-13 | 2.29e-01 | 0.1131 |
| 3516 | RBPJ | P10T-E | Human | Esophagus | ESCC | 7.18e-26 | 6.12e-01 | 0.116 |
| 3516 | RBPJ | P11T-E | Human | Esophagus | ESCC | 1.96e-14 | 6.07e-01 | 0.1426 |
| 3516 | RBPJ | P12T-E | Human | Esophagus | ESCC | 3.10e-16 | 5.14e-01 | 0.1122 |
| Page: 1 2 3 4 5 6 7 |
| Tissue | Expression Dynamics | Abbreviation |
| Esophagus | 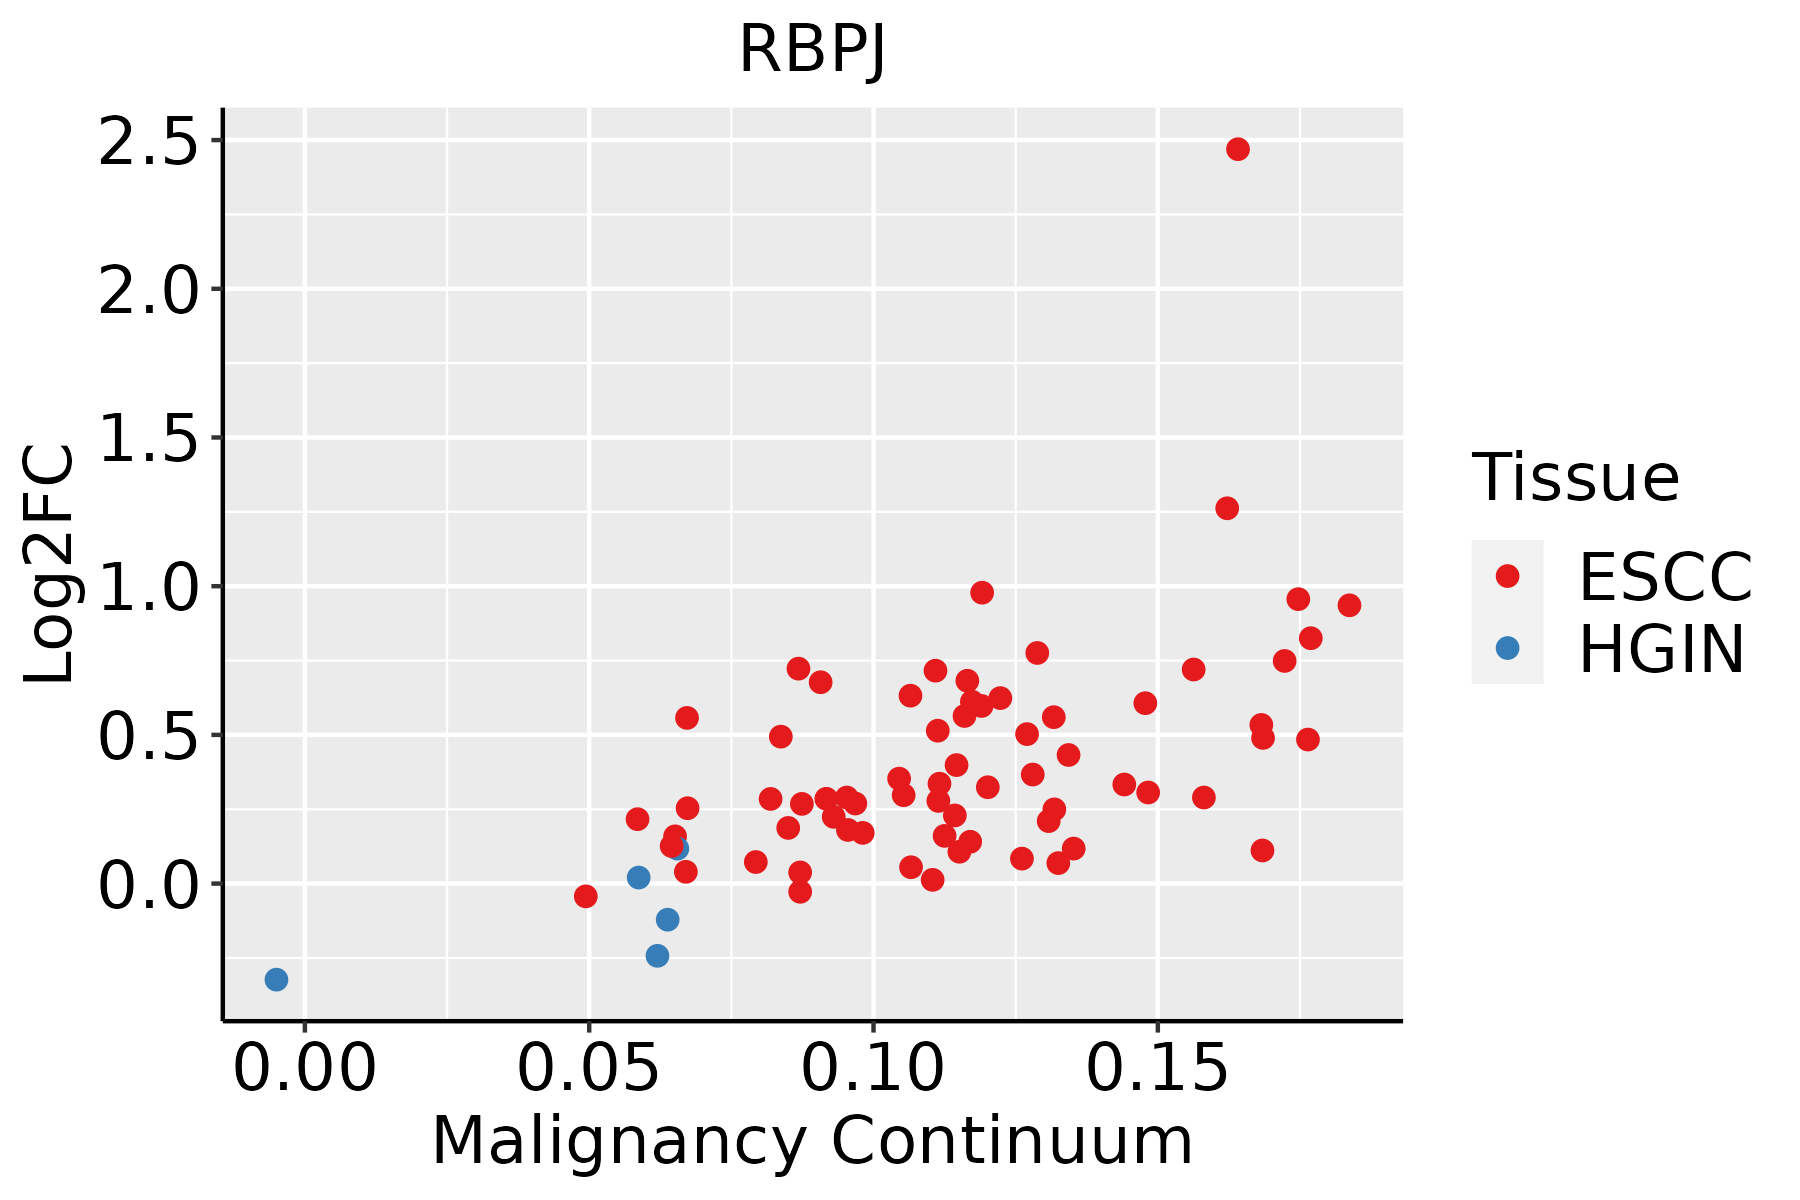 | ESCC: Esophageal squamous cell carcinoma |
| HGIN: High-grade intraepithelial neoplasias | ||
| LGIN: Low-grade intraepithelial neoplasias | ||
| Liver |  | HCC: Hepatocellular carcinoma |
| NAFLD: Non-alcoholic fatty liver disease | ||
| Oral Cavity | 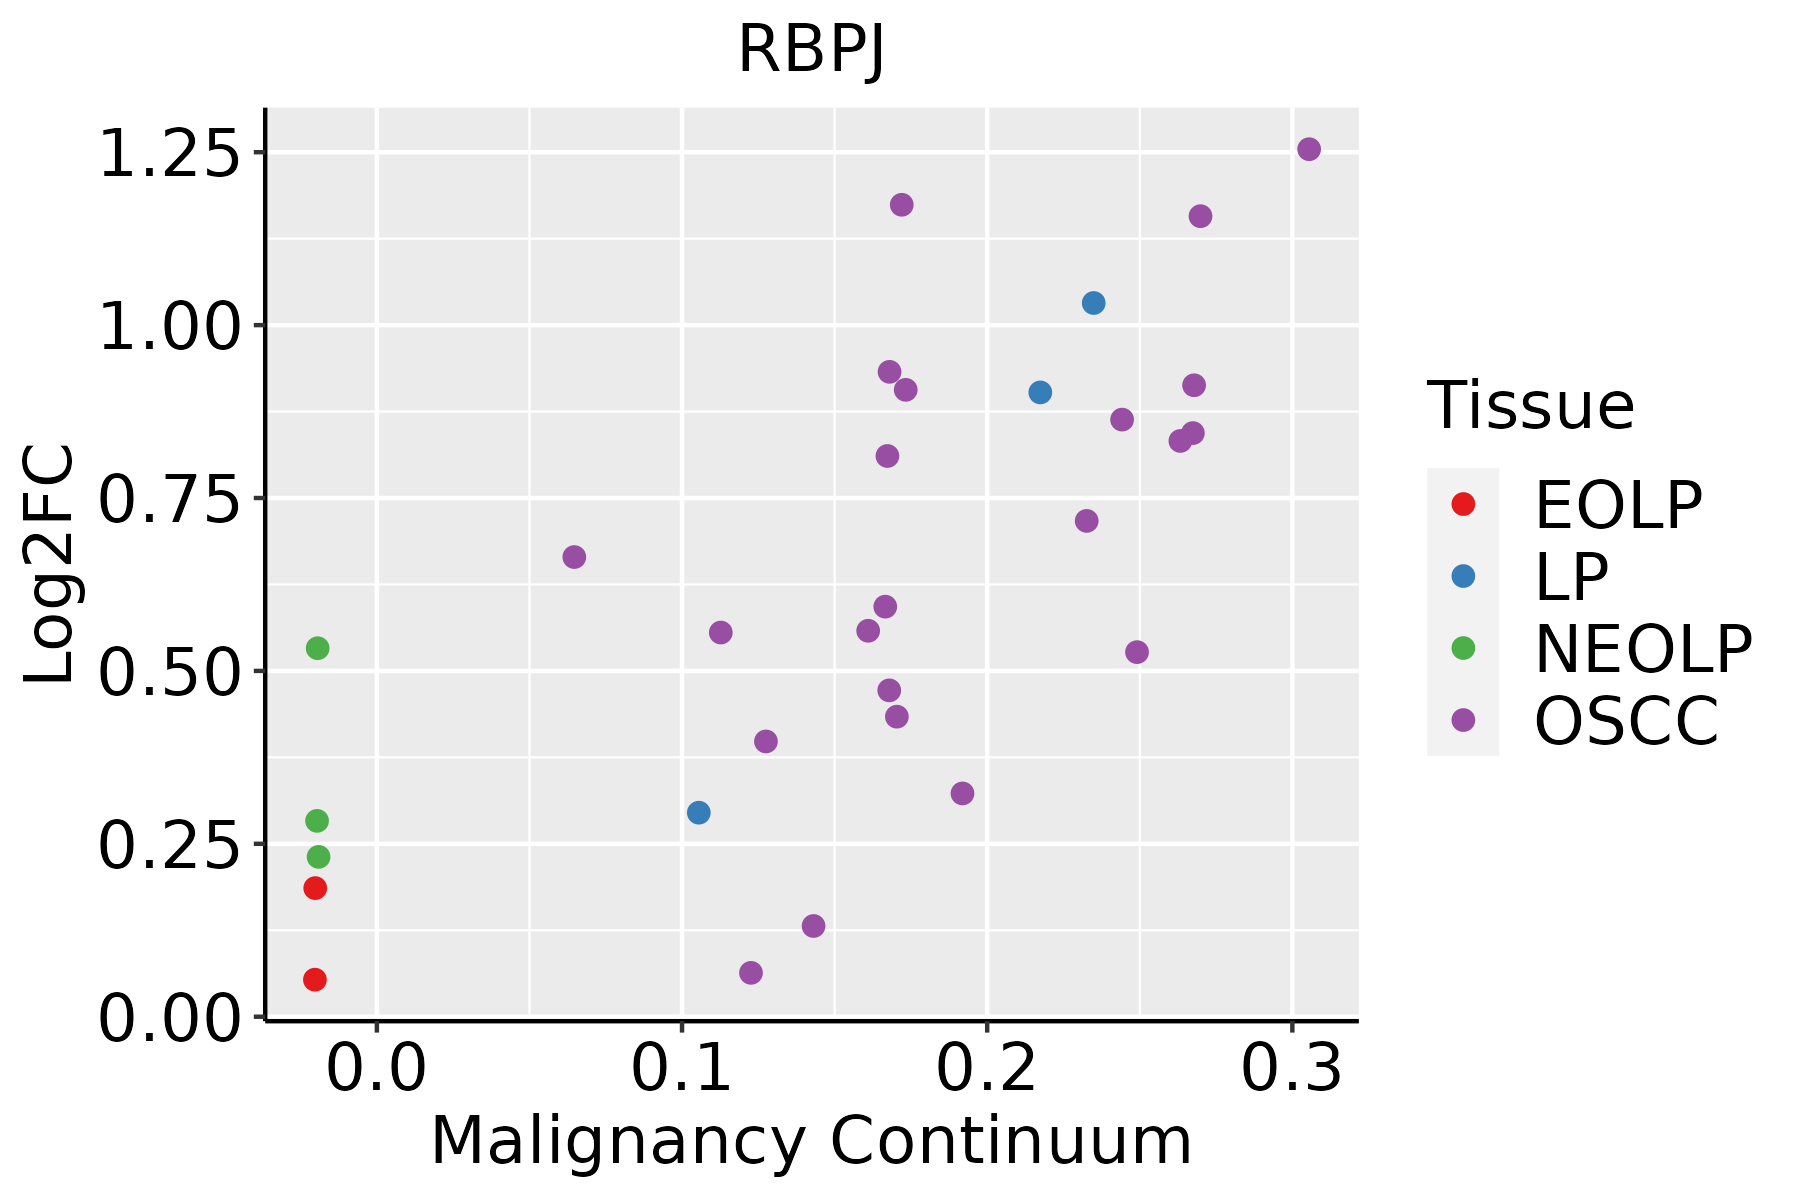 | EOLP: Erosive Oral lichen planus |
| LP: leukoplakia | ||
| NEOLP: Non-erosive oral lichen planus | ||
| OSCC: Oral squamous cell carcinoma | ||
| Skin |  | AK: Actinic keratosis |
| cSCC: Cutaneous squamous cell carcinoma | ||
| SCCIS:squamous cell carcinoma in situ | ||
| Thyroid | 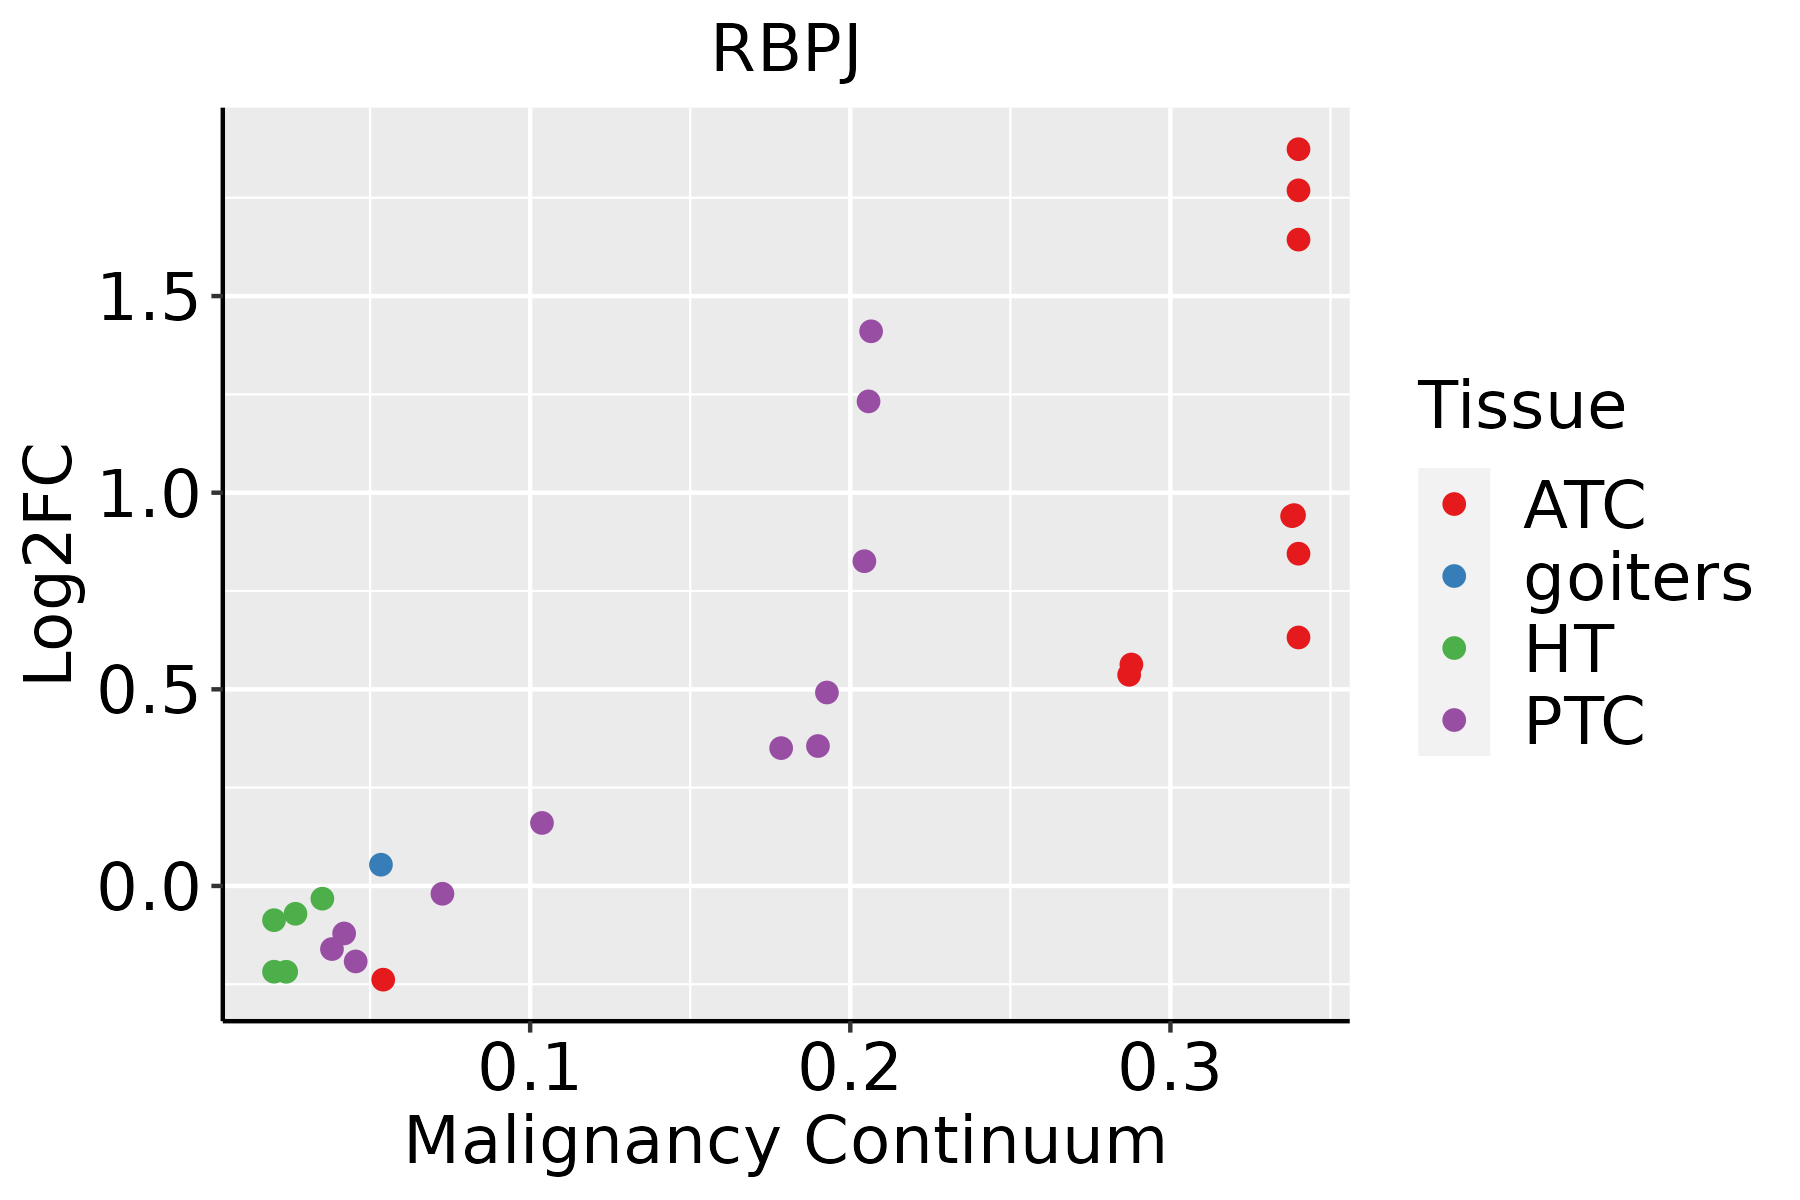 | ATC: Anaplastic thyroid cancer |
| HT: Hashimoto's thyroiditis | ||
| PTC: Papillary thyroid cancer |
| ∗log2FC in expression of this searched gene in stem-like cells from each diseased tissue sample relative to stem-like cells in normal samples in each tissue plotted against the malignancy continuum. Samples are colored based on if they are from different disease stage. |
Top |
Malignant transformation related pathway analysis |
| Find out the enriched GO biological processes and KEGG pathways involved in transition from healthy to precancer to cancer |
| Tissue | Disease Stage | Enriched GO biological Processes |
| Colorectum | AD |  |
| Colorectum | SER |  |
| Colorectum | MSS |  |
| Colorectum | MSI-H |  |
| Colorectum | FAP |  |
| ∗Top 15 enriched GO BP terms are showed in the bar plot of each disease state in each tissue. Each row represents a significant GO biological process which is colored according to the -log10(p.adjust). |
| Page: 1 2 3 4 5 6 7 8 9 |
| GO ID | Tissue | Disease Stage | Description | Gene Ratio | Bg Ratio | pvalue | p.adjust | Count |
| GO:006007024 | Skin | cSCC | canonical Wnt signaling pathway | 104/4864 | 303/18723 | 7.13e-04 | 5.03e-03 | 104 |
| GO:190118414 | Skin | cSCC | regulation of ERBB signaling pathway | 34/4864 | 79/18723 | 7.23e-04 | 5.06e-03 | 34 |
| GO:004544513 | Skin | cSCC | myoblast differentiation | 35/4864 | 84/18723 | 1.23e-03 | 7.97e-03 | 35 |
| GO:00614185 | Skin | cSCC | regulation of transcription from RNA polymerase II promoter in response to hypoxia | 9/4864 | 13/18723 | 1.33e-03 | 8.50e-03 | 9 |
| GO:006082824 | Skin | cSCC | regulation of canonical Wnt signaling pathway | 87/4864 | 253/18723 | 1.74e-03 | 1.06e-02 | 87 |
| GO:004801321 | Skin | cSCC | ephrin receptor signaling pathway | 23/4864 | 51/18723 | 2.41e-03 | 1.38e-02 | 23 |
| GO:007145617 | Skin | cSCC | cellular response to hypoxia | 55/4864 | 151/18723 | 2.88e-03 | 1.61e-02 | 55 |
| GO:0036294111 | Skin | cSCC | cellular response to decreased oxygen levels | 58/4864 | 161/18723 | 3.00e-03 | 1.66e-02 | 58 |
| GO:000721922 | Skin | cSCC | Notch signaling pathway | 60/4864 | 172/18723 | 5.82e-03 | 2.87e-02 | 60 |
| GO:000315824 | Skin | cSCC | endothelium development | 49/4864 | 136/18723 | 6.00e-03 | 2.95e-02 | 49 |
| GO:004592719 | Skin | cSCC | positive regulation of growth | 85/4864 | 259/18723 | 8.03e-03 | 3.73e-02 | 85 |
| GO:004886317 | Skin | cSCC | stem cell differentiation | 69/4864 | 206/18723 | 9.56e-03 | 4.30e-02 | 69 |
| GO:003600320 | Skin | cSCC | positive regulation of transcription from RNA polymerase II promoter in response to stress | 12/4864 | 24/18723 | 9.91e-03 | 4.35e-02 | 12 |
| GO:003032417 | Skin | cSCC | lung development | 60/4864 | 177/18723 | 1.14e-02 | 4.97e-02 | 60 |
| GO:0016055110 | Thyroid | PTC | Wnt signaling pathway | 217/5968 | 444/18723 | 3.71e-14 | 2.30e-12 | 217 |
| GO:0198738110 | Thyroid | PTC | cell-cell signaling by wnt | 217/5968 | 446/18723 | 6.68e-14 | 3.73e-12 | 217 |
| GO:0030111110 | Thyroid | PTC | regulation of Wnt signaling pathway | 163/5968 | 328/18723 | 1.05e-11 | 4.29e-10 | 163 |
| GO:0001701111 | Thyroid | PTC | in utero embryonic development | 175/5968 | 367/18723 | 1.40e-10 | 4.73e-09 | 175 |
| GO:0070482113 | Thyroid | PTC | response to oxygen levels | 167/5968 | 347/18723 | 1.51e-10 | 5.03e-09 | 167 |
| GO:0036293113 | Thyroid | PTC | response to decreased oxygen levels | 153/5968 | 322/18723 | 2.71e-09 | 7.52e-08 | 153 |
| Page: 1 2 3 4 5 6 7 8 9 10 11 12 13 14 15 16 17 18 19 20 21 22 23 24 25 26 27 28 29 30 31 32 33 |
| Pathway ID | Tissue | Disease Stage | Description | Gene Ratio | Bg Ratio | pvalue | p.adjust | qvalue | Count |
| hsa0501727 | Esophagus | HGIN | Spinocerebellar ataxia | 43/1383 | 143/8465 | 2.68e-05 | 3.64e-04 | 2.89e-04 | 43 |
| hsa0516930 | Esophagus | HGIN | Epstein-Barr virus infection | 55/1383 | 202/8465 | 5.13e-05 | 6.19e-04 | 4.92e-04 | 55 |
| hsa052039 | Esophagus | HGIN | Viral carcinogenesis | 53/1383 | 204/8465 | 2.58e-04 | 2.71e-03 | 2.15e-03 | 53 |
| hsa05017112 | Esophagus | HGIN | Spinocerebellar ataxia | 43/1383 | 143/8465 | 2.68e-05 | 3.64e-04 | 2.89e-04 | 43 |
| hsa05169114 | Esophagus | HGIN | Epstein-Barr virus infection | 55/1383 | 202/8465 | 5.13e-05 | 6.19e-04 | 4.92e-04 | 55 |
| hsa0520315 | Esophagus | HGIN | Viral carcinogenesis | 53/1383 | 204/8465 | 2.58e-04 | 2.71e-03 | 2.15e-03 | 53 |
| hsa05169210 | Esophagus | ESCC | Epstein-Barr virus infection | 151/4205 | 202/8465 | 1.55e-13 | 3.45e-12 | 1.77e-12 | 151 |
| hsa0516510 | Esophagus | ESCC | Human papillomavirus infection | 215/4205 | 331/8465 | 7.86e-09 | 7.12e-08 | 3.65e-08 | 215 |
| hsa0520325 | Esophagus | ESCC | Viral carcinogenesis | 137/4205 | 204/8465 | 2.47e-07 | 1.88e-06 | 9.62e-07 | 137 |
| hsa0501728 | Esophagus | ESCC | Spinocerebellar ataxia | 94/4205 | 143/8465 | 6.77e-05 | 2.90e-04 | 1.48e-04 | 94 |
| hsa043306 | Esophagus | ESCC | Notch signaling pathway | 42/4205 | 62/8465 | 2.97e-03 | 7.97e-03 | 4.08e-03 | 42 |
| hsa046585 | Esophagus | ESCC | Th1 and Th2 cell differentiation | 58/4205 | 92/8465 | 6.49e-03 | 1.60e-02 | 8.19e-03 | 58 |
| hsa0516937 | Esophagus | ESCC | Epstein-Barr virus infection | 151/4205 | 202/8465 | 1.55e-13 | 3.45e-12 | 1.77e-12 | 151 |
| hsa0516515 | Esophagus | ESCC | Human papillomavirus infection | 215/4205 | 331/8465 | 7.86e-09 | 7.12e-08 | 3.65e-08 | 215 |
| hsa0520335 | Esophagus | ESCC | Viral carcinogenesis | 137/4205 | 204/8465 | 2.47e-07 | 1.88e-06 | 9.62e-07 | 137 |
| hsa0501736 | Esophagus | ESCC | Spinocerebellar ataxia | 94/4205 | 143/8465 | 6.77e-05 | 2.90e-04 | 1.48e-04 | 94 |
| hsa0433013 | Esophagus | ESCC | Notch signaling pathway | 42/4205 | 62/8465 | 2.97e-03 | 7.97e-03 | 4.08e-03 | 42 |
| hsa0465812 | Esophagus | ESCC | Th1 and Th2 cell differentiation | 58/4205 | 92/8465 | 6.49e-03 | 1.60e-02 | 8.19e-03 | 58 |
| hsa0501710 | Liver | Cirrhotic | Spinocerebellar ataxia | 66/2530 | 143/8465 | 2.58e-05 | 2.15e-04 | 1.32e-04 | 66 |
| hsa05165 | Liver | Cirrhotic | Human papillomavirus infection | 124/2530 | 331/8465 | 1.55e-03 | 7.83e-03 | 4.83e-03 | 124 |
| Page: 1 2 3 4 |
Top |
Cell-cell communication analysis |
| Identification of potential cell-cell interactions between two cell types and their ligand-receptor pairs for different disease states |
| Ligand | Receptor | LRpair | Pathway | Tissue | Disease Stage |
| Page: 1 |
Top |
Single-cell gene regulatory network inference analysis |
| Find out the significant the regulons (TFs) and the target genes of each regulon across cell types for different disease states |
| TF | Cell Type | Tissue | Disease Stage | Target Gene | RSS | Regulon Activity |
| RBPJ | ICAF | Breast | ADJ | DHRS3,FAM162A,OGA, etc. | 6.34e-01 |  |
| RBPJ | MSC | Breast | DCIS | DHRS3,FAM162A,OGA, etc. | 1.29e-02 |  |
| RBPJ | ICAF | Breast | Healthy | DHRS3,FAM162A,OGA, etc. | 2.19e-01 |  |
| RBPJ | CAF | Breast | Healthy | DHRS3,FAM162A,OGA, etc. | 3.77e-01 | |
| RBPJ | ICAF | Breast | Precancer | DHRS3,FAM162A,OGA, etc. | 4.15e-01 |  |
| RBPJ | CD8TEFF | Liver | Cirrhotic | ID1,HLA-DQB1,SCP2, etc. | 1.21e-01 |  |
| RBPJ | NK | Liver | Cirrhotic | ID1,HLA-DQB1,SCP2, etc. | 2.20e-01 | |
| RBPJ | CD8TEREX | Liver | HCC | ID1,HLA-DQB1,SCP2, etc. | 1.95e-01 |  |
| RBPJ | SEC | Liver | HCC | CFD,IGSF6,MT-ND4, etc. | 1.10e-01 | |
| RBPJ | PERI | Prostate | ADJ | MDM2,CPNE8-AS1,DDAH1, etc. | 7.49e-02 |  |
| ∗The dot plots of a searched regulon are shown for all cell subpopulations in each disease state of each tissue based on the regulon specific score inferred using pySCENIC and by calculating the average expression. |
| Page: 1 2 3 |
Top |
Somatic mutation of malignant transformation related genes |
| Annotation of somatic variants for genes involved in malignant transformation |
| Hugo Symbol | Variant Class | Variant Classification | dbSNP RS | HGVSc | HGVSp | HGVSp Short | SWISSPROT | BIOTYPE | SIFT | PolyPhen | Tumor Sample Barcode | Tissue | Histology | Sex | Age | Stage | Therapy Types | Drugs | Outcome |
| RBPJ | SNV | Missense_Mutation | c.1118N>C | p.Leu373Pro | p.L373P | Q06330 | protein_coding | deleterious(0.03) | probably_damaging(0.99) | TCGA-BH-A0E9-01 | Breast | breast invasive carcinoma | Female | <65 | I/II | Chemotherapy | taxotere | CR | |
| RBPJ | SNV | Missense_Mutation | rs141690523 | c.110G>A | p.Arg37Gln | p.R37Q | Q06330 | protein_coding | tolerated(0.22) | benign(0.006) | TCGA-A6-6141-01 | Colorectum | colon adenocarcinoma | Male | <65 | I/II | Chemotherapy | 5-fu | SD |
| RBPJ | SNV | Missense_Mutation | rs750670227 | c.31G>A | p.Glu11Lys | p.E11K | Q06330 | protein_coding | tolerated_low_confidence(0.48) | benign(0.001) | TCGA-AZ-6599-01 | Colorectum | colon adenocarcinoma | Male | >=65 | I/II | Unknown | Unknown | SD |
| RBPJ | SNV | Missense_Mutation | c.149N>G | p.Ile50Ser | p.I50S | Q06330 | protein_coding | deleterious(0) | probably_damaging(0.988) | TCGA-CA-6717-01 | Colorectum | colon adenocarcinoma | Male | <65 | I/II | Chemotherapy | oxaliplatin | CR | |
| RBPJ | SNV | Missense_Mutation | rs141690523 | c.110G>A | p.Arg37Gln | p.R37Q | Q06330 | protein_coding | tolerated(0.22) | benign(0.006) | TCGA-CA-6718-01 | Colorectum | colon adenocarcinoma | Male | <65 | I/II | Unknown | Unknown | PD |
| RBPJ | SNV | Missense_Mutation | rs141690523 | c.110G>A | p.Arg37Gln | p.R37Q | Q06330 | protein_coding | tolerated(0.22) | benign(0.006) | TCGA-AG-3892-01 | Colorectum | rectum adenocarcinoma | Female | <65 | I/II | Unknown | Unknown | SD |
| RBPJ | SNV | Missense_Mutation | c.965T>C | p.Ile322Thr | p.I322T | Q06330 | protein_coding | deleterious(0) | probably_damaging(0.944) | TCGA-AG-3892-01 | Colorectum | rectum adenocarcinoma | Female | <65 | I/II | Unknown | Unknown | SD | |
| RBPJ | SNV | Missense_Mutation | novel | c.455N>G | p.Asp152Gly | p.D152G | Q06330 | protein_coding | deleterious(0.01) | possibly_damaging(0.615) | TCGA-AG-A002-01 | Colorectum | rectum adenocarcinoma | Male | <65 | I/II | Unknown | Unknown | SD |
| RBPJ | SNV | Missense_Mutation | novel | c.746N>C | p.Lys249Thr | p.K249T | Q06330 | protein_coding | tolerated(0.06) | probably_damaging(1) | TCGA-AG-A002-01 | Colorectum | rectum adenocarcinoma | Male | <65 | I/II | Unknown | Unknown | SD |
| RBPJ | SNV | Missense_Mutation | novel | c.790A>C | p.Ile264Leu | p.I264L | Q06330 | protein_coding | deleterious(0) | possibly_damaging(0.875) | TCGA-F5-6814-01 | Colorectum | rectum adenocarcinoma | Male | <65 | I/II | Unknown | Unknown | SD |
| Page: 1 2 3 4 5 6 |
Top |
Related drugs of malignant transformation related genes |
| Identification of chemicals and drugs interact with genes involved in malignant transfromation |
| (DGIdb 4.0) |
| Entrez ID | Symbol | Category | Interaction Types | Drug Claim Name | Drug Name | PMIDs |
| Page: 1 |

Copyright 2023-Present -The University of Texas Health Science Center at Houston |