
|
|||||
|
 | |
| |
| |
| |
| |
| |
|
Gene: PPARGC1A |
Gene summary for PPARGC1A |
| Gene information | Species | Human | Gene symbol | PPARGC1A | Gene ID | 10891 |
| Gene name | PPARG coactivator 1 alpha | |
| Gene Alias | LEM6 | |
| Cytomap | 4p15.2 | |
| Gene Type | protein-coding | GO ID | GO:0000002 | UniProtAcc | Q9UBK2 |
Top |
Malignant transformation analysis |
| Identification of the aberrant gene expression in precancerous and cancerous lesions by comparing the gene expression of stem-like cells in diseased tissues with normal stem cells |
| Entrez ID | Symbol | Replicates | Species | Organ | Tissue | Adj P-value | Log2FC | Malignancy |
| 10891 | PPARGC1A | HTA11_3410_2000001011 | Human | Colorectum | AD | 8.31e-19 | -6.52e-01 | 0.0155 |
| 10891 | PPARGC1A | HTA11_3361_2000001011 | Human | Colorectum | AD | 1.04e-02 | -4.65e-01 | -0.1207 |
| 10891 | PPARGC1A | HTA11_866_3004761011 | Human | Colorectum | AD | 2.46e-13 | -5.83e-01 | 0.096 |
| 10891 | PPARGC1A | HTA11_9408_2000001011 | Human | Colorectum | AD | 5.05e-04 | -8.05e-01 | 0.0451 |
| 10891 | PPARGC1A | HTA11_8622_2000001021 | Human | Colorectum | SER | 1.25e-04 | -7.11e-01 | 0.0528 |
| 10891 | PPARGC1A | HTA11_10711_2000001011 | Human | Colorectum | AD | 1.06e-10 | -6.81e-01 | 0.0338 |
| 10891 | PPARGC1A | HTA11_7696_3000711011 | Human | Colorectum | AD | 3.89e-19 | -5.75e-01 | 0.0674 |
| 10891 | PPARGC1A | HTA11_6818_2000001011 | Human | Colorectum | AD | 6.01e-03 | -6.23e-01 | 0.0112 |
| 10891 | PPARGC1A | HTA11_99999970781_79442 | Human | Colorectum | MSS | 2.35e-04 | -4.07e-01 | 0.294 |
| 10891 | PPARGC1A | HTA11_99999965104_69814 | Human | Colorectum | MSS | 6.52e-03 | -4.76e-01 | 0.281 |
| 10891 | PPARGC1A | HTA11_99999971662_82457 | Human | Colorectum | MSS | 3.91e-14 | -5.37e-01 | 0.3859 |
| 10891 | PPARGC1A | HTA11_99999973899_84307 | Human | Colorectum | MSS | 8.07e-08 | -6.95e-01 | 0.2585 |
| 10891 | PPARGC1A | HTA11_99999974143_84620 | Human | Colorectum | MSS | 4.63e-37 | -7.87e-01 | 0.3005 |
| 10891 | PPARGC1A | F007 | Human | Colorectum | FAP | 2.81e-05 | -3.94e-01 | 0.1176 |
| 10891 | PPARGC1A | A001-C-207 | Human | Colorectum | FAP | 3.90e-09 | -4.80e-01 | 0.1278 |
| 10891 | PPARGC1A | A015-C-203 | Human | Colorectum | FAP | 1.22e-28 | -6.23e-01 | -0.1294 |
| 10891 | PPARGC1A | A015-C-204 | Human | Colorectum | FAP | 1.29e-08 | -4.66e-01 | -0.0228 |
| 10891 | PPARGC1A | A014-C-040 | Human | Colorectum | FAP | 1.91e-05 | -5.20e-01 | -0.1184 |
| 10891 | PPARGC1A | A002-C-201 | Human | Colorectum | FAP | 3.93e-17 | -4.95e-01 | 0.0324 |
| 10891 | PPARGC1A | A002-C-203 | Human | Colorectum | FAP | 1.06e-07 | -4.13e-01 | 0.2786 |
| Page: 1 2 3 4 |
| Tissue | Expression Dynamics | Abbreviation |
| Colorectum (GSE201348) |  | FAP: Familial adenomatous polyposis |
| CRC: Colorectal cancer | ||
| Colorectum (HTA11) |  | AD: Adenomas |
| SER: Sessile serrated lesions | ||
| MSI-H: Microsatellite-high colorectal cancer | ||
| MSS: Microsatellite stable colorectal cancer | ||
| Liver |  | HCC: Hepatocellular carcinoma |
| NAFLD: Non-alcoholic fatty liver disease | ||
| Thyroid | 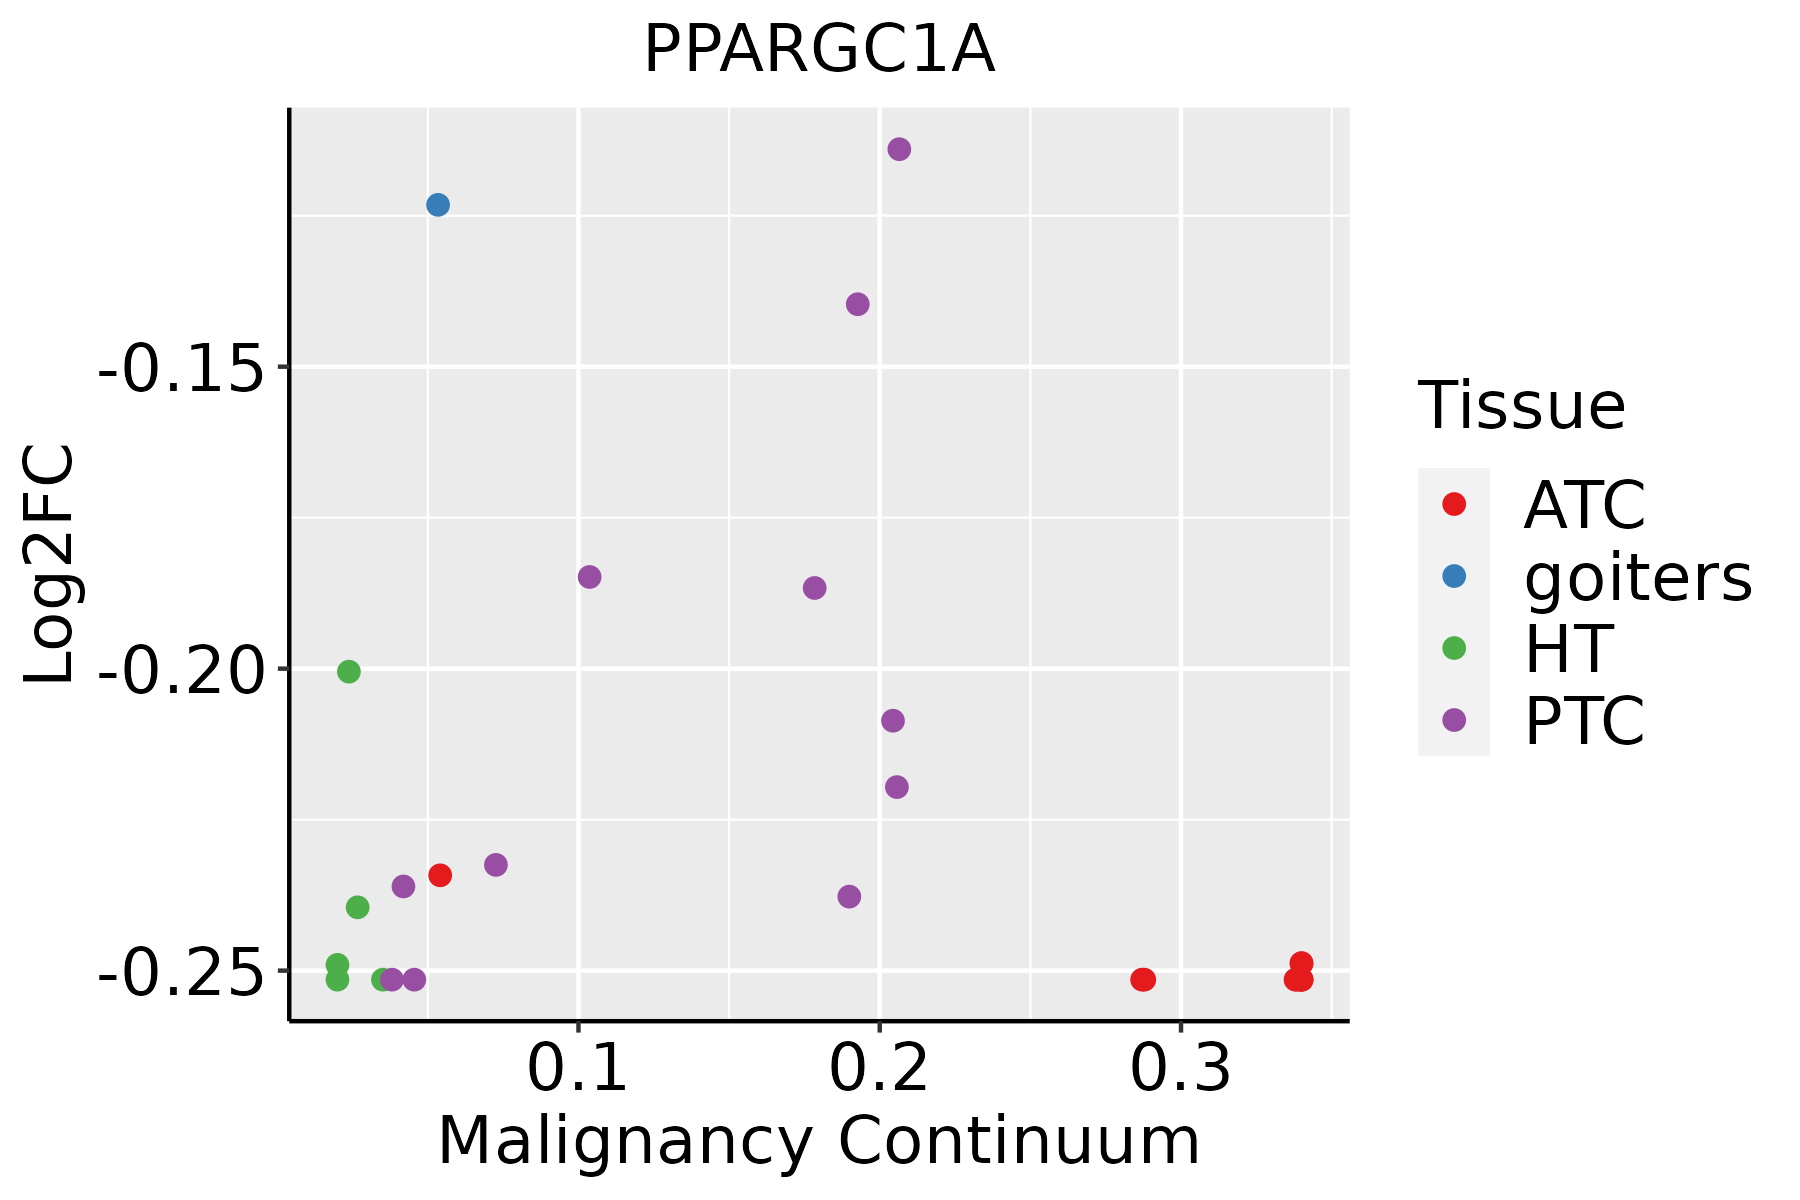 | ATC: Anaplastic thyroid cancer |
| HT: Hashimoto's thyroiditis | ||
| PTC: Papillary thyroid cancer |
| ∗log2FC in expression of this searched gene in stem-like cells from each diseased tissue sample relative to stem-like cells in normal samples in each tissue plotted against the malignancy continuum. Samples are colored based on if they are from different disease stage. |
Top |
Malignant transformation related pathway analysis |
| Find out the enriched GO biological processes and KEGG pathways involved in transition from healthy to precancer to cancer |
| Tissue | Disease Stage | Enriched GO biological Processes |
| Colorectum | AD |  |
| Colorectum | SER |  |
| Colorectum | MSS |  |
| Colorectum | MSI-H |  |
| Colorectum | FAP |  |
| ∗Top 15 enriched GO BP terms are showed in the bar plot of each disease state in each tissue. Each row represents a significant GO biological process which is colored according to the -log10(p.adjust). |
| Page: 1 2 3 4 5 6 7 8 9 |
| GO ID | Tissue | Disease Stage | Description | Gene Ratio | Bg Ratio | pvalue | p.adjust | Count |
| GO:0030810 | Colorectum | FAP | positive regulation of nucleotide biosynthetic process | 9/2622 | 24/18723 | 3.66e-03 | 2.60e-02 | 9 |
| GO:1900373 | Colorectum | FAP | positive regulation of purine nucleotide biosynthetic process | 9/2622 | 24/18723 | 3.66e-03 | 2.60e-02 | 9 |
| GO:0046320 | Colorectum | FAP | regulation of fatty acid oxidation | 11/2622 | 33/18723 | 3.95e-03 | 2.75e-02 | 11 |
| GO:00435001 | Colorectum | FAP | muscle adaptation | 28/2622 | 121/18723 | 4.50e-03 | 3.06e-02 | 28 |
| GO:0032922 | Colorectum | FAP | circadian regulation of gene expression | 18/2622 | 68/18723 | 4.83e-03 | 3.25e-02 | 18 |
| GO:01061061 | Colorectum | FAP | cold-induced thermogenesis | 32/2622 | 144/18723 | 4.85e-03 | 3.25e-02 | 32 |
| GO:01201611 | Colorectum | FAP | regulation of cold-induced thermogenesis | 32/2622 | 144/18723 | 4.85e-03 | 3.25e-02 | 32 |
| GO:00486601 | Colorectum | FAP | regulation of smooth muscle cell proliferation | 38/2622 | 180/18723 | 5.73e-03 | 3.67e-02 | 38 |
| GO:19908451 | Colorectum | FAP | adaptive thermogenesis | 34/2622 | 157/18723 | 5.77e-03 | 3.69e-02 | 34 |
| GO:00100384 | Colorectum | FAP | response to metal ion | 70/2622 | 373/18723 | 5.95e-03 | 3.75e-02 | 70 |
| GO:00094093 | Colorectum | FAP | response to cold | 14/2622 | 49/18723 | 5.95e-03 | 3.75e-02 | 14 |
| GO:0010906 | Colorectum | FAP | regulation of glucose metabolic process | 27/2622 | 119/18723 | 6.87e-03 | 4.22e-02 | 27 |
| GO:01201621 | Colorectum | FAP | positive regulation of cold-induced thermogenesis | 23/2622 | 97/18723 | 6.95e-03 | 4.26e-02 | 23 |
| GO:00435233 | Colorectum | FAP | regulation of neuron apoptotic process | 43/2622 | 212/18723 | 7.28e-03 | 4.38e-02 | 43 |
| GO:00060122 | Colorectum | FAP | galactose metabolic process | 5/2622 | 10/18723 | 7.32e-03 | 4.38e-02 | 5 |
| GO:00510901 | Colorectum | FAP | regulation of DNA-binding transcription factor activity | 80/2622 | 440/18723 | 7.90e-03 | 4.67e-02 | 80 |
| GO:1902170 | Colorectum | FAP | cellular response to reactive nitrogen species | 7/2622 | 18/18723 | 8.10e-03 | 4.77e-02 | 7 |
| GO:00486591 | Colorectum | FAP | smooth muscle cell proliferation | 38/2622 | 184/18723 | 8.29e-03 | 4.85e-02 | 38 |
| GO:0030900 | Colorectum | FAP | forebrain development | 70/2622 | 379/18723 | 8.64e-03 | 4.98e-02 | 70 |
| GO:00098955 | Colorectum | CRC | negative regulation of catabolic process | 75/2078 | 320/18723 | 2.02e-10 | 9.31e-08 | 75 |
| Page: 1 2 3 4 5 6 7 8 9 10 11 12 13 14 15 16 17 18 19 20 21 22 23 24 25 26 27 28 29 30 31 32 33 34 35 36 37 38 39 40 41 42 43 44 45 46 47 48 49 50 51 52 53 54 55 56 57 58 59 60 61 62 63 64 65 66 67 68 69 70 71 72 73 74 |
| Pathway ID | Tissue | Disease Stage | Description | Gene Ratio | Bg Ratio | pvalue | p.adjust | qvalue | Count |
| hsa05016 | Colorectum | AD | Huntington disease | 147/2092 | 306/8465 | 1.93e-19 | 9.26e-18 | 5.91e-18 | 147 |
| hsa04714 | Colorectum | AD | Thermogenesis | 120/2092 | 232/8465 | 2.76e-19 | 1.16e-17 | 7.37e-18 | 120 |
| hsa04152 | Colorectum | AD | AMPK signaling pathway | 47/2092 | 121/8465 | 3.74e-04 | 2.82e-03 | 1.80e-03 | 47 |
| hsa04922 | Colorectum | AD | Glucagon signaling pathway | 41/2092 | 107/8465 | 1.18e-03 | 7.75e-03 | 4.94e-03 | 41 |
| hsa04211 | Colorectum | AD | Longevity regulating pathway | 33/2092 | 89/8465 | 6.15e-03 | 2.68e-02 | 1.71e-02 | 33 |
| hsa050161 | Colorectum | AD | Huntington disease | 147/2092 | 306/8465 | 1.93e-19 | 9.26e-18 | 5.91e-18 | 147 |
| hsa047141 | Colorectum | AD | Thermogenesis | 120/2092 | 232/8465 | 2.76e-19 | 1.16e-17 | 7.37e-18 | 120 |
| hsa041521 | Colorectum | AD | AMPK signaling pathway | 47/2092 | 121/8465 | 3.74e-04 | 2.82e-03 | 1.80e-03 | 47 |
| hsa049221 | Colorectum | AD | Glucagon signaling pathway | 41/2092 | 107/8465 | 1.18e-03 | 7.75e-03 | 4.94e-03 | 41 |
| hsa042111 | Colorectum | AD | Longevity regulating pathway | 33/2092 | 89/8465 | 6.15e-03 | 2.68e-02 | 1.71e-02 | 33 |
| hsa047142 | Colorectum | SER | Thermogenesis | 106/1580 | 232/8465 | 1.15e-21 | 6.34e-20 | 4.61e-20 | 106 |
| hsa050162 | Colorectum | SER | Huntington disease | 127/1580 | 306/8465 | 3.29e-21 | 1.37e-19 | 9.92e-20 | 127 |
| hsa049222 | Colorectum | SER | Glucagon signaling pathway | 38/1580 | 107/8465 | 2.57e-05 | 3.28e-04 | 2.38e-04 | 38 |
| hsa047143 | Colorectum | SER | Thermogenesis | 106/1580 | 232/8465 | 1.15e-21 | 6.34e-20 | 4.61e-20 | 106 |
| hsa050163 | Colorectum | SER | Huntington disease | 127/1580 | 306/8465 | 3.29e-21 | 1.37e-19 | 9.92e-20 | 127 |
| hsa049223 | Colorectum | SER | Glucagon signaling pathway | 38/1580 | 107/8465 | 2.57e-05 | 3.28e-04 | 2.38e-04 | 38 |
| hsa050164 | Colorectum | MSS | Huntington disease | 141/1875 | 306/8465 | 2.90e-21 | 1.62e-19 | 9.92e-20 | 141 |
| hsa047144 | Colorectum | MSS | Thermogenesis | 113/1875 | 232/8465 | 1.52e-19 | 4.62e-18 | 2.83e-18 | 113 |
| hsa049224 | Colorectum | MSS | Glucagon signaling pathway | 39/1875 | 107/8465 | 5.00e-04 | 3.45e-03 | 2.11e-03 | 39 |
| hsa042112 | Colorectum | MSS | Longevity regulating pathway | 33/1875 | 89/8465 | 9.33e-04 | 5.58e-03 | 3.42e-03 | 33 |
| Page: 1 2 3 4 5 |
Top |
Cell-cell communication analysis |
| Identification of potential cell-cell interactions between two cell types and their ligand-receptor pairs for different disease states |
| Ligand | Receptor | LRpair | Pathway | Tissue | Disease Stage |
| Page: 1 |
Top |
Single-cell gene regulatory network inference analysis |
| Find out the significant the regulons (TFs) and the target genes of each regulon across cell types for different disease states |
| TF | Cell Type | Tissue | Disease Stage | Target Gene | RSS | Regulon Activity |
| PPARGC1A | ICAF | Cervix | HSIL_HPV | SEMA3B,SLC7A2,KIAA0408, etc. | 2.52e-02 |  |
| ∗The dot plots of a searched regulon are shown for all cell subpopulations in each disease state of each tissue based on the regulon specific score inferred using pySCENIC and by calculating the average expression. |
| Page: 1 |
Top |
Somatic mutation of malignant transformation related genes |
| Annotation of somatic variants for genes involved in malignant transformation |
| Hugo Symbol | Variant Class | Variant Classification | dbSNP RS | HGVSc | HGVSp | HGVSp Short | SWISSPROT | BIOTYPE | SIFT | PolyPhen | Tumor Sample Barcode | Tissue | Histology | Sex | Age | Stage | Therapy Types | Drugs | Outcome |
| PPARGC1A | SNV | Missense_Mutation | rs749421285 | c.1063T>A | p.Tyr355Asn | p.Y355N | Q9UBK2 | protein_coding | deleterious(0) | probably_damaging(0.994) | TCGA-A2-A1G4-01 | Breast | breast invasive carcinoma | Female | >=65 | III/IV | Chemotherapy | adriamycin | SD |
| PPARGC1A | SNV | Missense_Mutation | rs139240743 | c.1841G>A | p.Arg614Gln | p.R614Q | Q9UBK2 | protein_coding | tolerated(0.06) | benign(0.018) | TCGA-AN-A046-01 | Breast | breast invasive carcinoma | Female | >=65 | I/II | Unknown | Unknown | SD |
| PPARGC1A | SNV | Missense_Mutation | c.695N>T | p.Ser232Ile | p.S232I | Q9UBK2 | protein_coding | deleterious(0.03) | possibly_damaging(0.491) | TCGA-B6-A0RL-01 | Breast | breast invasive carcinoma | Female | <65 | I/II | Unknown | Unknown | SD | |
| PPARGC1A | SNV | Missense_Mutation | novel | c.202N>A | p.Gln68Lys | p.Q68K | Q9UBK2 | protein_coding | deleterious(0) | benign(0.22) | TCGA-BH-A0B6-01 | Breast | breast invasive carcinoma | Female | <65 | I/II | Unknown | Unknown | SD |
| PPARGC1A | SNV | Missense_Mutation | c.1817G>A | p.Ser606Asn | p.S606N | Q9UBK2 | protein_coding | tolerated_low_confidence(0.26) | benign(0.007) | TCGA-BH-A0E1-01 | Breast | breast invasive carcinoma | Female | <65 | I/II | Chemotherapy | cytoxan | SD | |
| PPARGC1A | SNV | Missense_Mutation | c.1978N>C | p.Glu660Gln | p.E660Q | Q9UBK2 | protein_coding | tolerated(0.08) | benign(0.153) | TCGA-C8-A274-01 | Breast | breast invasive carcinoma | Female | <65 | I/II | Hormone Therapy | tamoxiphen | SD | |
| PPARGC1A | SNV | Missense_Mutation | novel | c.1511G>A | p.Gly504Glu | p.G504E | Q9UBK2 | protein_coding | tolerated_low_confidence(0.11) | probably_damaging(0.999) | TCGA-E2-A1LH-01 | Breast | breast invasive carcinoma | Female | <65 | I/II | Chemotherapy | adriamycin | SD |
| PPARGC1A | SNV | Missense_Mutation | novel | c.2271N>A | p.Phe757Leu | p.F757L | Q9UBK2 | protein_coding | tolerated(0.26) | benign(0.001) | TCGA-C5-A901-01 | Cervix | cervical & endocervical cancer | Female | <65 | I/II | Unknown | Unknown | SD |
| PPARGC1A | SNV | Missense_Mutation | c.664N>T | p.His222Tyr | p.H222Y | Q9UBK2 | protein_coding | deleterious(0.02) | benign(0.388) | TCGA-EK-A3GK-01 | Cervix | cervical & endocervical cancer | Female | <65 | I/II | Unknown | Unknown | SD | |
| PPARGC1A | SNV | Missense_Mutation | rs143103266 | c.1951N>T | p.Arg651Cys | p.R651C | Q9UBK2 | protein_coding | deleterious(0) | probably_damaging(0.985) | TCGA-FU-A3HZ-01 | Cervix | cervical & endocervical cancer | Female | <65 | I/II | Chemotherapy | cisplatin | CR |
| Page: 1 2 3 4 5 6 7 8 9 10 11 12 13 |
Top |
Related drugs of malignant transformation related genes |
| Identification of chemicals and drugs interact with genes involved in malignant transfromation |
| (DGIdb 4.0) |
| Entrez ID | Symbol | Category | Interaction Types | Drug Claim Name | Drug Name | PMIDs |
| Page: 1 |

Copyright 2023-Present -The University of Texas Health Science Center at Houston |